- You are here:
-
Home

-
Contents (2)
-
Part XVII. Services and Trade
-
Transport Industry and Warehousing
-
Storage
- Quick, James Campbell

Kjellén, Urban
Address: Norsk Hydro A.S., Postboks 200, 1321 Stabekk
Country: Norway
Phone: 47 22 739 776
Fax: 47 22 737 870
E-mail: NHTUKJ@NHT.HYDRO.COM
Past position(s): Senior Research Engineer, Royal Institute of Technology, Stockholm
Education: MS, 1971, Royal Institute of Technology, Stockholm; PhD, 1983, Royal Institute of Technology, Stockholm
Areas of interest: Management of health, safety and environment; safety information systems; risk analysis
Hazard Analysis: Organizational Factors - mort
Through industrialization, workers became organized in factories as the utilization of energy sources such as the steam engine became possible. As compared to traditional handicraft, mechanized production, with sources of higher energy at its disposal, presented new risks of accidents. As the amount of energy increased, workers were removed from the direct control of these energies. Decisions that affected safety were often made at the management level rather than by those directly exposed to these risks. At this stage of industrialization, the need for safety management became evident.
In the late 1920s, Heinrich formulated the first comprehensive theoretical framework for safety management, which was that safety should be sought through management decisions based on identification and analysis of accident causes. At this point in the development of safety management, accidents were attributed to failures at the worker-machine system level - that is, to unsafe acts and unsafe conditions.
Subsequently, various methodologies were developed for the identification and assessment of accident risks. With MORT (Management Oversight and Risk Tree), the focus shifted to the higher orders of control of accident risks - that is, to the control of conditions at the management level. The initiative to develop MORT was taken in the late 1960s by the US Energy Research and Development Administration, which wanted to improve their safety programmes in order to reduce their losses due to accidents.
The MORT Diagram and Underlying Principles
The intent of MORT was to formulate an ideal safety management system based on a synthesis of the best safety programme elements and safety management techniques then available. As the principles underlying the MORT initiative were applied to the contemporary state of the art in safety management, the largely unstructured safety literature and expertise took on the form of an analytical tree. The first version of the tree was published in 1971. Figure 1 shows the basic elements of the version of the tree that was published by Johnson in 1980. The tree also appears in a modified form in later publications on the subject of the MORT concept (see, for example, Knox and Eicher 1992).
Figure 1. A version of the MORT analytical tree

The MORT Diagram
MORT is used as a practical tool in accident investigations and in evaluations of existing safety programmes. The top event of the tree in figure 1 (Johnson 1980) represents the losses (experienced or potential) due to an accident. Below this top event are three main branches: specific oversights and omissions (S), management oversights and omissions (M) and assumed risks (R). The R-branch consists of assumed risks, which are events and conditions that are known to management and that have been evaluated and accepted at the proper management level. Other events and conditions that are revealed through the evaluations following the S- and M-branches are denoted “less than adequate” (LTA).
The S-branch focuses on the events and conditions of the actual or potential occurrence. (In general, time is shown as one reads from left to right, and the sequence of causes is shown as one reads from bottom to top.) Haddon’s strategies (1980) for the prevention of accidents are key elements in this branch. An event is denoted an accident when a target (a person or object) is exposed to an uncontrolled transfer of energy and sustains damage. In the S-branch of MORT, accidents are prevented through barriers. There are three basic types of barriers: (1) barriers that surround and confine the energy source (the hazard), (2) barriers that protect the target and (3) barriers that separate the hazard and the target physically or in time or space. These different types of barriers are found in the development of the branches below the accidental event. Amelioration relates to the actions taken after the accident to limit the losses.
At the next level of the S-branch, factors are recognized which relate to the different phases of the life cycle of an industrial system. These are the project phase (design and plan), start up (operational readiness) and operation (supervision and maintenance).
The M-branch supports a process in which specific findings from an accident investigation or safety programme evaluation are made more general. Events and conditions of the S-branch thus often have their counterparts in the M-branch. When engaged with the system at the M-branch, the analyst’s thinking is expanded to the total management system. Thus, any recommendations will affect many other possible accident scenarios as well. The most important safety management functions can be found in the M-branch: the setting of policy, implementation and follow-up. These are the same basic elements that we find in the quality assurance principles of the ISO 9000 series published by the International Organization for Standardization (ISO).
When the branches of the MORT diagram are elaborated in detail, there are elements from such different fields as risk analysis, human factors analysis, safety information systems and organizational analysis. In total, about 1,500 basic events are covered by the MORT diagram.
Application of the MORT Diagram
As indicated, the MORT diagram has two immediate uses (Knox and Eicher 1992): (1) to analyse management and organizational factors relative to an accident that has happened and (2) to evaluate or audit a safety programme in relation to a significant accident that has the potential of occurring. The MORT diagram functions as a screening tool in planning the analyses and evaluations. It is also used as a checklist for comparison of actual conditions with the idealized system. In this application, MORT facilitates checking the completeness of the analysis and avoiding personal biases.
At bottom, MORT is made up of a collection of questions. Criteria that guide judgements as to whether specific events and conditions are satisfactory or less than adequate are derived from these questions. In spite of the directive design of the questions, the judgements made by the analyst are partly subjective. It has thus become important to ensure an adequate quality and degree of intersubjectivity among MORT analyses made by different analysts. For example, in the United States, a training programme is available for certification of MORT analysts.
Experiences with MORT
The literature on evaluations of MORT is sparse. Johnson reports significant improvements in the comprehensiveness of accident investigations after the introduction of MORT (Johnson 1980). Deficiencies at the supervisory and management levels were revealed more systematically. Experience has also been gained from evaluations of MORT applications within Finnish industry (Ruuhilehto 1993). Some limitations have been identified in the Finnish studies. MORT does not support the identification of immediate risks due to failures and disturbances. Furthermore, no capability for setting priorities is built into the MORT concept. Consequently, the results of MORT analyses need further evaluation to translate them into remedial actions. Finally, experience shows that MORT is time-consuming and requires expert participation.
Aside from its ability to focus on organizational and management factors, MORT has the further advantage of connecting safety with normal production activities and general management. The application of MORT will thus support general planning and control, and help reduce the frequency of production disturbances as well.
Associated Safety Management Methods and Techniques
With the introduction of the MORT concept in the early 1970s, a development programme started in the United States. The focal point for this programme has been the System Safety Development Center in Idaho Falls. Different MORT-associated methods and techniques in such areas as human factors analysis, safety information systems and safety analysis have resulted from this programme. An early example of a method arising from the MORT development programme is the Operational Readiness Program (Nertney 1975). This programme is introduced during the development of new industrial systems and modifications of existing ones. The aim is to ensure that, from the safety management point of view, the new or modified system is ready at the time of start-up. A condition of operational readiness presupposes that the necessary barriers and controls have been installed in the new system’s hardware, personnel and procedures. Another example of a MORT programme element is the MORT-based root cause analysis (Cornelison 1989). It is used to identify the basic safety management problems of an organization. This is done by relating the specific findings of the MORT analyses to 27 different generic safety management problems.
Although MORT is not intended for use directly in the collection of information during accident investigations and safety audits, in Scandinavia, the MORT questions have served as a basis for the development of a diagnostic tool used for this purpose. It is called the Safety Management and Organization Review Technique, or SMORT (Kjellén and Tinmannsvik 1989). A SMORT analysis advances backwards in steps, starting from the specific situation and ending at the general management level. The starting point (level 1) is an accident sequence or a risk situation. At level 2, the organization, system planning and technical factors related to daily operation are scrutinized. The subsequent levels include design of new systems (level 3) and higher management functions (level 4). Findings on one level are extended to the levels above. For example, results related to the accident sequence and to daily operations are used in the analysis of the company’s organization and routines for project work (level 3). Results at level 3 will not affect safety in existing operations but may be applied to the planning of new systems and modifications. SMORT also differs from MORT in the way findings are identified. At level 1, these are observable events and conditions that deviate from generally accepted norms. When organizational and management factors are brought into the analysis at levels 2 to 4, the findings are identified through value judgements made by an analysis group and verified through a quality control procedure. The aim is to ensure a mutually shared understanding of the organizational problems.
Summary
MORT has been instrumental in developments within safety management since the 1970s. It is possible to track the influence of MORT to such areas as safety research literature, literature on safety management and audit tools, and legislation on self-regulation and internal control. In spite of this impact, its limitations must be carefully considered. MORT and associated methods are normative in the sense that they prescribe how safety management programmes should be organized and executed. The ideal is a well-structured organization with clear and realistic goals and well-defined lines of responsibility and authority. MORT is thus best suited for large and bureaucratic organizations.
Accident Deviation Models
An occupational accident may be regarded as an abnormal or unwanted effect of the processes in an industrial system, or something which does not work as planned. Unwanted effects other than personal injury are also possible, such as material damage, accidental release of pollution to the environment, time delay or reduced product quality. The deviation model is rooted in systems theory. When applying the deviation model, accidents are analysed in terms of deviations.
Deviations
The definition of deviations in relation to specified requirements coincides with the definition of nonconformities in the International Organization for Standardization’s ISO 9000 series of standards on quality management (ISO 1994). The value of a systems variable is classified as a deviation when it falls outside a norm. Systems variables are measurable characteristics of a system, and they can assume different values.
Norms
There are four different types of norms. These relate to: (1) specified requirements, (2) what has been planned, (3) what is normal or usual and (4) what is accepted. Each type of norm is characterized by the way it has been established and its degree of formalization.
Safety regulations, rules and procedures are examples of specified requirements. A typical example of a deviation from a specified requirement is a “human error”, which is defined as a transgression of a rule. The norms that relate to what is “normal or usual” and what is “accepted” are less formalized. They are typically applied in industrial settings, where the planning is oriented to outcome and the execution of the work is left to the discretion of the operators. An example of a deviation from an “accepted” norm is an “incidental factor”, which is an unusual event that may (or may not) result in an accident (Leplat 1978). A further example is an “unsafe act”, which traditionally was defined as a personal action violating a commonly accepted safe procedure (ANSI 1962).
Systems Variables
In the application of the deviation model, the set or range of values of systems variables is divided into two classes, namely, normal and deviation. The distinction between normal and deviation may be problematic. Differences of opinion about what is normal may arise, for example, among workers, supervisors, management and systems designers. Another problem relates to the lack of norms in work situations which have not been encountered before (Rasmussen, Duncan and Leplat 1987). These differences of opinion and the lack of norms may in themselves contribute to an increased risk.
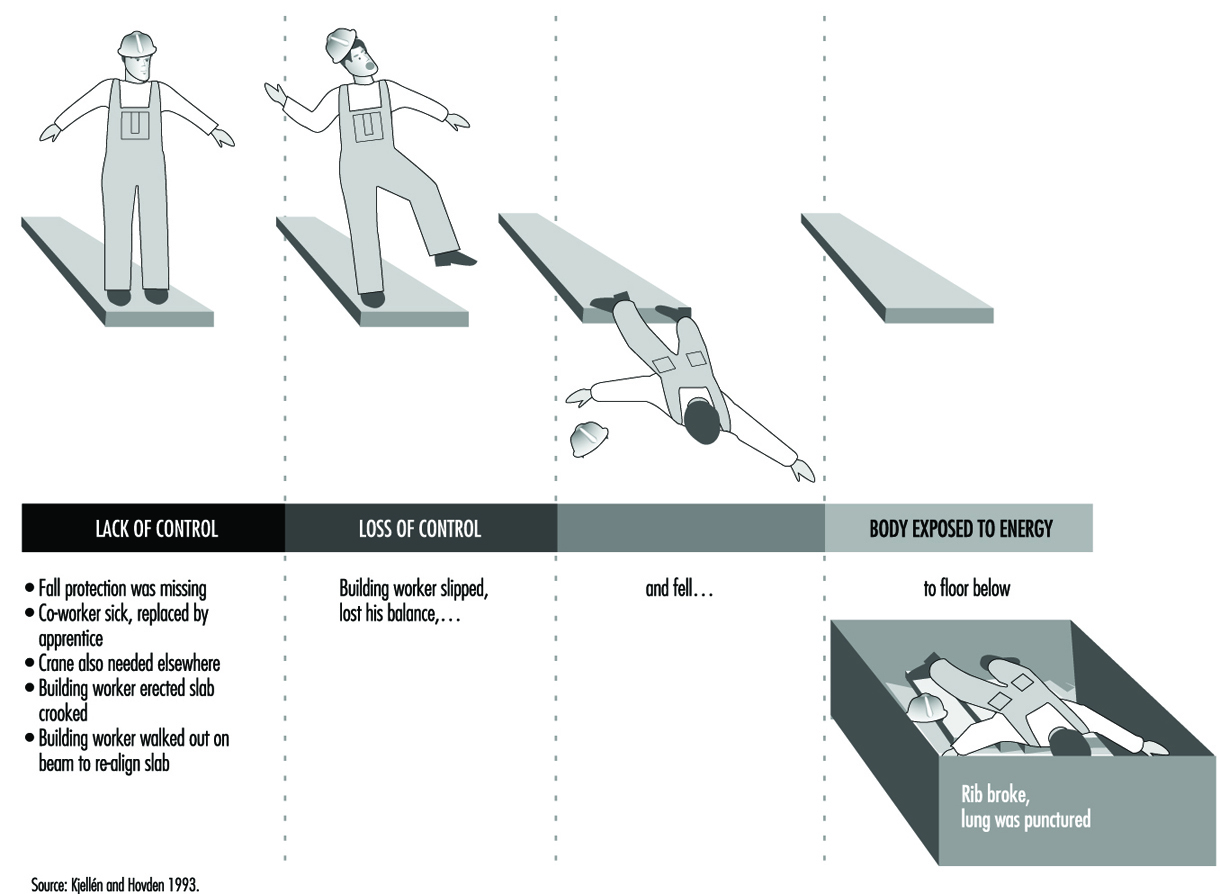
The Time Dimension
Time is a basic dimension in the deviation model. An accident is analysed as a process rather than as a single event or a chain of causal factors. The process develops through consecutive phases, so that there is a transition from normal conditions in the industrial system to abnormal conditions or a state of lack of control. Subsequently, a loss of control of energies in the system occurs and the damage or injury develops. Figure 1 shows an example of the analysis of an accident based on a model developed by the Occupational Accident Research Unit (OARU) in Stockholm, in relation to these transitions.
Figure 1. Accident analysis at construction site using OARU model
Focus on Accident Control
Each accident model has a unique focus, which is linked to an accident-prevention strategy. The deviation model puts the focus on the initial phase of the accident sequence, which is characterized by the state of abnormal conditions or lack of control. Accident prevention is accomplished through feedback where established information systems for production planning and control and safety management are used. The aim is to conduct a smooth operation with as few disturbances and improvisations as possible, so as to not increase the risk of accidents.
A distinction is made between corrective and preventive actions. Correction of deviations coincides with the first order of feedback in Van Court Hare’s hierarchy of feedback, and does not result in any organizational learning from the accident experiences (Hare 1967). Preventive actions are accomplished through higher orders of feedback that involve learning. An example of a preventive action is the development of new work instructions based on commonly shared norms about safe work routines. In general, there are three different aims of preventive actions: (1) to reduce the probability of deviations, (2) to reduce the consequences of deviations and (3) to reduce the time from the occurrence of deviations to their identification and correction.
To illustrate the characteristics of the deviation model, a comparison is made with the energy model (Haddon 1980) which directs the focus of accident prevention on the later phases of the accident process—that is, the loss of control of energies and subsequent harm. Accident prevention is typically accomplished through limitation or control of energies in the system or by interposing barriers between the energies and the victim.
Taxonomies of Deviations
There are different taxonomies for the classification of deviations. These have been developed to simplify the collection, processing and feedback of data on deviations. Table 1 presents an overview.
Table 1. Examples of taxonomies for the classification of deviations
|
Theory or model and variable |
Classes |
|
Process model |
|
|
Duration |
Event/act, condition |
|
Phase of the accident sequence |
Initial phase, concluding phase, injury phase |
|
Systems theory |
|
|
Subject-object |
(Act of) person, mechanical/physical condition |
|
Systems ergonomics |
Individual, task, equipment, environment |
|
Industrial engineering |
Materials, labour power, information, |
|
Human errors |
|
|
Human actions |
Omission, commission, extraneous act, |
|
Energy model |
|
|
Type of energy |
Thermal, radiation, mechanical, electrical, chemical |
|
Type of energy control system |
Technical, human |
|
Consequences |
|
|
Type of loss |
No significant time loss, degraded output |
|
Extent of loss |
Negligible, marginal, critical, catastrophic |
Source: Kjellén 1984.
A classical taxonomy of deviations is the distinction between “unsafe act of persons” and “unsafe mechanical/physical conditions” (ANSI 1962). This taxonomy combines a classification with respect to duration and the subject-object split. The OARU model is based on an industrial engineering systems view (Kjellén and Hovden 1993) wherein each class of deviations is related to a typical system for production control. It follows, for example, that deviations related to work materials are controlled through material control, and technical deviations are controlled through inspection and maintenance routines. Stationary guards are typically controlled through safety inspections. Deviations that describe the loss of control of energies are characterized by the type of energy involved (Haddon 1980). A distinction is also made between failures in human and technical systems for the control of energies (Kjellén and Hovden 1993).
The Validity of the Deviation Concept
No general relationships exist between deviations and the risk of injury. Research results suggest, however, that some types of deviations are associated with an increased risk of accidents in certain industrial systems (Kjellén 1984). These include defective equipment, production disturbances, irregular workload and tools used for unusual purposes. The type and amount of energy that is involved in the uncontrolled energy flow are fairly good predictors of the consequences.
Application of the Deviation Model
Data on deviations are collected in safety inspections, safety sampling, near-accident reporting and accident investigations. (See figure 2).
Figure 2. Coverage of different tools for use in safety practice

For example, Safety sampling is a method for the control of deviations from safety rules through performance feedback to the workers. Positive effects of safety sampling on safe performance, as measured by the risk of accidents, have been reported (Saari 1992).
The deviation model has been applied in the development of tools for use in accident investigations. In the incidental factors analysis method, deviations of the accident sequence are identified and arranged in a logical tree structure (Leplat 1978). The OARU model has been the basis for the design of accident investigation forms and checklists and for the structuring of the accident investigation procedure. Evaluation research shows that these methods support a comprehensive and reliable charting and evaluation of deviations (see Kjellén and Hovden 1993 for a review). The deviation model has also inspired the development of methods for risk analysis.
Deviation analysis is a risk analysis method and encompasses three steps: (1) the summarizing of systems functions and operator activities and their division into subsections, (2) the examination of each activity to identify possible deviations and to assess the potential consequences of each deviation and (3) the development of remedies (Harms-Ringdahl 1993). The accident process is modelled as illustrated by figure 1 , and the risk analysis covers all three phases. Checklists similar to those applied in accident investigations are used. It is possible to integrate this method with design tasks; it is further effective in identifying needs for remedial actions.
Summary
Deviation models focus on the early part of the accident process, where there are disturbances in the operation. Prevention is accomplished through feedback control in order to achieve a smooth operation with few disturbances and improvisations that may result in accidents.
" DISCLAIMER: The ILO does not take responsibility for content presented on this web portal that is presented in any language other than English, which is the language used for the initial production and peer-review of original content. Certain statistics have not been updated since the production of the 4th edition of the Encyclopaedia (1998)."