- You are here:
-
Home

- k2 Feed
Exposure to Physical Agents
Health care workers (HCWs) confront numerous physical hazards.
Electrical Hazards
Failure to meet standards for electrical equipment and its use is the most frequently cited violation in all industries. In hospitals, electrical malfunctions are the second leading cause of fires. Additionally, hospitals require that a wide variety of electrical equipment be used in hazardous environments (i.e., in wet or damp locations or adjacent to flammables or combustibles).
Recognition of these facts and the danger they may pose to patients has led most hospitals to put great effort into electrical safety promotion in patient-care areas. However, non-patient areas are sometimes neglected and employee- or hospital-owned appliances may be found with:
- three-wire (grounded) plugs attached to two-wire (ungrounded) cords
- ground prongs bent or cut off
- ungrounded appliances attached to ungrounded multiple-plug “spiders”
- extension cords with improper grounding
- cords moulded to plugs not properly wired (25% of the x-ray equipment in one hospital study was incorrectly wired).
Prevention and control
It is critical that all electrical installations be in accordance with prescribed safety standards and regulations. Measures that can be taken to prevent fires and avoid shocks to employees include the following:
- provision for regular inspection of all employee work areas by an electrical engineer to discover and correct hazardous conditions such as ungrounded or poorly maintained appliances or tools
- inclusion of electrical safety in both orientation and in-service training programmes.
Employees should be instructed:
- not to use electrical equipment with wet hands, on wet surfaces or when standing on wet floors
- not to use devices that blow a fuse or trip a circuit breaker until they have been inspected
- not to use any appliance, equipment or wall receptacle that appears to be damaged or in poor repair
- to use extension cords only temporarily and only in emergency situations
- to use extension cords designed to carry the voltage required
- to turn off equipment before unplugging it
- to report all shocks immediately (including small tingles) and not to use equipment again until it has been inspected.
Heat
Although heat-related health effects on hospital workers can include heat stroke, exhaustion, cramps and fainting, these are rare. More common are the milder effects of increased fatigue, discomfort and inability to concentrate. These are important because they may increase the risk of accidents.
Heat exposure can be measured with wet bulb and globe thermometers, expressed as the Wet Bulb Globe Temperature (WBGT) Index, which combines the effects of radiant heat and humidity with the dry bulb temperature. This testing should only be done by a skilled individual.
The boiler room, laundry and kitchen are the most common high-temperature environments in the hospital. However, in old buildings with inadequate ventilation and cooling systems heat may be a problem in many locations in summer months. Heat exposure may also be a problem where ambient temperatures are elevated and health care personnel are required to wear occlusive gowns, caps, masks and gloves.
Prevention and control
Although it may be impossible to keep some hospital settings at a comfortable temperature, there are measures to keep temperatures at acceptable levels and to ameliorate the effects of heat upon workers, including:
- provision of adequate ventilation. Central air-conditioning systems may need to be supplemented by floor fans, for example.
- making cool drinking water easily accessible
- rotating employees so that periodic relief is scheduled
- scheduling frequent breaks in cool areas.
Noise
Exposure to high levels of noise in the workplace is a common job hazard. The “quiet” image of hospitals notwithstanding, they can be noisy places to work.
Exposure to loud noises can cause a loss in hearing acuity. Short-term exposure to loud noises can cause a decrease in hearing called a “temporary threshold shift” (TTS). While these TTSs can be reversed with sufficient rest from high noise levels, the nerve damage resulting from long-term exposure to loud noises cannot.
The US Occupational Safety and Health Administration (OSHA) has set 90 dBA as the permissible limit per 8 hours of work. For 8-hour average exposures in excess of 85 dBA, a hearing conservation programme is mandated. (Sound level meters, the basic noise measuring instrument, are provided with three weighting networks. OSHA standards use the A scale, expressed as dBA.)
The effects of noise at the 70-dB level are reported by the National Institute of Environmental Health Sciences to be:
- blood vessel constriction that can lead to higher blood pressure and decreased circulation in the hands and feet (perceived as coldness)
- headaches
- increased irritability
- difficulty in communicating with co-workers
- reduced ability to work
- more difficulty with tasks that require alertness, concentration and attention to detail.
Food service areas, laboratories, engineering areas (which usually includes the boiler room), business office and medical records and nursing units can be so noisy that productivity is reduced. Other departments where noise levels are sometimes quite high are laundries, print shops and construction areas.
Prevention and control
If a noise survey of the facility shows that employees’ noise exposure is in excess of the OSHA standard, a noise abatement programme is required. Such a programme should include:
- periodic measurement
- engineering controls such as isolating noisy equipment, installing mufflers and acoustic ceilings and carpets
- administrative controls limiting workers’ exposure time to excessive noise.
In addition to abatement measures, a hearing conservation programme should be established that provides for:
- hearing tests for new employees to provide baselines for future testing
- annual audiometric testing
- hearing protection for use while controls are being implemented and for situations where levels cannot be brought within approved limits.
Inadequate Ventilation
The specific ventilation requirements for various types of equipment are engineering matters and will not be discussed here. However, both old and new facilities present general ventilation problems that warrant mentioning.
In older facilities built before central heating and cooling systems were common, ventilation problems must often be solved on a location-by-location basis. Frequently, the problem rests in achieving uniform temperatures and correct circulation.
In newer facilities that are hermetically sealed, a phenomenon called “tight-building syndrome” or “sick building syndrome” is sometimes experienced. When the circulation system does not exchange the air rapidly enough, concentrations of irritants may build up to the extent that employees may experience such reactions as sore throat, runny nose and watery eyes. This situation can provoke severe reaction in sensitized individuals. It can be exacerbated by various chemicals emitted from such sources as foam insulation, carpeting, adhesives and cleaning agents.
Prevention and control
While careful attention is paid to ventilation in sensitive areas such as surgical suites, less attention is given to general-purpose areas. It is important to alert employees to report irritant reactions that appear only in the workplace. If local air quality cannot be improved with venting, it may be necessary to transfer individuals who have become sensitized to some irritant in their workstation.
Laser Smoke
During surgical procedures using a laser or electrosurgical unit, the thermal destruction of tissue creates smoke as a by-product. NIOSH has confirmed studies showing that this smoke plume can contain toxic gases and vapours such as benzene, hydrogen cyanide and formaldehyde, bioaerosols, dead and live cellular material (including blood fragments) and viruses. At high concentrations, the smoke causes ocular and upper respiratory tract irritation in health care personnel and may create visual problems for the surgeon. The smoke has an unpleasant odour and has been shown to have mutagenic material.
Prevention and control
Exposure to airborne contaminants in such smoke can be effectively controlled by proper ventilation of the treatment room, supplemented by local exhaust ventilation (LEV) using a high-efficiency suction unit (i.e., a vacuum pump with an inlet nozzle held within 2 inches of the surgical site) that is activated throughout the procedure. Both the room ventilation system and the local exhaust ventilator should be equipped with filters and absorbers that capture particulates and absorb or inactivate airborne gases and vapours. These filters and absorbers require monitoring and replacement on a regular basis and are considered a possible biohazard requiring proper disposal.
Radiation
Ionizing radiation
When ionizing radiation strikes cells in living tissue, it may either kill the cell directly (i.e., cause burns or hair loss) or it may alter the genetic material of the cell (i.e., cause cancer or reproductive damage). Standards involving ionizing radiation may refer to exposure (the amount of radiation the body is exposed to) or dose (the amount of radiation the body absorbs) and may be expressed in terms of millirem (mrem), the usual measure of radiation, or rems (1,000 millirems).
Various jurisdictions have developed regulations governing the procurement, use, transportation and disposal of radioactive materials, as well as established limits for exposure (and in some places specific limits for dosage to various parts of the body), providing a strong measure of protection for radiation workers. In addition, institutions using radioactive materials in treatment and research generally develop their own internal controls in addition to those prescribed by law.
The greatest dangers to hospital workers are from scatter, the small amount of radiation that is deflected or reflected from the beam into the immediate vicinity, and from unexpected exposure, either because they are inadvertently exposed in an area not defined as a radiation area or because the equipment is not well maintained.
Radiation workers in diagnostic radiology (including x ray, fluoroscopy and angiography for diagnostic purposes, dental radiography and computerized axial tomography (CAT) scanners), in therapeutic radiology, in nuclear medicine for diagnostic and therapeutic procedures, and in radiopharmaceutical laboratories are carefully followed and checked for exposure, and radiation safety is usually well managed in their workstations, although there are many localities in which control is inadequate.
There are other areas not usually designated as “radiation areas”, where careful monitoring is needed to ensure that appropriate precautions are being taken by staff and that correct safeguards are provided for patients who might be exposed. These include angiography, emergency rooms, intensive care units, locations where portable x rays are being taken and operating rooms.
Prevention and control
The following protective measures are strongly recommended for ionizing radiation (x rays and radioisotopes):
- Rooms that house radiation sources should be properly marked and entered only by authorized personnel.
- All films should be held in place by patients or members of the patient’s family. If the patient must be held, a member of the family should do so. If staff must hold film or patients, the task should be rotated through the staff to minimize the overall dose per individual.
- Where portable x-ray units and radioisotopes are used, only the patient and trained personnel should be allowed in the room.
- Adequate warning should be given to nearby workers when x rays using portable units are about to be taken.
- X-ray controls should be located to prevent the unintentional energizing of the unit.
- X-ray room doors should be kept closed when equipment is in use.
- All x-ray machines should be checked before each use to ensure that the secondary radiation cones and filters are in place.
- Patients who have received radioactive implants or other therapeutic radiology procedures should be clearly identified. Bedding, dressings, wastes and so forth from such patients should be so labelled.
Lead aprons, gloves and goggles must be worn by employees working in the direct field or where scatter radiation levels are high. All such protective equipment should be checked annually for cracks in the lead.
Dosimeters must be worn by all personnel exposed to ionizing radiation sources. Dosimeter badges should be regularly analysed by a laboratory with good quality control, and the results should be recorded. Records must be kept not only of each employee’s personal radiation exposure but also of the receipt and disposition of all radioisotopes.
In therapeutic radiology settings, periodic dose checks should be done using lithium fluoride (LiF) solid-state dosimeters to check on system calibration. Treatment rooms should be equipped with radiation monitor-door interlock and visual-alarm systems.
During internal or intravenous treatment with radioactive sources, the patient should be housed in a room located to minimize exposure to other patients and staff and signs posted warning others not to enter. Staff contact time should be limited, and staff should be careful in handling bedding, dressings and wastes from these patients.
During fluoroscopy and angiography, the following measures can minimize unnecessary exposure:
- full protective equipment
- minimal number of personnel in the room
- “dead-man” switches (must have active operator control)
- minimal beam size and energy
- careful shielding to reduce scatter.
Full protective equipment should also be used by operating-room personnel during radiation procedures, and, when possible, personnel should stand 2 m or more from the patient.
Non-ionizing radiation
Ultraviolet radiation, lasers and microwaves are non-ionizing radiation sources. They are generally far less hazardous than ionizing radiation but nevertheless require special care to prevent injury.
Ultraviolet radiation is used in germicidal lamps, in certain dermatology treatments and in air filters in some hospitals. It is also produced in welding operations. Exposure of the skin to ultraviolet light causes sunburn, ages the skin and increases the risk of skin cancer. Eye exposure can result in temporary but extremely painful conjunctivitis. Long-term exposure can lead to partial loss of vision.
Standards regarding exposure to ultraviolet radiation are not widely applicable. The best approach to prevention is education and wearing shaded protective eyeglasses.
The Bureau of Radiological Health of the US Food and Drug Administration regulates lasers and classifies them into four classes, I to IV. The laser used to position patients in radiology is considered Class I and represents minimal risk. Surgical lasers, however, can pose a significant hazard to the retina of the eye where the intense beam can cause total loss of vision. Because of the high voltage supply required, all lasers present the risk of electrical shock. The accidental reflection of the laser beam during surgical procedures can result in injury to the staff. Guidelines for laser use have been developed by the American National Standards Institute and the US Army; for example, laser users should wear protective goggles specifically designed for each type of laser and take care not to focus the beam on reflecting surfaces.
The primary concern regarding exposure to microwaves, which are used in hospitals chiefly for cooking and heating food and for diathermy treatments, is the heating effect they have on the body. The eye lens and gonads, having fewer vessels with which to remove heat, are most vulnerable to damage. The long-term effects of low-level exposure have not been established, but there is some evidence that nervous system effects, decreased sperm count, sperm malformations (at least partially reversible after exposure ceases) and cataracts may result.
Prevention and control
The OSHA standard for exposure to microwaves is 10 milliwatts per square centimetre (10 mW/cm). This is the level established to protect against the thermal effects of microwaves. In other countries where levels have been established to protect against reproductive and nervous system damage, the standards are as much as two orders of magnitude lower, that is, 0.01 mW/cm2 at 1.2 m.
To ensure the safety of workers, microwave ovens should be kept clean to protect the integrity of the door seals and should be checked for leakage at least every three months. Leakage from diathermy equipment should be monitored in the vicinity of the therapist before each treatment.
Hospital workers should be aware of the radiation hazards of ultraviolet exposure and of infrared heat used for therapy. They should have appropriate eye protection when using or repairing ultraviolet equipment, such as germicidal lamps and air purifiers or infrared instruments and equipment.
Conclusion
Physical agents represent an important class of hazards to workers in hospitals, clinics and private offices where diagnostic and therapeutic procedures are performed. These agents are discussed in more detail elsewhere in this Encyclopaedia. Their control requires education and training of all health professionals and support staff who may be involved and constant vigilance and systemic monitoring of both the equipment and the way it is used.
Work Schedules and Night Work in Health Care
For a long time, nurses and nursing assistants were among the only women working at night in many countries (Gadbois 1981; Estryn-Béhar and Poinsignon 1989). In addition to the problems already documented among men, these women suffer additional problems related to their family responsibilities. Sleep deprivation has been convincingly demonstrated among these women, and there is concern about the quality of care they are able to dispense in the absence of appropriate rest.
Organization of Schedules and Family Obligations
It appears that personal feelings about social and family life are at least partially responsible for the decision to accept or refuse night work. These feelings, in turn, lead workers to minimize or exaggerate their health problems (Lert, Marne and Gueguen 1993; Ramaciotti et al. 1990). Among non-professional personnel, financial compensation is the main determinant of the acceptance or refusal of night work.
Other work schedules may also pose problems. Morning-shift workers sometimes must rise before 05:00 and so lose some of the sleep that is essential for their recovery. Afternoon shifts finish between 21:00 and 23:00, limiting social and family life. Thus, often only 20% of women working in large university hospitals have work schedules in synchrony with the rest of society (Cristofari et al. 1989).
Complaints related to work schedules are more frequent among health care workers than among other employees (62% versus 39%) and indeed are among the complaints most frequently voiced by nurses (Lahaye et al. 1993).
One study demonstrated the interaction of work satisfaction with social factors, even in the presence of sleep deprivation (Verhaegen et al. 1987). In this study, nurses working only night shifts were more satisfied with their work than nurses working rotating shifts. These differences were attributed to the fact that all the night-shift nurses chose to work at night and organized their family life accordingly, while rotating-shift nurses found even rare night-shift work a disturbance of their personal and family lives. However, Estryn-Béhar et al. (1989b) reported that mothers working only night shifts were more tired and went out less frequently compared with male night-shift nurses.
In the Netherlands, the prevalence of work complaints was higher among nurses working rotating shifts than among those working only day shifts (Van Deursen et al. 1993) (see table 1).
Table 1. Prevalence of work complaints according to shift
|
Rotating shifts (%) |
Day shifts (%) |
|
|
Arduous physical work |
55.5 |
31.3 |
|
Arduous mental work |
80.2 |
61.9 |
|
Work often too tiring |
46.8 |
24.8 |
|
Under-staffing |
74.8 |
43.8 |
|
Insufficient time for breaks |
78.4 |
56.6 |
|
Interference of work with private life |
52.8 |
31.0 |
|
Dissatisfaction with schedules |
36.9 |
2.7 |
|
Frequent lack of sleep |
34.9 |
19.5 |
|
Frequent fatigue on rising |
31.3 |
17.3 |
Source: Van Deursen et al. 1993.
Sleep disturbances
On workdays, night-shift nurses sleep an average of two hours less than other nurses (Escribà Agüir et al. 1992; Estryn-Béhar et al. 1978; Estryn-Béhar et al. 1990; Nyman and Knutsson 1995). According to several studies, their quality of sleep is also poor (Schroër et al. 1993; Lee 1992; Gold et al. 1992; Estryn-Béhar and Fonchain 1986).
In their interview study of 635 Massachusetts nurses, Gold et al. (1992) found that 92.2% of nurses working alternating morning and afternoon shifts were able to maintain a nocturnal “anchor” sleep of four hours at the same schedule throughout the month, compared to only 6.3% of night-shift nurses and none of the nurses working alternating day and night shifts. The age- and seniority-adjusted odds ratio for “poor sleep” was 1.8 for night-shift nurses and 2.8 for rotating-shift nurses with night work, compared to morning- and afternoon-shift nurses. The odds ratio for taking sleep medication was 2.0 for night- and rotating-shift nurses, compared to morning- and afternoon-shift nurses.
Affective Problems and Fatigue
The prevalence of stress-related symptoms and reports of having stopped enjoying their work was higher among Finnish nurses working rotating shifts than among other nurses (Kandolin 1993). Estryn-Béhar et al. (1990) showed that night-shift nurses’ scores on the General Health Questionnaire used to evaluate mental health, compared to day-shift nurses (odds ratio of 1.6) showed poorer general health.
In another study, Estryn-Béhar et al. (1989b), interviewed a representative sample of one-quarter of night-shift employees (1,496 individuals) in 39 Paris-area hospitals. Differences appear according to sex and qualification (“qualified”=head nurses and nurses; “unqualified”=nurses’ aides and orderlies). Excessive fatigue was reported by 40% of qualified women, 37% of unqualified women, 29% of qualified men and 20% of unqualified men. Fatigue on rising was reported by 42% of qualified women, 35% of unqualified women, 28% of qualified men and 24% of unqualified men. Frequent irritability was reported by one-third of night-shift workers and by a significantly greater proportion of women. Women with no children were twice as likely to report excessive fatigue, fatigue on rising and frequent irritability than were comparable men. The increase compared to single men with no children was even more marked for women with one or two children, and greater still (a four-fold increase) for women with at least three children.
Fatigue on rising was reported by 58% of night-shift hospital workers and 42% of day-shift workers in a Swedish study using a stratified sample of 310 hospital workers (Nyman and Knutsson 1995). Intense fatigue at work was reported by 15% of day-shift workers and 30% of night-shift workers. Almost one-quarter of night-shift workers reported falling asleep at work. Memory problems were reported by 20% of night-shift workers and 9% of day-shift workers.
In Japan, the health and safety association publishes the results of medical examinations of all the country’s salaried employees. This report includes the results of 600,000 employees in the health and hygiene sector. Nurses generally work rotating shifts. Complaints concerning fatigue are highest in night-shift nurses, followed in order by evening- and morning-shift nurses (Makino 1995). Symptoms reported by night-shift nurses include sleepiness, sadness and difficulty concentrating, with numerous complaints about accumulated fatigue and disturbed social life (Akinori and Hiroshi 1985).
Sleep and Affective Disorders among Physicians
The effect of work content and duration on young physicians’ private lives, and the attendant risk of depression, has been noted. Valko and Clayton (1975) found that 30% of young residents suffered a bout of depression lasting an average of five months during their first year of residency. Of the 53 residents studied, four had suicidal thoughts and three made concrete suicide plans. Similar rates of depression have been reported by Reuben (1985) and Clark et al. (1984).
In a questionnaire study, Friedman, Kornfeld and Bigger (1971) showed that interns suffering from sleep deprivation reported more sadness, selfishness and modification of their social life than did more-rested interns. During interviews following the tests, interns suffering from sleep deprivation reported symptoms such as difficulty reasoning, depression, irritability, depersonalization, inappropriate reactions and short-term memory deficits.
In a one-year longitudinal study, Ford and Wentz (1984) evaluated 27 interns four times during their internship. During this period, four interns suffered at least one major bout of depression meeting standard criteria and 11 others reported clinical depression. Anger, fatigue and mood swings increased throughout the year and were inversely correlated with the amount of sleep the preceding week.
A literature review has identified six studies in which interns having spent one sleepless night exhibited deteriorations of mood, motivation and reasoning ability and increased fatigue and anxiety (Samkoff and Jacques 1991).
Devienne et al. (1995) interviewed a stratified sample of 220 general practitioners in the Paris area. Of these, 70 were on call at night. Most of the on-call physicians reported having had their sleep disturbed while on call and finding it particularly difficult to get back to sleep after having been awakened (men: 65%; women: 88%). Waking up in the middle of the night for reasons unrelated to service calls was reported by 22% of men and 44% of women. Having or almost having a car accident due to sleepiness related to being on call was reported by 15% of men and 19% of women. This risk was greater among physicians who were on call more than four times per month (30%) than in those on call three or four times per month (22%) or one to three times per month (10%). The day after being on call, 69% of women and 46% of men reported having difficulty concentrating and feeling less effective, while 37% of men and 31% of women reported experiencing mood swings. Accumulated sleep deficits were not recovered the day following on-call work.
Family and Social Life
A survey of 848 night-shift nurses found that over the previous month one-quarter had not gone out and had entertained no guests, and half had participated in such activities only once (Gadbois 1981). One-third reported refusing an invitation because of fatigue, and two-thirds reported going out only once, with this proportion rising to 80% among mothers.
Kurumatani et al. (1994) reviewed the time sheets of 239 Japanese nurses working rotating shifts over a total of 1,016 days and found that nurses with young children slept less and spent less time on leisure activities than did nurses without young children.
Estryn-Béhar et al. (1989b) observed that women were significantly less likely than men to spend at least one hour per week participating in team or individual sports (48% of qualified women, 29% of unqualified women, 65% of qualified men and 61% of unqualified men). Women were also less likely to frequently (at least four times per month) attend shows (13% of qualified women, 6% of unqualified women, 20% of qualified men and 13% of unqualified men). On the other hand, similar proportions of women and men practised home-based activities such as watching television and reading. Multivariate analysis showed that men with no children were twice as likely to spend at least one hour per week on athletic activities than were comparable women. This gap increases with the number of children. Child care, and not gender, influences reading habits. A significant proportion of the subjects in this study were single parents. This was very rare among qualified men (1%), less rare among unqualified men (4.5%), common in qualified women (9%) and extremely frequent in unqualified women (24.5%).
In Escribà Agüir’s (1992) study of Spanish hospital workers, incompatibility of rotating shifts with social and family life was the leading source of dissatisfaction. In addition, night-shift work (either permanent or rotating) disturbed the synchronization of their schedules with those of their spouses.
Lack of free time interferes severely with the private life of interns and residents. Landau et al. (1986) found that 40% of residents reported major conjugal problems. Of these residents, 72% attributed the problems to their work. McCall (1988) noted that residents have little time to spend on their personal relationships; this problem is particularly serious for women nearing the end of their low-risk-pregnancy years.
Irregular Shift Work and Pregnancy
Axelsson, Rylander and Molin (1989) distributed a questionnaire to 807 women employed at the hospital in Mölna, Sweden. The birth weights of children born to non-smoking women working irregular shifts were significantly lower than that of children born to non-smoking women who only worked day shifts. The difference was greatest for infants of at least grade 2 (3,489 g versus 3,793 g). Similar differences were also found for infants of at least grade 2 born to women working afternoon shifts (3,073 g) and shifts alternating every 24 hours (3,481 g).
Vigilance and Quality of Work among Night-Shift Nurses
Englade, Badet and Becque (1994) performed Holter EEGs on two groups of nine nurses. It showed that the group not allowed to sleep had attention deficits characterized by sleepiness, and in some cases even sleep of which they were unaware. An experimental group practised polyphasic sleep in an attempt to recover a little sleep during work hours, while the control group was not allowed any sleep recovery.
These results are similar to those reported by a survey of 760 California nurses (Lee 1992), in which 4.0% of night-shift nurses and 4.3% of nurses working rotating shifts reported suffering frequent attention deficits; no nurses from the other shifts mentioned lack of vigilance as a problem. Occasional attention deficits were reported by 48.9% of night-shift nurses, 39.2% of rotating-shift nurses, 18.5% of day-shift nurses and 17.5% of evening-shift nurses. Struggling to stay awake while dispensing care during the month preceding the survey was reported by 19.3% of night-shift and rotating-shift nurses, compared to 3.8% of day- and evening-shift nurses. Similarly, 44% of nurses reported having had to struggle to stay awake while driving during the preceding month, compared to 19% of day-shift nurses and 25% of evening-shift nurses.
Smith et al. (1979) studied 1,228 nurses in 12 American hospitals. The incidence of occupational accidents was 23.3 for nurses working rotating shifts, 18.0 for night-shift nurses, 16.8 for day-shift nurses and 15.7 for afternoon-shift nurses.
In an attempt to better characterize problems related to attention deficits among night-shift nurses, Blanchard et al. (1992) observed activity and incidents throughout a series of night shifts. Six wards, ranging from intensive care to chronic care, were studied. In each ward, one continuous observation of a nurse was performed on the second night (of night work) and two observations on the third or fourth nights (depending on the wards’ schedule). Incidents were not associated with serious outcomes. On the second night, the number of incidents rose from 8 in the first half of the night to 18 in the second half. On the third or fourth night, the increase was from 13 to 33 in one case and from 11 to 35 in another. The authors emphasized the role of sleep breaks in limiting risks.
Gold et al. (1992) collected information from 635 Massachusetts nurses on the frequency and consequences of attention deficits. Experiencing at least one episode of sleepiness at work per week was reported by 35.5% of rotating-shift nurses with night work, 32.4% of night-shift nurses and 20.7% of morning-shift and afternoon-shift nurses working exceptionally at night. Less than 3% of nurses working the morning and afternoon shifts reported such incidents.
The odds ratio for sleepiness while driving to and from work was 3.9 for rotating-shift nurses with night work and 3.6 for night-shift nurses, compared to morning- and afternoon-shift nurses. The odds ratio for total accidents and errors over the past year (car accidents driving to and from work, errors in medication or work procedures, occupational accidents related to sleepiness) was almost 2.00 for rotating-shift nurses with night work compared to morning- and afternoon-shift nurses.
Effect of Fatigue and Sleepiness on the Performance of Physicians
Several studies have shown that the fatigue and sleeplessness induced by night-shift and on-call work leads to deteriorations of physician performance.
Wilkinson, Tyler and Varey (1975) conducted a postal questionnaire survey of 6,500 British hospital physicians. Of the 2,452 who responded, 37% reported suffering a degradation of their effectiveness due to excessively long work hours. In response to open-ended questions, 141 residents reported committing errors due to overwork and lack of sleep. In a study performed in Ontario, Canada, 70% of 1,806 hospital physicians reported often worrying about the effect of the quantity of their work had on its quality (Lewittes and Marshall 1989). More specifically, 6% of the sample—and 10% of interns—reported often worrying about fatigue affecting the quality of care they dispensed.
Given the difficulty in performing real-time evaluations of clinical performance, several studies on the effects of sleep deprivation on physicians have relied upon neuropsychological tests.
In the majority of studies reviewed by Samkoff and Jacques (1991), residents deprived of sleep for one night exhibited little deterioration in their performance of rapid tests of manual dexterity, reaction time and memory. Fourteen of these studies used extensive test batteries. According to five tests, the effect on performance was ambiguous; according to six, a performance deficit was observed; but according to eight other tests, no deficit was observed.
Rubin et al. (1991) tested 63 medical-ward residents before and after an on-call period of 36 hours and a subsequent full day of work, using a battery of self-administered computerized behavioural tests. Physicians tested after being on call exhibited significant performance deficits in tests of visual attention, coding speed and accuracy and short-term memory. The duration of sleep enjoyed by the residents while on call was as follows: two hours at most in 27 subjects, four hours at most in 29 subjects, six hours at most in four subjects and seven hours in three subjects. Lurie et al. (1989) reported similarly brief sleep durations.
Virtually no difference has been observed in the performance of actual or simulated short-duration clinical tasks—including filling out a laboratory requisition (Poulton et al. 1978; Reznick and Folse 1987), simulated suturing (Reznick and Folse 1987), endotracheal intubation (Storer et al. 1989) and venous and arterial catheterization (Storer et al. 1989)—by sleep-deprived and control groups. The only difference observed was a slight lengthening of the time required by sleep-deprived residents to perform arterial catheterization.
On the other hand, several studies have demonstrated significant differences for tasks requiring continuous vigilance or intense concentration. For example, sleep-deprived interns committed twice as many errors when reading 20-minute ECGs as did rested interns (Friedman et al. 1971). Two studies, one relying on 50-minute VDU-based simulations (Beatty, Ahern and Katz 1977), the other on 30-minute video simulations (Denisco, Drummond and Gravenstein 1987), have reported poorer performance by anaesthesiologists deprived of sleep for one night. Another study has reported significantly poorer performance by sleep-deprived residents on a four-hour test exam (Jacques, Lynch and Samkoff 1990). Goldman, McDonough and Rosemond (1972) used closed-circuit filming to study 33 surgical procedures. Surgeons with less than two hours of sleep were reported to perform “worse” than more-rested surgeons. The duration of surgical inefficiency or indecision (i.e., of poorly planned manoeuvres) was over 30% of the total duration of the operation.
Bertram (1988) examined the charts of emergency admissions by second-year residents over a one-month period. For a given diagnosis, less information on medical histories and the results of clinical examinations was gathered as the number of hours worked and patients seen increased.
Smith-Coggins et al. (1994) analysed the EEG, mood, cognitive performance and motor performance of six emergency-ward physicians over two 24-hour periods, one with diurnal work and nocturnal sleep, the other with nocturnal work and diurnal sleep.
Physicians working at night slept significantly less (328.5 versus 496.6 minutes) and performed significantly less well. This poorer motor performance was reflected in the increased time required to perform a simulated intubation (42.2 versus 31.56 seconds) and an increased number of protocol errors.
Their cognitive performance was evaluated at five test periods throughout their shift. For each test, physicians were required to review four charts drawn from a pool of 40, rank them and list the initial procedures, the treatments and the appropriate laboratory tests. Performance deteriorated as the shift progressed for both night-shift and day-shift physicians. Night-shift physicians were less successful at providing correct responses than day-shift physicians.
Physicians working during the day rated themselves as less sleepy, more satisfied and more lucid than did night-shift physicians.
Recommendations in English-speaking countries concerning the work schedules of physicians-in-training have tended to take these results into account and now call for work-weeks of at most 70 hours and the provision of recovery periods following on-call work. In the US, following the death of a patient attributed to errors by an overworked, poorly supervised resident physician which received much media attention, New York State enacted legislation limiting work hours for hospital staff physicians and defining the role of attending physicians in supervising their activities.
Content of Night Work in Hospitals
Night work has long been undervalued. In France, nurses used to be seen as guardians, a term rooted in a vision of nurses’ work as the mere monitoring of sleeping patients, with no delivery of care. The inaccuracy of this vision became increasingly obvious as the length of hospitalization decreased and patients’ uncertainty about their hospitalization increased. Hospital stays require frequent technical interventions during the night, precisely when the nurse:patient ratio is lowest.
The importance of the amount of time spent by nurses in patients’ rooms is demonstrated by the results of a study based on continuous observation of the ergonomics of nurses’ work in each of three shifts in ten wards (Estryn-Béhar and Bonnet 1992). The time spent in rooms accounted for an average of 27% of the day and night shifts and 30% of the afternoon shift. In four of the ten wards, nurses spent more time in the rooms during the night than during the day. Blood samples were of course taken less frequently during the night, but other technical interventions such as monitoring vital signs and medication, and administering, adjusting and monitoring intravenous drips and transfusions were more frequent during the night in six of seven wards where detailed analysis was performed. The total number of technical and non-technical direct-care interventions was higher during the night in six of seven wards.
Nurses’ work postures varied from shift to shift. The percentage of time spent seated (preparation, writing, consultations, time spent with patients, breaks) was higher at night in seven of ten wards, and exceeded 40% of shift time in six wards. However, the time spent in painful postures (bent over, crouched, arms extended, carrying loads) exceeded 10% of shift time in all wards and 20% of shift time in six wards at night; in five wards the percentage of time spent in painful positions was higher at night. In fact, night-shift nurses also make beds and perform tasks related to hygiene, comfort and voiding, tasks which are all normally performed by nurses’ aides during the day.
Night-shift nurses may be obliged to change location very frequently. Night-shift nurses in all the wards changed location over 100 times per shift; in six wards, the number of changes of location was higher at night. However, because rounds were scheduled at 00:00, 02:00, 04:00 and 06:00, nurses did not travel greater distances, except in juvenile intensive-care wards. Nonetheless, nurses walked over six kilometres in three of the seven wards where podometry was performed.
Conversations with patients were frequent at night, exceeding 30 per shift in all wards; in five wards these conversations were more frequent at night. Conversations with physicians were much rarer and almost always brief.
Leslie et al. (1990) conducted continuous observation of 12 of 16 interns in the medical ward of a 340-bed Edinburgh (Scotland) hospital over 15 consecutive winter days. Each ward cared for approximately 60 patients. In all, 22 day shifts (08:00 to 18:00) and 18 on-call shifts (18:00 to 08:00), equivalent to 472 hours of work, were observed. The nominal duration of the interns’ work week was 83 to 101 hours, depending on whether or not they were on call during the weekends. However, in addition to the official work schedule, each intern also spent an average of 7.3 hours each week on miscellaneous hospital activities. Information on the time spent performing each of 17 activities, on a minute-by-minute basis, was collected by trained observers assigned to each intern.
The longest continuous work period observed was 58 hours (08:00 Saturday to 06:00 Monday) and the longest work period was 60.5 hours. Calculations showed that a one-week sickness leave of one intern would require the other two interns in the ward to increase their workload by 20 hours.
In practice, in wards admitting patients during on-call shifts, interns working consecutive day, on-call and night shifts worked all but 4.6 of the 34 elapsed hours. These 4.6 hours were devoted to meals and rest, but interns remained on call and available during this time. In wards that did not admit new patients during on-call shifts, interns’ workload abated only after midnight.
Due to the on-call schedules in other wards, interns spent approximately 25 minutes outside their home ward each shift. On average, they walked 3 kilometres and spent 85 minutes (32 to 171 minutes) in other wards each night shift.
Time spent filling out requests for examinations and charts, in addition, is often performed outside of their normal work hours. Non-systematic observation of this additional work over several days revealed that it accounts for approximately 40 minutes of additional work at the end of each shift (18:00).
During the day, 51 to 71% of interns’ time was spent on patient-oriented duties, compared to 20 to 50% at night. Another study, conducted in the United States, reported that 15 to 26% of work time was spent on patient-oriented duties (Lurie et al. 1989).
The study concluded that more interns were needed and that interns should no longer be required to attend other wards while on call. Three additional interns were hired. This reduced interns’ work week to an average of 72 hours, with no work, excepting on-call shifts, after 18:00. Interns also obtained a free half-day following an on-call shift and preceding a weekend when they were to be on call. Two secretaries were hired on a trial basis by two wards. Working 10 hours per week, the secretaries were able to fill out 700 to 750 documents per ward. In the opinion of both senior physicians and nurses, this resulted in more efficient rounds, since all the information had been entered correctly.
Strain in Health Care Work
Cognitive Strain
Continuous observation has revealed that nurses’ workdays are characterized by continual reorganization of their work schedules and frequent interruptions.
Belgian (Malchaire 1992) and French (Gadbois et al. 1992; Estryn-Béhar and Fouillot 1990b) studies have revealed that nurses perform 120 to 323 separate tasks during their workday (see table 1). Work interruptions are very frequent throughout the day, ranging from 28 to 78 per workday. Many of the units studied were large, short-term-stay units in which the nurses’ work consisted of a long series of spatially dispersed, short-duration tasks. Planning of work schedules was complicated by the presence of incessant technical innovation, close interdependence of the work of the various staff members and a generally haphazard approach to work organization.
Table 1. Number of separate tasks undertaken by nurses, and interruptions during each shift
|
Belgium |
France |
France |
|
|
Authors |
Malchaire 1992* |
Gadbois et al. 1992** |
Estryn-Béhar and |
|
Departments |
Cardiovascular |
Surgery (S) and |
Ten medical and |
|
Number of separate |
Morning 120/8 h |
S (day) 276/12 h |
Morning 323/8 h |
|
Number of |
S (day) 36/12 h |
Morning 78/8 h |
Number of hours of observation: * Morning: 80 h; afternoon: 80 h; night: 110 h. ** Surgery: 238 h; medicine: 220 h. *** Morning : 64 h; afternoon: 80 h; night: 90 h.
Gadbois et al. (1992) observed an average of 40 interruptions per workday, of which 5% were caused by patients, 40% by inadequate transmission of information, 15% by telephone calls and 25% by equipment. Ollagnier and Lamarche (1993) systematically observed nurses in a Swiss hospital and observed 8 to 32 interruptions per day, depending on the ward. On average, these interruptions represented 7.8% of the workday.
Work interruptions such as these, caused by inappropriate information supply and transmission structures, prevent workers from completing all their tasks and lead to worker dissatisfaction. The most serious consequence of this organizational deficiency is the reduction of time spent with patients (see table 2). In the first three studies cited above, nurses spent at most 30% of their time with patients on average. In Czechoslovakia, where multiple-bed rooms were common, nurses needed to change rooms less frequently, and spent 47% of their shift time with patients (Hubacova, Borsky and Strelka 1992). This clearly demonstrates how architecture, staffing levels and mental strain are all interrelated.
Table 2. Distribution of nurses’ time in three studies
|
Czechoslovakia |
Belgium |
France |
|
|
Authors |
Hubacova, Borsky and Strelka 1992* |
Malchaire 1992** |
Estryn-Béhar and |
|
Departments |
5 medical and surgical departments |
Cardiovascular surgery |
10 medical and |
|
Average time for the main postures and total distance walked by nurses: |
|||
|
Per cent working |
76% |
Morning 61% |
Morning 74% |
|
Including stooping, |
11% |
Morning 16% |
|
|
Standing flexed |
Morning 11% |
||
|
Distance walked |
Morning 4 km |
Morning 7 km |
|
|
Per cent working |
Three shifts: 47% |
Morning 38% |
Morning 24% |
Number of observations per shift: * 74 observations on 3 shifts. ** Morning: 10 observations (8 h); afternoon: 10 observations (8 h); night: 10 observations (11 h). *** Morning: 8 observations (8 h); afternoon: 10 observations (8 h); night: 9 observations (10-12 h).
Estryn-Béhar et al. (1994) observed seven occupations and schedules in two specialized medical wards with similar spatial organization and located in the same high-rise building. While work in one ward was highly sectorized, with two teams of a nurse and a nurses’ aide attending half of the patients, there were no sectors in the other ward, and basic care for all patients was dispensed by two nurses’ aides. There were no differences in the frequency of patient-related interruptions in the two wards, but team-related interruptions were clearly more frequent in the ward without sectors (35 to 55 interruptions compared to 23 to 36 interruptions). Nurses’ aides, morning-shift nurses and afternoon-shift nurses in the non-sectorized ward suffered 50, 70 and 30% more interruptions than did their colleagues in the sectorized one.
Sectorization thus appears to reduce the number of interruptions and the fracturing of work shifts. These results were used to plan the reorganization of the ward, in collaboration with the medical and paramedical staff, so as to facilitate sectorization of the office and the preparation area. The new office space is modular and easily divided into three offices (one for physicians and one for each of the two nursing teams), each separated by sliding glass partitions and furnished with at least six seats. Installation of two counters facing each other in the common preparation area means that nurses who are interrupted during preparation can return and find their materials in the same position and state, unaffected by their colleagues’ activities.
Reorganization of work schedules and technical services
Professional activity in technical departments is much more than the mere sum of tasks associated with each test. A study conducted in several nuclear medicine departments (Favrot-Laurens 1992) revealed that nuclear medicine technicians spend very little of their time performing technical tasks. In fact, a significant part of technicians’ time was spent coordinating activity and workload at the various workstations, transmitting information and making unavoidable adjustments. These responsibilities stem from technicians’ obligation to be knowledgeable about each test and to possess essential technical and administrative information in addition to test-specific information such as time and injection site.
Information processing necessary for the delivery of care
Roquelaure, Pottier and Pottier (1992) were asked by a manufacturer of electroencephalography (EEG) equipment to simplify the use of the equipment. They responded by facilitating the reading of visual information on controls which were excessively complicated or simply unclear. As they point out, “third-generation” machines present unique difficulties, due in part to the use of visual display units packed with barely legible information. Deciphering these screens requires complex work strategies.
On the whole, however, little attention has been paid to the need to present information in a manner that facilitates rapid decision-making in health care departments. For example, the legibility of information on medicine labels still leaves much to be desired, according to one study of 240 dry oral and 364 injectable medications (Ott et al. 1991). Ideally, labels for dry oral medication administered by nurses, who are frequently interrupted and attend several patients, should have a matte surface, characters at least 2.5 mm high and comprehensive information on the medication in question. Only 36% of the 240 medications examined satisfied the first two criteria, and only 6% all three. Similarly, print smaller than 2.5 mm was used in 63% of labels on the 364 injectable medications.
In many countries where English is not spoken, machine control panels are still labelled in English. Patient-chart software is being developed in many countries. In France, this type of software development is often motivated by a desire to improve hospital management and undertaken without adequate study of the software’s compatibility with actual working procedures (Estryn-Béhar 1991). As a result, the software may actually increase the complexity of nursing, rather than reduce cognitive strain. Requiring nurses to page through multiple screens of information to obtain the information they need to fill a prescription may increase the number of errors they make and memory lapses they suffer.
While Scandinavian and North American countries have computerized much of their patient records, it must be borne in mind that hospitals in these countries benefit from a high staff-to-patient ratio, and work interruptions and constant reshuffling of priorities are therefore less problematic there. In contrast, patient-chart software designed for use in countries with lower staff-to-patient ratios must be able to easily produce summaries and facilitate reorganization of priorities.
Human error in anaesthesia
Cooper, Newbower and Kitz (1984), in their study of the factors underlying errors during anaesthesia in the United States, found equipment design to be crucial. The 538 errors studied, largely drug administration and equipment problems, were related to the distribution of activities and the systems involved. According to Cooper, better design of equipment and monitoring apparatus would lead to a 22% reduction in errors, while complementary training of anaesthesiologists, using new technologies such as anaesthesia simulators, would lead to a 25% reduction. Other recommended strategies focus on work organization, supervision and communications.
Acoustic alarms in operating theatres and intensive-care units
Several studies have shown that too many types of alarms are used in operating theatres and intensive-care units. In one study, anaesthetists identified only 33% of alarms correctly, and only two monitors had recognition rates exceeding 50% (Finley and Cohen 1991). In another study, anaesthetists and anaesthesia nurses correctly identified alarms in only 34% of cases (Loeb et al. 1990). Retrospective analysis showed that 26% of nurses’ errors were due to similarities in alarm sounds and 20% to similarities in alarm functions. Momtahan and Tansley (1989) reported that recovery-room nurses and anaesthetists correctly identified alarms in only 35% and 22% of cases respectively. In another study by Momtahan, Hétu and Tansley (1993), 18 physicians and technicians were able to identify only 10 to 15 of 26 operating-theatre alarms, while 15 intensive-care nurses were able to identify only 8 to 14 of 23 alarms used in their unit.
De Chambost (1994) studied the acoustic alarms of 22 types of machines used in an intensive-care unit in the Paris region. Only the cardiogram alarms and those of one of the two types of automated-plunger syringes were readily identified. The others were not immediately recognized and required personnel first to investigate the source of the alarm in the patient’s room and then return with the appropriate equipment. Spectral analysis of the sound emitted by eight machines revealed significant similarities and suggests the existence of a masking effect between alarms.
The unacceptably high number of unjustifiable alarms has been the object of particular criticism. O’Carroll (1986) characterized the origin and frequency of alarms in a general intensive-care unit over three weeks. Only eight of 1,455 alarms were related to a potentially fatal situation. There were many false alarms from monitors and perfusion pumps. There was little difference between the frequency of alarms during the day and night.
Similar results have been reported for alarms used in anaesthesiology. Kestin, Miller and Lockhart (1988), in a study of 50 patients and five commonly used anaesthesia monitors, reported that only 3% indicated a real risk for the patient and that 75% of alarms were unfounded (caused by patient movement, interference and mechanical problems). On average, ten alarms were triggered per patient, equivalent to one alarm every 4.5 minutes.
A common response to false alarms is simply to disable them. McIntyre (1985) reported that 57% of Canadian anaesthetists admitted deliberately inactivating an alarm. Obviously, this could lead to serious accidents.
These studies underscore the poor design of hospital alarms and the need for alarm standardization based on cognitive ergonomics. Both Kestin, Miller and Lockhart (1988) and Kerr (1985) have proposed alarm modifications that take into account risk and the expected corrective responses of hospital personnel. As de Keyser and Nyssen (1993) have shown, the prevention of human error in anaesthesia integrates different measures—technological, ergonomic, social, organizational and training.
Technology, human error, patient safety and perceived psychological strain
Rigorous analysis of the error process is very useful. Sundström-Frisk and Hellström (1995) reported that equipment deficiencies and/or human error were responsible for 57 deaths and 284 injuries in Sweden between 1977 and 1986. The authors interviewed 63 intensive-care-unit teams involved in 155 incidents (“near-accidents”) involving advanced medical equipment; most of these incidents had not been reported to authorities. Seventy typical “near-accident” scenarios were developed. Causal factors identified included inadequate technical equipment and documentation, the physical environment, procedures, staffing levels and stress. The introduction of new equipment may lead to accidents if the equipment is poorly adapted to users’ needs and is introduced in the absence of basic changes in training and work organization.
In order to cope with forgetfulness, nurses develop several strategies for remembering, anticipating and avoiding incidents. They do still occur and even when patients are unaware of errors, near-accidents cause personnel to feel guilty. The article "Case Study: Human Error and Critical Taks" deals with some aspects of the problem.
Emotional or Affective Strain
Nursing work, especially if it forces nurses to confront serious illness and death, can be a significant source of affective strain, and may lead to burn-out, which is discussed more fully elsewhere in this Encyclopaedia. Nurses’ ability to cope with this stress depends on the extent of their support network and their possibility to discuss and improve patients’ quality of life. The following section summarizes the principal findings of Leppanen and Olkinuora’s (1987) review of Finnish and Swedish studies on stress.
In Sweden, the main motivations reported by health professionals for entering their profession were the “moral calling” of the work, its usefulness and the opportunity to exercise competence. However, almost half of nurses’ aides rated their knowledge as inadequate for their work, and one-quarter of nurses, one-fifth of registered nurses, one-seventh of physicians and one-tenth of head nurses considered themselves incompetent at managing some types of patients. Incompetence in managing psychological problems was the most commonly cited problem and was particularly prevalent among nurses’ aides, although also cited by nurses and head nurses. Physicians, on the other hand, consider themselves competent in this area. The authors focus on the difficult situation of nurses’ aides, who spend more time with patients than the others but are, paradoxically, unable to inform patients about their illness or treatment.
Several studies reveal the lack of clarity in delineating responsibilities. Pöyhönen and Jokinen (1980) reported that only 20% of Helsinki nurses were always informed of their tasks and the goals of their work. In a study conducted in a paediatric ward and an institute for disabled persons, Leppanen showed that the distribution of tasks did not allow nurses enough time to plan and prepare their work, perform office work and collaborate with team members.
Responsibility in the absence of decision-making power appears to be a stress factor. Thus, 57% of operating-room nurses felt that ambiguities concerning their responsibilities aggravated their cognitive strain; 47% of surgical nurses reported being unfamiliar with some of their tasks and felt that patients’ and nurses’ conflicting expectations were a source of stress. Further, 47% reported increased stress when problems occurred and physicians were not present.
According to three European epidemiological studies, burn-out affects approximately 25% of nurses (Landau 1992; Saint-Arnaud et al. 1992; Estryn-Béhar et al. 1990) (see table 3 ). Estryn-Béhar et al. studied 1,505 female health care workers, using a cognitive strain index that integrates information on work interruptions and reorganization and an affective strain index that integrates information on work ambience, teamwork, congruity of qualification and work, time spent talking to patients and the frequency of hesitant or uncertain responses to patients. Burn-out was observed in 12% of nurses with low, 25% of those with moderate and 39% of those with high cognitive strain. The relationship between burn-out and affective strain increases was even stronger: burn-out was observed in 16% of nurses with low, 25% of those with moderate and 64% of those with high affective strain. After adjustment by logistic multivariate regression analysis for social and demographic factors, women with a high affective strain index had an odds ratio for burn-out of 6.88 compared to those with a low index.
Table 3. Cognitive and affective strain and burn-out among health workers
|
Germany* |
Canada** |
France*** |
|
|
Number of subjects |
24 |
868 |
1,505 |
|
Method |
Maslach Burn-out |
Ilfeld Psychiatric |
Goldberg General |
|
High emotional |
33% |
20% |
26% |
|
Degree of burn-out, |
Morning 2.0; |
Morning 25%; |
|
|
Percentage suffering |
Cognitive and |
Cognitive strain: |
* Landau 1992. ** Saint Arnand et. al. 1992. *** Estryn-Béhar et al. 1990.
Saint-Arnaud et al. reported a correlation between the frequency of burn-out and the score on their composite cognitive and affective strain index. Landau’s results support these findings.
Finally, 25% of 520 nurses working in a cancer treatment centre and a general hospital in France were reported to exhibit high burn-out scores (Rodary and Gauvain-Piquard 1993). High scores were most closely associated with a lack of support. Feelings that their department did not regard them highly, take their knowledge of the patients into account or put the highest value on their patients’ quality of life were reported more frequently by nurses with high scores. Reports of being physically afraid of their patients and unable to organize their work schedule as they wished were also more frequent among these nurses. In light of these results, it is interesting to note that Katz (1983) observed a high suicide rate among nurses.
Impact of workload, autonomy and support networks
A study of 900 Canadian nurses revealed an association between workload and five indices of cognitive strain measured by the Ilfeld questionnaire: the global score, aggression, anxiety, cognitive problems and depression (Boulard 1993). Four groups were identified. Nurses with a high workload, high autonomy and good social support (11.76%) exhibited several stress-related symptoms. Nurses with a low workload, high autonomy and good social support (35.75%) exhibited the lowest stress. Nurses with high workload, little autonomy and little social support (42.09%) had a high prevalence of stress-related symptoms, while nurses with a low workload, little autonomy and little social support (10.40%) had low stress, but the authors suggest that these nurses may experience some frustration.
These results also demonstrate that autonomy and support, rather than moderating the relationship between workload and mental health, act directly on workload.
Role of head nurses
Classically, employee satisfaction with supervision has been considered to depend on the clear definition of responsibilities and on good communication and feedback. Kivimäki and Lindström (1995) administered a questionnaire to nurses in 12 wards of four medical departments and interviewed the wards’ head nurses. Wards were classified into two groups on the basis of the reported level of satisfaction with supervision (six satisfied wards and six dissatisfied wards). Scores for communication, feedback, participation in decision-making and the presence of a work climate that favours innovation were higher in “satisfied” wards. With one exception, head nurses of “satisfied” wards reported conducting at least one confidential conversation lasting one to two hours with each employee annually. In contrast, only one of the head nurses of the “dissatisfied” wards reported this behaviour.
Head nurses of the “satisfied” wards reported encouraging team members to express their opinions and ideas, discouraging team members from censuring or ridiculing nurses who made suggestions, and consistently attempting to give positive feedback to nurses expressing different or new opinions. Finally, all the head nurses in “satisfied” wards, but none of the ones in “dissatisfied” ones, emphasized their own role in creating a climate favourable to constructive criticism.
Psychological roles, relationships and organization
The structure of nurses’ affective relationships varies from team to team. A study of 1,387 nurses working regular night shifts and 1,252 nurses working regular morning or afternoon shifts revealed that shifts were extended more frequently during night shifts (Estryn-Béhar et al. 1989a). Early shift starts and late shift ends were more prevalent among night-shift nurses. Reports of a “good” or “very good” work ambience were more prevalent at night, but a “good relationship with physicians” was less prevalent. Finally, night-shift nurses reported having more time to talk to patients, although that meant that worries and uncertainties about the appropriate response to give patients, also more frequent at night, were harder to bear.
Büssing (1993) revealed that depersonalization was greater for nurses working abnormal hours.
Stress in physicians
Denial and suppression of stress are common defence mechanisms. Physicians may attempt to repress their problems by working harder, distancing themselves from their emotions or adopting the role of a martyr (Rhoads 1977; Gardner and Hall 1981; Vaillant, Sorbowale and McArthur 1972). As these barriers become more fragile and adaptive strategies break down, bouts of anguish and frustration become more and more frequent.
Valko and Clayton (1975) found that one-third of interns suffered severe and frequent episodes of emotional distress or depression, and that one-quarter of them entertained suicidal thoughts. McCue (1982) believed that a better understanding of both stress and reactions to stress would facilitate physician training and personal development and modify societal expectations. The net effect of these changes would be an improvement in care.
Avoidance behaviours may develop, often accompanied by a deterioration of interpersonal and professional relationships. At some point, the physician finally crosses the line into a frank deterioration of mental health, with symptoms which may include substance abuse, mental illness or suicide. In yet other cases, patient care may be compromised, resulting in inappropriate examinations and treatment, sexual abuse or pathological behaviour (Shapiro, Pinsker and Shale 1975).
A study of 530 physician suicides identified by the American Medical Association over a five-year period found that 40% of suicides by female physicians and less than 20% of suicides by male physicians occurred in individuals younger than 40 years (Steppacher and Mausner 1974). A Swedish study of suicide rates from 1976 to 1979 found the highest rates among some of the health professions, compared to the overall active population (Toomingas 1993). The standardized mortality ratio (SMR) for female physicians was 3.41, the highest value observed, while that for nurses was 2.13.
Unfortunately, health professionals with impaired mental health are often ignored and may even be rejected by their colleagues, who attempt to deny these tendencies in themselves (Bissel and Jones 1975). In fact, slight or moderate stress is much more prevalent among health professionals than are frank psychiatric disorders (McCue 1982). A good prognosis in these cases depends on early diagnosis and peer support (Bitker 1976).
Discussion groups
Studies on the effect of discussion groups on burn-out have been undertaken in the United States. Although positive results have been demonstrated (Jacobson and MacGrath 1983), it should be noted that these have been in institutions where there was sufficient time for regular discussions in quiet and appropriate settings (i.e., hospitals with high staff-patient ratios).
A literature review of the success of discussion groups has shown these groups to be valuable tools in wards where a high proportion of patients are left with permanent sequelae and must learn to accept modifications in their lifestyle (Estryn-Béhar 1990).
Kempe, Sauter and Lindner (1992) evaluated the merits of two support techniques for nurses near burn-out in geriatrics wards: a six-month course of 13 professional counselling sessions and a 12-month course of 35 “Balint group” sessions. The clarification and reassurance provided by the Balint group sessions were effective only if there was also significant institutional change. In the absence of such change, conflicts may even intensify and dissatisfaction increase. Despite their impending burn-out, these nurses remained very professional and sought ways of carrying on with their work. These compensatory strategies had to take into account extremely high workloads: 30% of nurses worked more than 20 hours of overtime per month, 42% had to cope with understaffing during more than two-thirds of their working hours and 83% were often left alone with unqualified personnel.
The experience of these geriatrics nurses was compared to that of nurses in oncology wards. Burnout score was high in young oncology nurses, and decreased with seniority. In contrast, burnout score among geriatrics nurses increased with seniority, attaining levels much higher than those observed in oncology nurses. This lack of decrease with seniority is due to the characteristics of the workload in geriatrics wards.
The need to act on multiple determinants
Some authors have extended their study of effective stress management to organizational factors related to affective strain.
For example, analysis of psychological and sociological factors was part of Theorell’s attempt to implement case-specific improvements in emergency, paediatric and juvenile psychiatry wards (Theorell 1993). Affective strain before and after the implementation of changes was measured through the use of questionnaires and the measurement of plasma prolactin levels, shown to mirror feelings of powerlessness in crisis situations.
Emergency-ward personnel experienced high levels of affective strain and frequently enjoyed little decisional latitude. This was attributed to their frequent confrontation with life-and-death situations, the intense concentration demanded by their work, the high number of patients they frequently attended and the impossibility of controlling the type and number of patients. On the other hand, because their contact with patients was usually short and superficial, they were exposed to less suffering.
The situation was more amenable to control in paediatric and juvenile psychiatry wards, where schedules for diagnostic procedures and therapeutic procedures were established in advance. This was reflected by a lower risk of overwork compared to emergency wards. However, personnel in these wards were confronted with children suffering from serious physical and mental disease.
Desirable organizational changes were identified through discussion groups in each ward. In emergency wards, personnel were very interested in organizational changes and recommendations concerning training and routine procedures—such as how to treat rape victims and elderly patients with no relations, how to evaluate work and what to do if a called physician doesn’t arrive—were formulated. This was followed by the implementation of concrete changes, including the creation of the position of head physician and the ensuring of the constant availability of an internist.
The personnel in juvenile psychiatry were primarily interested in personal growth. Reorganization of resources by the head physician and the county allowed one-third of the personnel to undergo psychotherapy.
In paediatrics, meetings were organized for all the personnel every 15 days. After six months, social support networks, decisional latitude and work content all had improved.
The factors identified by these detailed ergonomic, psychological and epidemiological studies are valuable indices of work organization. Studies which focus on them are quite different from in-depth studies of multi-factor interactions and instead revolve around the pragmatic characterization of specific factors.
Tintori and Estryn-Béhar (1994) identified some of these factors in 57 wards of a large hospital in the Paris region in 1993. Shift overlap of more than 10 minutes was present in 46 wards, although there was no official overlap between the night and morning shifts in 41 wards. In half the cases, these information communication sessions included nurses’ aides in all three shifts. In 12 wards, physicians participated in the morning-afternoon sessions. In the three months preceding the study, only 35 wards had held meetings to discuss patients’ prognoses, discharges and patients’ understanding of and reaction to their illnesses. In the year preceding the study, day-shift workers in 18 wards had received no training and only 16 wards had dispensed training to their night-shift workers.
Some new lounges were not used, since they were 50 to 85 metres from some of the patients’ rooms. Instead, the personnel preferred holding their informal discussions around a cup of coffee in a smaller but closer room. Physicians participated in coffee breaks in 45 day-shift wards. Nurses’ complaints of frequent work interruptions and feelings of being overwhelmed by their work are no doubt attributable in part to the dearth of seats (less than four in 42 of the 57 wards) and cramped quarters of the nursing stations, where more than nine people must spend a good part of their day.
The interaction of stress, work organization and support networks is clear in studies of the home-care unit of the hospital in Motala, Sweden (Beck-Friis, Strang and Sjöden 1991; Hasselhorn and Seidler 1993). The risk of burn-out, generally considered high in palliative care units, was not significant in these studies, which in fact revealed more occupational satisfaction than occupational stress. Turnover and work stoppages in these units were low, and personnel had a positive self-image. This was attributed to selection criteria for personnel, good teamwork, positive feedback and continuing education. Personnel and equipment costs for terminal-stage cancer hospital care are typically 167 to 350% higher than for hospital-based home care. There were more than 20 units of this type in Sweden in 1993.
Hospital Ergonomics: A Review
Author: Madeleine R. Estryn-Béhar
Ergonomics is an applied science that deals with the adaptation of work and the workplace to the characteristics and capabilities of the worker so that he or she may perform the duties of the job effectively and safely. It addresses the worker’s physical capacities in relation to the physical requirements of the job (e.g., strength, endurance, dexterity, flexibility, ability to tolerate positions and postures, visual and auditory acuity) as well as his or her mental and emotional status in relation to the way the work is organized (e.g., work schedules, workload and work-related stress). Ideally, adaptations are made to the furniture, equipment and tools used by the worker and to the work environment to enable the worker to perform adequately without risk to himself/herself, co-workers and the public. Occasionally, it is necessary to improve the worker’s adaptation to the job through, for example, special training and the use of personal protective equipment.
Since the mid 1970s, the application of ergonomics to hospital workers has broadened. It is directed now at those involved in direct patient care (e.g., physicians and nurses), those involved in ancillary services (e.g., technicians, laboratory staff, pharmacists and social workers) and those providing support services (e.g., administrative and clerical personnel, food service staff, housekeeping staff, maintenance workers and security staff).
Extensive research has been conducted into the ergonomics of hospitalization, with most studies attempting to identify the extent to which hospital administrators should allow hospital personnel latitude in developing strategies to reconcile an acceptable workload with good quality of care. Participatory ergonomics has become increasingly widespread in hospitals in recent years. More specifically, wards have been reorganized on the basis of ergonomic analyses of activity undertaken in collaboration with medical and paramedical personnel, and participatory ergonomics has been used as the basis for the adaptation of equipment for use in health care.
In studies of hospital ergonomics, workstation analysis must extend at least to the departmental level—the distance between rooms and the amount and location of equipment are all crucial considerations.
Physical strain is one of the primary determinants of the health of HCWs and the quality of care that they dispense. This being said, the frequent interruptions that hinder care-giving and the effect of psychological factors associated with confrontations with serious illness, ageing and death must also be addressed. Accounting for all these factors is a difficult task, but approaches focusing only on single factors will fail to improve either working conditions or the quality of care. Similarly, patients’ perception of the quality of their hospital stay is determined by the effectiveness of the care they receive, their relationship with physicians and other personnel, the food and the architectural environment.
Basic to hospital ergonomics is study of the sum and interaction of personal factors (e.g., fatigue, fitness, age and training) and circumstantial factors (e.g., work organization, schedule, floor layout, furniture, equipment, communication and psychological support within the work team), which combine to affect the performance of work. Precise identification of the actual work performed by health care workers depends on ergonomic observation of entire workdays and collection of valid and objective information on the movements, postures, cognitive performance and emotional control called upon to satisfy work requirements. This helps to detect factors that may interfere with effective, safe, comfortable and healthy work. This approach also sheds light on the potential for workers’ suffering or taking pleasure in their work. Final recommendations must take the interdependence of the various professional and ancillary personnel attending the same patient into account.
These considerations lay the groundwork for further, specific research. Analysis of strain related to the use of basic equipment (e.g., beds, meal carts and mobile x-ray equipment) may help clarify the conditions of acceptable use. Measurements of lighting levels may be complemented by information on the size and contrast of medication labels, for example. Where alarms emitted by different intensive-care-unit equipment can be confused, analysis of their acoustic spectrum may prove useful. Computerization of patient charts should not be undertaken unless the formal and informal information-support structures have been analysed. The interdependence of the various elements of the work environment of any given caregiver should therefore always be borne in mind when analysing isolated factors.
Analysis of the interaction of different factors influencing care—physical strain, cognitive strain, affective strain, scheduling, ambience, architecture and hygiene protocols—is essential. It is important to adapt schedules and common work areas to the needs of the work team when attempting to improve overall patient management. Participatory ergonomics is a way of using specific information to bring about wide-ranging and relevant improvements to the quality of care and to working life. Involving all categories of personnel in key stages of the search for solution helps ensure that the modifications finally adopted will have their full support.
Working Postures
Epidemiological studies of joint and musculoskeletal disorders. Several epidemiological studies have indicated that inappropriate postures and handling techniques are associated with a doubling of the number of back, joint and muscle problems requiring treatment and time off the job. This phenomenon, discussed in greater detail elsewhere in this chapter and Encyclopaedia, is related to physical and cognitive strain.
Working conditions differ from country to country. Siegel et al. (1993) compared conditions in Germany and Norway and found that 51% of German nurses, but only 24% of Norwegian nurses, suffered lower-back pain on any given day. Working conditions in the two countries differed; however, in German hospitals, the patient-nurse ratio was twice as high and the number of adjustable-height beds half that in Norwegian hospitals, and fewer nurses had patient handling equipment (78% versus 87% in Norwegian hospitals).
Epidemiological studies of pregnancy and its outcome. Because the hospital workforce is usually predominantly female, the influence of work on pregnancy often becomes an important issue (see articles on pregnancy and work elsewhere in this Encyclopaedia). Saurel-Cubizolles et al. (1985) in France, for example, studied 621 women who returned to hospital work after giving birth and found that a higher rate of premature births were associated with heavy housekeeping chores (e.g., cleaning windows and floors), carrying heavy loads and long periods of standing. When these tasks were combined, the rate of premature births was increased: 6% when only one of these factors was involved and up to 21% when two or three were involved. These differences remained significant after adjustment for seniority, social and demographic characteristics and professional level. These factors were also associated with a higher frequency of contractions, more hospital admissions during pregnancy and, on average, longer sick leave.
In Sri Lanka, Senevirane and Fernando (1994) compared 130 pregnancies borne by 100 nursing officers and 126 by clerical workers whose jobs presumably were more sedentary; socio-economic backgrounds and use of prenatal care were similar for both groups. Odds-ratios for complications of pregnancy (2.18) and preterm delivery (5.64) were high among nursing officers.
Ergonomic Observation of Workdays
The effect of physical strain on health care workers has been demonstrated through continuous observation of workdays. Research in Belgium (Malchaire 1992), France (Estryn-Béhar and Fouillot 1990a) and Czechoslovakia (Hubacova, Borsky and Strelka 1992) has shown that health care workers spend 60 to 80% of their workday standing (see table 1). Belgian nurses were observed to spend approximately 10% of their workday bent over; Czechoslovakian nurses spent 11% of their workday positioning patients; and French nurses spent 16 to 24% of their workday in uncomfortable positions, such as stooping or squatting, or with their arms raised or loaded.
Table 1. Distribution of nurses’ time in three studies
|
Czechoslovakia |
Belgium |
France |
|
|
Authors |
Hubacova, Borsky and Strelka 1992* |
Malchaire 1992** |
Estryn-Béhar and |
|
Departments |
5 medical and surgical departments |
Cardiovascular surgery |
10 medical and |
|
Average time for the main postures and total distance walked by nurses: |
|||
|
Per cent working |
76% |
Morning 61% |
Morning 74% |
|
Including stooping, |
11% |
Morning 16% |
|
|
Standing flexed |
Morning 11% |
||
|
Distance walked |
Morning 4 km |
Morning 7 km |
|
|
Per cent working |
Three shifts: 47% |
Morning 38% |
Morning 24% |
Number of observations per shift:* 74 observations on 3 shifts. ** Morning: 10 observations (8 h); afternoon: 10 observations (8 h); night: 10 observations (11 h). *** Morning: 8 observations (8 h); afternoon: 10 observations (8 h); night: 9 observations (10-12 h).
In France, night-shift nurses spent somewhat more time sitting, but they end their shift by making beds and dispensing care, both of which involve work in uncomfortable positions. They are assisted in this by a nurses’ aide, but this should be contrasted with the situation during the morning shift, where these tasks are usually performed by two nurses’ aides. In general, nurses working day shifts spend less time in uncomfortable positions. Nurses’ aides were on their feet constantly, and uncomfortable positions, due largely to inadequate equipment, accounted for 31% (afternoon shift) to 46% (morning shift) of their time. Patient facilities in these French and Belgian teaching hospitals were spread out over large areas and consisted of rooms containing one to three beds. Nurses in these wards walked an average of 4 to 7 km per day.
Detailed ergonomic observation of entire workdays (Estryn-Béhar and Hakim-Serfaty 1990) is useful in revealing the interaction of the factors that determine quality of care and the manner in which work is performed. Consider the very different situations in a paediatric intensive care unit and a rheumatology ward. In paediatric resuscitation units, the nurse spends 71% of her time in patients’ rooms, and each patient’s equipment is kept on individual carts stocked by nurses’ aides. The nurses in this ward change location only 32 times per shift, walking a total of 2.5 km. They are able to communicate with physicians and other nurses in the adjoining lounge or nurses’ station through intercoms which have been installed in all the patients’ rooms.
By contrast, the nursing station in the rheumatology ward is very far from patients’ rooms, and care preparation is lengthy (38% of shift time). As a result, the nurses spend only 21% of their time in patients’ rooms and change location 128 times per shift, walking a total of 17 km. This clearly illustrates the interrelationship between physical strain, back problems and organizational and psychological factors. Because they need to move rapidly and get equipment and information, nurses only have time for hallway consultations—there is no time to sit while dispensing care, listen to patients and give patients personalized and integrated responses.
Continuous observation of 18 Dutch nurses in long-term-stay wards revealed that they spent 60% of their time performing physically demanding work with no direct contact with their patients (Engels, Senden and Hertog 1993). Housekeeping and preparation account for most of the 20% of the time described as spent in “slightly hazardous” activities. In all, 0.2% of shift time was spent in postures requiring immediate modification and 1.5% of shift time in postures requiring rapid modification. Contact with patients was the type of activity most frequently associated with these hazardous postures. The authors recommend modifying patient-handling practices and other less hazardous but more frequent tasks.
Given the physiological strain of the work of nurses’ aides, continuous measurement of heart rate is a useful complement to observation. Raffray (1994) used this technique to identify arduous housekeeping tasks and recommended not restricting personnel to this type of task for the whole day.
Electro-myographical (EMG) fatigue analysis is also interesting when body posture must remain more or less static—for example, during operations using an endoscope (Luttman et al. 1996).
Influence of architecture, equipment and organization
The inadequacy of nursing equipment, particularly beds, in 40 Japanese hospitals was demonstrated by Shindo (1992). In addition, patients’ rooms, both those lodging six to eight patients and single rooms reserved for the very ill, were poorly laid out and extremely small. Matsuda (1992) reported that these observations should lead to improvements in the comfort, safety and efficiency of nursing work.
In a French study (Saurel 1993), the size of patient rooms was problematic in 45 of 75 medium- and long-term-stay wards. The most common problems were:
- lack of space (30 wards)
- difficulty in manoeuvring patient-transfer gurneys (17)
- inadequate space for furniture (13)
- the need to take beds out of the room to transfer patients (12)
- difficult access and poor furniture layout (10)
- doors that were too small (8)
- difficulty moving between beds (8).
The mean available area per bed for patients and nurses is at the root of these problems and decreases as the number of beds per room increases: 12.98 m2, 9.84 m2, 9.60 m2, 8.49 m2 and 7.25 m2 for rooms with one, two, three, four and more than four beds. A more accurate index of the useful area available to personnel is obtained by subtracting the area occupied by the beds themselves (1.8 to 2.0 m2) and by other equipment. The French Department of Health prescribes a useful surface area of 16 m2 for single rooms and 22 m2 for double rooms. The Quebec Department of Health recommends 17.8 m2 and 36 m2, respectively.
Turning to factors favouring the development of back problems, variable-height mechanisms were present on 55.1% of the 7,237 beds examined; of these, only 10.3% had electric controls. Patient-transfer systems, which reduce lifting, were rare. These systems were systematically used by 18.2% of the 55 responding wards, with over half the wards reporting using them “rarely” or “never”. “Poor” or “rather poor” manoeuvrability of meal carts was reported by 58.5% of 65 responding wards. There was no periodic maintenance of mobile equipment in 73.3% of 72 responding wards.
In almost half the responding wards, there were no rooms with seats that nurses could use. In many cases, this appears to have been due to the small size of the patient rooms. Sitting was usually possible only in the lounges—in 10 units, the nursing station itself had no seats. However, 13 units reported having no lounge and 4 units used the pantry for this purpose. In 30 wards, there were no seats in this room.
According to statistics for 1992 provided by the Confederation of Employees of the Health Services Employees of the United Kingdom (COHSE), 68.2% of nurses felt that there were not enough mechanical patient lifts and handling aides and 74.5% felt that they were expected to accept back problems as a normal part of their work.
In Quebec, the Joint Sectoral Association, Social Affairs Sector (Association pour la santé et la sécurité du travail, secteur afffaires sociales, ASSTAS) initiated its “Prevention-Planning-Renovation-Construction” project in 1993 (Villeneuve 1994). Over 18 months, funding for almost 100 bipartite projects, some costing several million dollars, was requested. This programme’s goal is to maximize investments in prevention by addressing health and safety concerns early in the design stage of planning, renovation and design projects.
The association completed the modification of the design specifications for patient rooms in long-term-care units in 1995. After noting that three-quarters of occupational accidents involving nurses occur in patient rooms, the association proposed new dimensions for patients’ rooms, and new rooms must now provide a minimum amount of free space around beds and accommodate patient lifts. Measuring 4.05 by 4.95 m, the rooms are more square than the older, rectangular rooms. To improve performance, ceiling-mounted patient lifts were installed, in collaboration with the manufacturer.
The association is also working on the modification of construction standards for washrooms, where many occupational accidents also occur, although to a lesser extent than in the rooms themselves. Finally, the feasibility of applying anti-skid coatings (with a coefficient of friction above the minimum standard of 0.50) on floors is being studied, since patient autonomy is best promoted by providing a non-skid surface on which neither they nor nurses can slip.
Evaluation of equipment that reduces physical strain
Proposals for improving beds (Teyssier-Cotte, Rocher and Mereau 1987) and meal carts (Bouhnik et al. 1989) have been formulated, but their impact is too limited. Tintori et al. (1994) studied adjustable-height beds with electric trunk-lifts and mechanical mattress-lifts. The trunk-lifts were judged satisfactory by the staff and patients, but the mattress-lifts were very unsatisfactory, since adjusting the beds required more than eight pedal strokes, each of which exceeded standards for foot force. Pushing a button located close to the patient’s head while talking to her or him is clearly preferable to pumping a pedal eight times from the foot of the bed (see figure 1). Because of time constraints, the mattress lift was often simply not used.
Figure 1. Electronically-operated trunk-lifts on beds effectively reduce lifting accidents
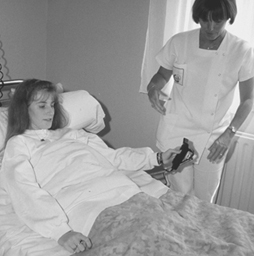
B. Floret
Van der Star and Voogd (1992) studied health care workers caring for 30 patients in a new prototype of bed over a period of six weeks. Observations of the workers’ positions, the height of work surfaces, physical interaction between nurses and patients and the size of the work space were compared to data collected on the same ward over a seven-week period prior to the introduction of the prototype. Use of the prototypes reduced the total time spent in uncomfortable positions while washing patients from 40% to 20%; for bed-making the figures were 35% and 5%. Patients also enjoyed greater autonomy and often changed positions on their own, raising their trunks or legs by means of electric control buttons.
In Swedish hospitals, each double room is equipped with ceiling-mounted patient lifts (Ljungberg, Kilbom and Goran 1989). Rigorous programmes such as the April Project evaluate the interrelation of working conditions, work organization, the establishment of a back school and the improvement of physical fitness (Öhling and Estlund 1995).
In Quebec, ASSTAS developed a global approach to the analysis of working conditions causing back problems in hospitals (Villeneuve 1992). Between 1988 and 1991, this approach led to modifications of the work environment and equipment used in 120 wards and a 30% reduction in the frequency and severity of occupational injuries. In 1994, a cost-benefit analysis performed by the association demonstrated that the systematic implementation of ceiling-mounted patient lifts would reduce occupational accidents and increase productivity, compared to the continued use of mobile, ground-based lifts (see figure 2).
Figure 2. Using ceiling-mounted patient lifts to reduce lifting accidents
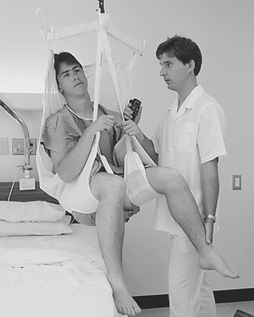
Accounting for individual variation and facilitating activity
The female population in France is generally not very physically active. Of 1,505 nurses studied by Estryn-Béhar et al. (1992), 68% participated in no athletic activity, with inactivity more pronounced among mothers and unskilled personnel. In Sweden, fitness programmes for hospital personnel have been reported to be useful (Wigaeus Hjelm, Hagberg and Hellstrom 1993), but are feasible only if potential participants do not end their work day too tired to participate.
The adoption of better work postures is also conditioned by the possibility of wearing appropriate clothing (Lempereur 1992). The quality of shoes is particularly important. Hard soles are to be avoided. Anti-skid soles prevent occupational accidents caused by slips and falls, which in many countries are the second-leading cause of accidents leading to work absence. Ill-fitting overshoes or boots worn by operating room personnel to minimize the build-up of static electricity may be a hazard for falls.
Slips on level floors can be prevented by using low-slip floor surfaces that require no waxing. The risk of slips, particularly at doorways, can also be reduced by using techniques that do not leave the floor wet for long. The use of one mop per room, recommended by hygiene departments, is one such technique and has the additional advantage of reducing the handling of buckets of water.
In Vasteras County (Sweden), the implementation of several practical measures reduced painful syndromes and absenteeism by at least 25% (Modig 1992). In the archives (e.g., record or file rooms), ground- and ceiling-level shelves were eliminated, and an adjustable sliding board on which personnel can take notes while consulting the archives was installed. A reception office equipped with movable filing units, a computer and a telephone was also constructed. The height of the filing units is adjustable, allowing employees to adjust them to their own needs and facilitating the transition from sitting to standing during work.
Importance of “anti-lifting”
Manual patient-handling techniques designed to prevent back injuries have been proposed in many countries. Given the poor results of these techniques that have been reported to date (Dehlin et al. 1981; Stubbs, Buckle and Hudson 1983), more work in this area is needed.
The department of kinesiology of the University of Groningen (Netherlands) has developed an integrated patient-handling programme (Landewe and Schröer 1993) consisting of:
- recognition of the relationship between patient-handling and back strain
- demonstration of the value of the “anti-lifting” approach
- sensitization of nursing students throughout their studies to the importance of avoiding back strain
- the use of problem-resolution techniques
- attention to implementation and evaluation.
In the “anti-lifting” approach, the resolution of problems associated with patient transfers is based on the systematic analysis of all aspects of transfers, especially those related to patients, nurses, transfer equipment, teamwork, general working conditions and environmental and psychological barriers to the use of patient lifts (Friele and Knibbe 1993).
The application of European standard EN 90/269 of 29 May 1990 on back problems is an example of an excellent starting point for this approach. Besides requiring employers to implement appropriate work organization structures or other appropriate means, particularly mechanical equipment, to avoid manual handling of loads by workers, it also emphasizes the importance of “no-risk” handling policies that incorporate training. In practice, the adoption of appropriate postures and handling practices depends on the amount of functional space, presence of appropriate furniture and equipment, good collaboration on work organization and quality of care, good physical fitness and comfortable work clothing. The net effect of these factors is improved prevention of back problems.
Occupational Health and Safety Practice: The Russian Experience
The work of people in the medical profession has great social value, and in recent years the urgent problem of the labour conditions and the state of health of HCWs has been studied actively. However, the nature of this work is such that any preventive and ameliorating measures cannot eliminate or reduce the main source of the hazards in the work of physicians and other HCWs: contact with a sick patient. In this respect the problem of prevention of occupational illness in medical workers is rather complicated.
In many cases the diagnostic and medical equipment and the methods of treatment used in medical institutions can affect the health of HCWs. Therefore, it is necessary to follow hygienic standards and precautionary measures to control the levels of exposure to unfavourable factors. Studies carried out in a number of Russian medical institutions have revealed that the labour conditions at many workplaces were not optimum and could induce the deterioration of the health of medical and support personnel, and sometimes cause the development of occupational diseases.
Among the physical factors that can substantially affect the health of medical personnel in the Russian Federation, ionizing radiation should be ranked as one of the first. Tens of thousands of Russian medical workers encounter sources of ionizing radiation at work. In the past, special laws were adopted to limit the doses and levels of irradiation at which specialists could work for a long period without health risk. In recent years x-ray control procedures were extended to cover not only radiologists, but surgeons, anaesthetists, traumatologists, rehabilitation specialists and mid-level personnel. The levels of radiation at worksites and the x-ray doses received by these individuals sometimes are even higher than the doses received by the radiologists and radiology laboratory assistants.
Instruments and equipment generating non-ionizing radiation and ultrasound are also widespread in modern medicine. Since many physiotherapy procedures are used precisely because of the therapeutic benefits of such treatment, the same biological effects may be hazardous to those involved in administering them. Persons encountering instruments and machines generating non-ionizing radiation are often reported to have functional disturbances in the nervous and cardiovascular systems.
Studies of working conditions where ultrasound is used for diagnostic or therapeutic procedures revealed that the personnel were exposed during as much as 85 to 95% of their working day to levels of high frequency, low intensity ultrasound comparable to the exposures experienced by operators of industrial ultrasonic defectoscopy. They experienced such impairments of the peripheral neuro-vascular system as angiodistonic syndrome, vegetative polyneuritis, vegetative vascular malfunction and so on.
Noise is rarely reported as a substantial factor of occupational risk in the work of Russian medical personnel, except at dental institutions. When using high-speed drills (200,000 to 400,000 rev/min) the maximum energy of the sound falls at a frequency of 800 Hz. The noise levels at a distance of 30 cm from the drill placed in the mouth of the patient vary from 80 to 90 dBA. One-third of the whole sound spectrum falls within the range most harmful to the ear (i.e., between 1000 and 2000 Hz).
Many noise sources gathered in one place can generate levels exceeding permissible limits. To create optimum conditions it is recommended that anaesthetizing machines, respiratory equipment and artificial blood circulation pumps be taken out of operating rooms.
In surgery departments, especially in operating rooms and in rehabilitation and intensive care departments, as well as in some other special rooms, it is necessary to maintain the required parameters of temperature, humidity and air circulation. The optimal layout of modern medical institutions and the installation of ventilation and air-conditioning plants provide the favourable microclimate.
However, in operating suites built without optimal planning, occlusive clothing (i.e., gowns, masks, caps and gloves) and exposure to heat from lighting and other equipment lead many surgeons and other members of the operating teams to complain of “overheating”. Perspiration is mopped from surgeons’ brows lest it interfere with their vision or contaminate the tissues in the surgical field.
As a result of the introduction into medical practice of treatment in hyperbaric chambers, physicians and nurses now are often exposed to heightened atmospheric pressure. In most cases this affects surgical teams performing operations in such chambers. Exposure to conditions of increased atmospheric pressure is believed to lead to unfavourable changes in a number of body functions, depending on the level of the pressure and the duration of the exposure.
Working posture is also of great importance for physicians. Although most tasks are performed in sitting or standing positions, some activities require long periods in awkward and uncomfortable positions. This is particularly the case with dentists, otologists, surgeons (especially microsurgeons), obstetricians, gynaecologists and physiotherapists. Work requiring long periods of standing in one position has been associated with the development of varicose veins in the legs and haemorrhoids.
Continual, intermittent or casual exposure to potentially hazardous chemicals used in medical institutions also can affect medical personnel. Among these chemicals, inhalation anaesthetics are considered to have the most unfavourable influence on humans. These gases can accumulate in large amounts not only in operating and delivery rooms but also in pre-op areas where anaesthesia is induced and in recovery rooms where they are exhaled by patients coming out of anaesthesia. Their concentration depends on the content of the gas mixtures being administered, the type of equipment being used and the duration of the procedure. Concentrations of anaesthetic gases in the breathing zones of surgeons and anaesthetists in the operating room have been found ranging from 2 to 14 times the maximum allowable concentration (MAC). Exposure to anaesthetic gases has been associated with impaired reproductive capacity of both male and female anaesthetists and abnormalities in the foetuses of pregnant female anaesthetists and the spouses of male anaesthetists (see chapter Reproductive system and the article “Waste anaesthetic gases" in this chapter).
In the treatment rooms where many injections are performed, the concentration of a medicine in the respiration zone of nurses can exceed permissible levels. Airborne drug exposure can happen when washing and sterilizing syringes, removing air bubbles from a syringe, and while dispensing aerosol therapy.
Among chemicals which could affect the health of medical personnel are hexachlorophene (possibly causing teratogenic effects), formalin (an irritant, sensitizer and carcinogen), ethylene oxide (which has toxic, mutagenic and carcinogenic characteristics), antibiotics that cause allergies and suppressed immune response, vitamins and hormones. There is also the possibility of exposure to industrial chemicals used in cleaning and maintenance work and as insecticides.
Many of the drugs used in the treatment of cancer are themselves mutagenic and carcinogenic. Special training programmes have been developed to prevent workers involved in preparing and administering them from exposure to such cytotoxic agents.
One of the features of job assignments of medical workers of many specialties is contact with infected patients. Any infectious disease incurred as a result of such contact is considered to be an occupational one. Viral serum hepatitis has proved to be the most dangerous for the staff of medical institutions. Viral hepatitis infections of laboratory assistants (from examining blood samples), staff members of haemodialysis departments, pathologists, surgeons, anaesthetists and other specialists who had occupational contact with the blood of infected patients have been reported (see the article “Prevention of occupational transmission of bloodborne pathogens” in this chapter).
There has apparently been no recent improvement in the health status of HCWs in the Russian Federation. The proportion of cases of work-related, temporary disability remained at the level of 80 to 96 per 100 working doctors and 65 to 75 per 100 mid-level medical workers. Although this measure of work loss is quite high, it should also be noted that self-treatment and informal, unreported treatment are widespread among HCWs, which means that many cases are not captured by the official statistics. This was confirmed by a survey among physicians which found that 40% of the respondents were ill four times a year or more but did not apply to a practising physician for medical care and did not submit a disability form. These data were corroborated by medical examinations which found evidence of disability in 127.35 cases per 100 workers examined.
Morbidity also increases with age. In these examinations, it was six times more frequent among HCWs with 25 years of service than among those with less than 5 years of service. The most common diseases included circulatory impairments (27.9%), diseases of the digestive organs (20.0%) and musculoskeletal disorders (20.72%). Except for the last, most of the cases were non-occupational in origin.
Sixty per cent of doctors and 46% of mid-level personnel were found to have chronic diseases. Many of these were directly associated with job assignments.
Many of the observed diseases were directly associated with job assignments of those examined. Thus, microsurgeons working in an awkward posture were found to have frequent osteochondroses; chemotherapists were found to suffer frequently from chromosome abnormalities and anaemia; nurses who were in contact with a large variety of medicines suffered various allergic diseases, ranging from dermatoses to bronchial asthma and immunodeficiency.
In Russia, health problems of medical workers were first addressed in the 1920s. In 1923 a special scientific-consultative bureau was founded in Moscow; the results of its studies were published in five collections entitled Labour and Life of Medical Workers of Moscow and Moscow Province. Since that time other studies have appeared devoted to this problem. But this work has been carried on in the most fruitful way only since 1975, when the Laboratory of Labour Hygiene of Medical Workers was established in the RAMS Institute of Occupational Health, which coordinated all the studies of this problem. After analysis of the then-current situation, research was directed at:
- studies of the features of labour processes in the main medical specialties
- assessment of the factors of the occupational environment
- analysis of the morbidity of medical workers
- elaboration of measures for optimization of labour conditions, reduction of fatigue and prevention of morbidity.
Based on the studies carried out by the Laboratory and other institutions, a number of recommendations and suggestions were prepared, aimed at reduction and prevention of the occupational diseases of medical workers.
Instructions were established for pre-employment and periodic medical examinations of health care workers. The aim of these examinations was to determine the fitness of the worker for the job and to prevent common and occupational diseases as well as occupational accidents. A list of hazardous and dangerous factors in the work of medical personnel was prepared which included recommendations for frequency of examinations, the range of specialists to take part in the examinations, the number of laboratory and functional studies as well as a list of medical contra-indications for work with a specific hazardous occupational factor. For every studied group there was a list of occupational diseases, enumerating the nosological forms, approximate list of job assignments and hazardous factors which can cause the respective occupational conditions.
In order to control the working conditions in treatment and prevention institutions, a Certificate of Sanitary and Technical Conditions of Labour in the health care institutions was developed. The certificate can be used as a guide for conducting sanitary measures and improvement of labour safety. For an institution to complete the certificate, it is necessary to carry out a study, with the help of specialists in sanitary service and other respective organizations, of the general situation in the departments, rooms and wards, to measure the levels of health and safety hazards.
Departments of hygiene of the preventive medicine institutions have been established in the modern centres of sanitary-epidemic inspections. The mission of these departments includes perfecting measures for the prevention of nosocomial infections and their complications in hospitals, creating optimal conditions for treatment and protecting the safety and health of HCWs. Public health doctors and their assistants conduct the preventive monitoring of design and construction of buildings for health care institutions. They see to the compliance of the new premises with the climate conditions, required arrangement of worksites, comfortable labour conditions and systems of rest and nutrition during the work shifts (see the article “Buildings for health care facilities” in this chapter). They also control technical documentation for the new equipment, technological procedures and chemicals. The routine sanitary inspection includes the monitoring of the occupational factors at the worksites and accumulation of the received data in the above-mentioned Certificate of Sanitary and Technical Conditions of Labour. Quantitative measurement of working conditions and prioritization of health improvement measures are established according to hygienic criteria for assessments of labour conditions which are based on indicators of the hazard and danger of labour environment factors and the heaviness and intensity of the working process. The frequency of laboratory studies is determined by the specific needs of each case. Each study usually includes measurement and analysis of microclimate parameters; measurement of indicators of air environment (e.g., content of bacteria and hazardous substances); assessment of the effectiveness of ventilation systems; assessment of the levels of natural and artificial illumination; and measurement of noise levels, ultrasound, ionizing radiation and so on. It is also recommended that time-keeping monitoring of the exposures of the unfavourable factors be conducted, based on the guideline documents.
According to instructions of the Russian government, and in keeping with current existing practice, the hygienic and medical standards should be revised following the accumulation of new data.
Case Study: Violence in Health Care Work
A psychotic patient in his thirties had been forcibly committed to a large psychiatric hospital in the suburbs of a city. He was not regarded as having violent tendencies. After a few days he escaped from his secure ward. The hospital authorities were informed by his relatives that he had returned to his own house. As was routine an escort of three male psychiatric nurses set out with an ambulance to bring the patient back. En route they stopped to pick up a police escort as was routine in such cases. When they arrived at the house, the police escort waited outside, in case a violent incident developed. The three nurses entered and were informed by the relatives that the patient was sitting in an upstairs bedroom. When approached and quietly invited to come back to hospital for treatment the patient produced a kitchen knife which he had hidden. One nurse was stabbed in the chest, another a number of times in the back and the third in the hand and the arm. All three nurses survived but had to spend time in hospital. When the police escort entered the bedroom the patient quietly surrendered the knife.
Home Care Workers: The New York City Experience
Massive use of home care workers in New York City began in 1975 as a response to the needs of the growing population of chronically ill and frail elderly and as an alternative to more expensive care in nursing homes, many of which had long lists of such people waiting for admission. Additionally, it allowed for more personal assistance at a time when nursing homes were perceived as impersonal and uncaring. It also provided entry-level employment to unskilled individuals, mostly women, many of whom were recipients of welfare.
Initially, these workers were employees of the City’s Department of Human Resources but, in 1980, this service was “privatized” and they were recruited, trained and employed by non-profit, community-based social agencies and traditional health care organizations such as hospitals which had to be certified by the State of New York as providers of home care services. The workers are categorized as home makers, personal care workers, health aides, home care attendants and housekeepers, depending on their levels of skills and the kinds of services they provide. Which of these services a particular client uses depends on an evaluation of that person’s health status and needs which is conducted by a licensed health professional, such as a physician, nurse or social worker.
The Home Care Workforce
Home care workers in New York City present a conglomerate of characteristics that provide a unique profile. A recent survey by Donovan, Kurzman and Rotman (1993) found that 94% are female with an average age of 45. About 56% were not born within the continental US and about 51% never completed high school. Only 32% were identified as married, 33% were separated or divorced and 26% were single, while 86% have children, 44% with children under 18 years of age. According to the survey, 63% live with their children and 26% live with a spouse.
The median family income for this group in 1991 was $12,000 per year. In 81% of these families, the home care worker was the primary breadwinner. In 1996, the annual salary of full-time home care workers’ ranged between $16,000 and $28,000; part-time workers earned less.
Such low earnings represent significant economic hardship to the survey respondents: 56% said they could not afford adequate housing; 61% reported being unable to afford furniture or household equipment; 35% said they lacked funds to purchase enough food for their families; and 36% were ineligible for Medicare and unable to afford needed medical care for themselves and their families. As a group, their financial status will inevitably worsen as cuts in government funding force curtailment of the amount and intensity of home care services being provided.
Home Care Services
The services provided by home care workers depend on the needs of the clients being served. Those with greater disability require assistance with the “basic activities of daily living”, which consist of bathing, dressing, toileting, transferring (moving in or out of bed and chairs) and feeding. Those with higher levels of functional capacity need help with the “instrumental activities of daily living”, which comprise housekeeping (cleaning, bed making, dishwashing, and so forth), shopping, food preparation and serving, laundry, using public or private transportation and managing finances. Home care workers may give injections, dispense medications and provide such treatments as passive exercise and massage as prescribed by the client’s physician. A most appreciated service is companionship and assisting the client to participate in recreational activities.
The difficulty of the home care worker’s job is directly related to the home environment and, in addition to physical status, the behaviour of the client and any family members who may be on the scene. Many clients (and the workers as well) live in poor neighbourhoods where crime rates are high, public transportation often marginal and public services substandard. Many live in deteriorated housing with no or non-functioning elevators, dark and dirty stairwells and hallways, lack of heat and hot water, dilapidated plumbing and poorly functioning household appliances. Commuting to and from the client’s home may be arduous and time-consuming.
Many of the clients may have very low levels of functional capacity and require assistance at every turn. Clients’ muscle weakness and lack of coordination, loss of vision and hearing and incontinence of bladder and/or bowels add to the burden of care. Mental difficulties such as senile dementia, anxiety and depression and difficulties in communication because of memory loss and language barriers may also magnify the difficulty. Finally, abusive and demanding behaviour on the part of both clients and their family members may sometimes escalate into acts of violence.
Home Care Work Hazards
Work hazards commonly encountered by home care workers include:
- working alone without assistance
- lack of education and training and remote, if any, supervision
- working in substandard housing in high risk neighbourhoods
- back pain and musculoskeletal injuries incurred while lifting, transferring and supporting clients who may be heavy, weak and poorly coordinated
- violence in the home and in the neighbourhood
- infectious diseases (the health care worker may not have been fully informed of the client’s medical status; recommended gloves, gowns and masks may not be available)
- household chemicals and cleaning supplies (often incorrectly labelled and stored)
- sexual harassment
- work stress.
Stress is probably the most ubiquitous hazard. It is compounded by the fact the worker is usually alone in the home with the client with no simple way to report trouble or summon assistance. Stress is being exacerbated as cost-containment efforts are reducing the hours of service allowed for individual clients.
Prevention Strategies
A number of strategies have been suggested to promote occupational health and safety for home care workers and to improve their lot. They include:
- development and promulgation of standards of practice for home care accompanied by improved education and training so that home care workers can meet them
- education and training in the recognition and avoidance of chemical and other hazards in the home
- training in lifting, carrying and giving physical support to clients as needed in the course of providing services
- preliminary needs assessment of clients supplemented by inspections of their homes so that potential hazards can be identified and eliminated or controlled and needed materials and equipment can be procured
- periodic meetings with supervisors and other home care workers to compare notes and receive instruction. Videotapes may be developed and used for skills demonstrations. The meetings may be supplemented by telephone networks through which workers may communicate with each other to exchange information and alleviate any feelings of isolation.
- establishment of a health and safety committee within each agency to review work-related accidents and problems and develop appropriate preventive interventions
- establishment of an Employee Assistance Programme (EAP) through which the workers may receive counselling for their own psychosocial problems both on- and off-the-job.
Educational and training sessions should be conducted during working hours at a place and time convenient for the workers. They should be supplemented by the distribution of instructional materials designed for the low educational levels of most of the workers and, when necessary, they should be multilingual.
Case study: Violence in health care work
A psychotic patient in his thirties had been forcibly committed to a large psychiatric hospital in the suburbs of a city. He was not regarded as having violent tendencies. After a few days he escaped from his secure ward. The hospital authorities were informed by his relatives that he had returned to his own house. As was routine an escort of three male psychiatric nurses set out with an ambulance to bring the patient back. En route they stopped to pick up a police escort as was routine in such cases. When they arrived at the house, the police escort waited outside, in case a violent incident developed. The three nurses entered and were informed by the relatives that the patient was sitting in an upstairs bedroom. When approached and quietly invited to come back to hospital for treatment the patient produced a kitchen knife which he had hidden. One nurse was stabbed in the chest, another a number of times in the back and the third in the hand and the arm. All three nurses survived but had to spend time in hospital. When the police escort entered the bedroom the patient quietly surrendered the knife.
Daniel Murphy
Social Services
Overview of the Social Work Profession
Social workers function in a wide variety of settings and work with many different kinds of people. They work in community health centres, hospitals, residential treatment centres, substance-abuse programmes, schools, family service agencies, adoption and foster care agencies, day-care facilities and public and private child welfare organizations. Social workers often visit homes for interviews or inspections of home conditions. They are employed by businesses, labour unions, international aid organizations, human rights agencies, prisons and probation departments, agencies for the ageing, advocacy organizations, colleges and universities. They are increasingly entering politics. Many social workers have full- or part-time private practices as psychotherapists. It is a profession that seeks to “improve social functioning by the provision of practical and psychological help to people in need” (Payne and Firth-Cozens 1987).
Generally, social workers with doctorates work in community organization, planning, research, teaching or combined areas. Those with bachelor’s degrees in social work tend to work in public assistance and with the elderly, mentally retarded and developmentally disabled; social workers with master’s degrees are usually found in mental health, occupational social work and medical clinics (Hopps and Collins 1995).
Hazards and Precautions
Stress
Studies have shown that stress in the workplace is caused, or contributed to, by job insecurity, poor pay, work overload and lack of autonomy. All of these factors are features of the work life of social workers in the late 1990s. It is now accepted that stress is often a contributing factor to illness. One study has shown that 50 to 70% of all medical complaints among social workers are linked to stress (Graham, Hawkins and Blau 1983).
As the social work profession has attained vendorship privileges, managerial responsibilities and increased numbers in private practice, it has become more vulnerable to professional liability and malpractice suits in countries such as the United States which permit such legal actions, a fact which contributes to stress. Social workers are also increasingly dealing with bioethical issues—those of life and death, of research protocols, of organ transplantation and of resource allocation. Often there is inadequate support for the psychological toll confronting these issues can take on involved social workers. Increased pressures of high caseloads as well as increased reliance on technology makes for less human contact, a fact which is likely true for most professions, but particularly difficult for social workers whose choice of work is so related to having face to face contact.
In many countries, there has been a shift away from government-funded social programmes. This policy trend directly affects the social work profession. The values and goals generally held by social workers—full employment, a “safety net” for the poor, equal opportunity for advancement—are not supported by these current trends.
The movement away from spending on programmes for the poor has produced what has been called an “upside-down welfare state” (Walz, Askerooth and Lynch 1983). One result of this, among others, has been increased stress for social workers. As resources decline, demand for services is on the rise; as the safety net frays, frustration and anger must rise, both for clients and for social workers themselves. Social workers may increasingly find themselves in conflict over respecting the values of the profession versus meeting statutory requirements. The code of ethics of the US National Association of Social Workers, for example, mandates confidentiality for clients which may be broken only when it is for “compelling professional reasons”. Further, social workers are to promote access to resources in the interest of “securing or retaining social justice”. The ambiguity of this could be quite problematic for the profession and a source of stress.
Violence
Work-related violence is a major concern for the profession. Social workers as problem-solvers on the most personal level are particularly vulnerable. They work with powerful emotions, and it is the relationship with their clients which becomes the focal point for expression of these emotions. Often, an underlying implication is that the client is unable to manage his or her own problems and needs the help of social workers to do so. The client may, in fact, be seeing social workers involuntarily, as, for example, in a child welfare setting where parental abilities are being evaluated. Cultural mores might also interfere with accepting offers of help from someone of another cultural background or sex (the preponderence of social workers are women) or outside of the immediate family. There may be language barriers, necessitating the use of translators. This can be distracting at least or even totally disruptive and may present a skewed picture of the situation at hand. These language barriers certainly affect the ease of communication, which is essential in this field. Further, social workers may work in locations which are in high-crime areas, or the work might take them into the “field” to visit clients who live in those areas.
Application of safety procedures is uneven in social agencies, and, in general, insufficient attention has been paid to this area. Prevention of violence in the workplace implies training, managerial procedures and modifications of the physical environment and/or communication systems (Breakwell 1989).
A curriculum for safety has been suggested (Griffin 1995) which would include:
- training in constructive use of authority
- crisis intervention
- field and office safety
- physical plant set-up
- general prevention techniques
- ways to predict potential violence.
Other Hazards
Because social workers are employed in such a variety of settings, they are exposed to many of the hazards of the workplace discussed elsewhere in this Encyclopaedia. Mention should be made, however, that these hazards include buildings with poor or unclean air flow (“sick buildings”) and exposures to infection. When funding is scarce, maintenance of physical plants suffers and risk of exposure increases. The high percentage of social workers in hospital and out-patient medical settings suggests vulnerability to infection exposure. Social workers see patients with conditions like hepatitis, tuberculosis and other highly contagious diseases as well as human immunodeficiency virus (HIV) infection. In response to this risk for all health workers, training and measures for infection control are necessary and have been mandated in many countries. The risk, however, persists.
It is evident that some of the problems faced by social workers are inherent in a profession which is so centred on lessening human suffering as well as one which is so affected by changing social and political climates. At the end of the twentieth century, the profession of social work finds itself in a state of flux. The values, ideals and rewards of the profession are also at the heart of the hazards it presents to its practitioners.
Are They Health Care Workers, Too?
Often overlooked when considering the safety and well-being of health care workers are students attending medical, dental, nursing and other schools for health professionals and volunteers serving pro bono in healthcare facilities. Since they are not “employees” in the technical or legal sense of the term, they are ineligible for workers’ compensation and employment-based health insurance in many jurisdictions. Health care administrators have only a moral obligation to be concerned about their health and safety.
The clinical segments of their training bring medical, nursing and dental students into direct contact with patients who may have infectious diseases. They perform or assist in a variety of invasive procedures, including taking blood samples, and often do laboratory work involving body fluids and specimens of urine and faeces. They are usually free to wander about the facility, entering areas containing potential hazards often, since such hazards are rarely posted, without an awareness of their presence. They are usually supervised very loosely, if at all, while their instructors are often not very knowledgeable, or even interested, in matters of safety and health protection.
Volunteers are rarely permitted to participate in clinical care but they do have social contacts with patients and they usually have few restrictions with respect to areas of the facility they may visit.
Under normal circumstances, students and volunteers share with health care workers the risks of exposure to potentially harmful hazards. These risks are exacerbated at times of crisis and in emergencies when they step into or are ordered into the breech. Clearly, even though it may not be spelled out in laws and regulations or in organizational procedure manuals, they are more than entitled to the concern and protection extended to “regular” health care workers.
Health Care: Its Nature and its Occupational Health Problems
Health care is a labour intensive industry and, in most countries, health care workers (HCWs) constitute a major sector of the workforce. They comprise a wide range of professional, technical and support personnel working in a large variety of settings. In addition to health professionals, laboratory technicians, pharmacists, social workers and others involved in clinical services, they include administrative and clerical personnel, housekeeping and dietary staff, laundry workers, engineers, electricians, painters and maintenance workers who repair and refurbish the building and the equipment it contains. In contrast with those providing direct care, these support workers usually have only casual, incidental contact with patients.
HCWs represent diverse educational, social and ethnic levels and are usually predominantly female. Many, particularly in home care, are employed in entry-level positions and require considerable basic training. Table 1 lists samples of health care functions and associated occupations.
Table 1. Examples of health care functions and associated occupations
|
Functions |
Occupational category * |
Specific occupations |
|
Direct patient care |
Health-diagnosing occupations |
Physicians |
|
Technical support |
Health technicians |
Clinical laboratory technicians |
|
Services |
Health services |
Dental assistants |
|
Administrative support |
Clerical services |
Billing clerks |
|
Research |
Scientific occupations |
Scientists and research |
* Occupational categories are, in part, adapted from those used by the US Department of Labor, Bureau of Labor Statistics.
A segment of the health sector (unfortunately, often too small and under-resourced in most communities) is devoted to direct and indirect preventive services. The major focus of the health care industry, however, is the diagnosis, treatment and care of the sick. This creates a special set of dynamics, for the sick exhibit varying levels of physical and emotional dependencies that set them apart from the customers in such personal services industries as, for example, retail trade, restaurants and hotels. They require, and traditionally receive, special services and considerations, often on an emergency basis, provided frequently at the expense of the HCWs’ personal comfort and safety.
Reflecting their size and numbers of employees, acute and long-term care facilities constitute perhaps the most prominent elements in the health care industry. They are supplemented by outpatient clinics, “surgicenters” (facilities for outpatient surgery), clinical and pathological laboratories, pharmacies, x-ray and imaging centres, ambulance and emergency care services, individual and group offices, and home care services. These may be located within a hospital or operated elsewhere under its aegis, or they may be free-standing and operated independently. It should be noted that there are profound differences in the way health services are delivered, ranging from the well-organized, “high tech” care available in urban centres in developed countries to the underserved areas in rural communities, in developing countries and in inner-city enclaves in many large cities.
Superimposed on the health care system is a massive educational and research establishment in which students, faculty, researchers and support staffs often come in direct contact with patients and participate in their care. This comprises schools of medicine, dentistry, nursing, public health, social work and the variety of technical disciplines involved in health care.
The health care industry has been undergoing profound changes during the past few decades. Ageing of the population, especially in developed countries, has amplified the use of nursing homes, domiciliary facilities and home care services. Scientific and technological developments have not only led to the creation of new types of facilities staffed by new classes of specially-trained personnel, but they have also de-emphasized the role of the acute care hospital. Now, many services requiring inpatient care are being provided on an ambulatory basis. Finally, fiscal constraints dictated by the continuing escalation of health care costs have been reconfiguring the health care industry, at least in developing countries, resulting in pressure for cost-containment to be achieved through changes in the organization of health care services.
HCWs who are in direct contact with the sick, wherever they work, are exposed to a number of unique hazards. They face the risk of acquiring infections from the patients they serve, as well as the risk of musculoskeletal injuries when lifting, transferring or restraining them. Support staff not directly involved in patient care (e.g., laundry and housekeeping and materials handling workers) are not only routinely exposed to chemicals, such as cleaning agents and disinfectants of industrial strength, but are also exposed to biological hazards from contaminated linens and wastes (see figure 1). There is also the ethos of health care which, especially in emergency situations, requires HCWs to put the safety and comfort of their patients above their own. Coping with the stress of therapeutic failures, death and dying often takes its toll in worker burnout. All this is compounded by shift work, deliberate or inadvertent understaffing and the necessity of catering to the sometimes unreasonable demands from patients and their families. Finally, there is the threat of abuse and violence from patients, particularly when the job requires them to work alone or takes them into unsafe areas. All these are described in greater detail in other articles in this chapter and elsewhere in this Encyclopaedia.
Figure 1. Handling contaminated biological material
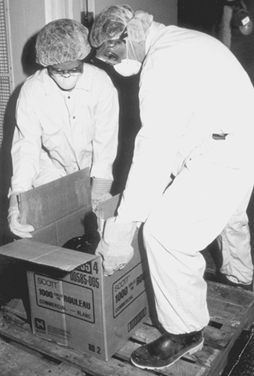
Health Sciences Centre, Winnipeg, Manitoba, Canada
The US National Institute for Occupational Safety and Health (NIOSH) reported that needle punctures, musculoskeletal sprains and back injuries probably were the most common injuries in the health care industry (Wugofski 1995). The World Health Organization (WHO) Conference on Occupational Hazards in 1981 identified as its five main areas of concern:
- cuts, lacerations and fractures
- back injuries
- lack of personal safety equipment
- poor maintenance of mechanical and electrical systems
- assault by patients.
Are they health care workers, too?
Often overlooked when considering the safety and well-being of health care workers are students attending medical, dental, nursing and other schools for health professionals and volunteers serving pro bono in healthcare facilities. Since they are not “employees” in the technical or legal sense of the term, they are ineligible for workers’ compensation and employment-based health insurance in many jurisdictions. Health care administrators have only a moral obligation to be concerned about their health and safety.
The clinical segments of their training bring medical, nursing and dental students into direct contact with patients who may have infectious diseases. They perform or assist in a variety of invasive procedures, including taking blood samples, and often do laboratory work involving body fluids and specimens of urine and faeces. They are usually free to wander about the facility, entering areas containing potential hazards often, since such hazards are rarely posted, without an awareness of their presence. They are usually supervised very loosely, if at all, while their instructors are often not very knowledgeable, or even interested, in matters of safety and health protection.
Volunteers are rarely permitted to participate in clinical care but they do have social contacts with patients and they usually have few restrictions with respect to areas of the facility they may visit.
Under normal circumstances, students and volunteers share with health care workers the risks of exposure to potentially harmful hazards. These risks are exacerbated at times of crisis and in emergencies when they step into or are ordered into the breech. Clearly, even though it may not be spelled out in laws and regulations or in organizational procedure manuals, they are more than entitled to the concern and protection extended to “regular” health care workers.
Leon Warshaw
Biological Hazards
Biological hazards, which pose a risk for infectious disease, are common throughout the world, but they are particularly problematic in developing countries. While the hepatitis B virus (HBV) is a nearly universal threat to HCWs, it is particularly important in African and Asian countries where this virus is endemic. As discussed later in this chapter, the risk of HBV transmission after percutaneous exposure to hepatitis B surface antigen (HBsAg) positive blood is approximately 100-fold higher than the risk of transmitting the human immunodeficiency virus (HIV) through percutaneous exposure to HIV-infected blood (i.e., 30% versus 0.3%). Nonetheless, there has indeed been an evolution of concern regarding parenteral exposure to blood and body fluids from the pre-HIV to the AIDS era. McCormick et al. (1991) found that the annual reported incidents of injuries from sharp instruments increased more than threefold during a 14-year period and among medical house officers the reported incidents increased ninefold. Overall, nurses incur approximately two-thirds of the needlestick injuries reported. Yassi and McGill (1991) also noted that nursing staff, particularly nursing students, are at highest risk for needlestick injuries, but they also found that approximately 7.5% of medical personnel reported exposures to blood and body fluids, a figure that is probably low because of underreporting. These data were consistent with other reports which indicated that, while there is increased reporting of needlesticks reflecting concerns about HIV and AIDS, certain groups continue to underreport. Sterling (1994) concludes that underreporting of needlestick injuries ranges from 40 to 60%.
Certain risk factors clearly enhance the likelihood of transmission of bloodborne diseases; these are discussed in the article “Prevention of occupational transmission of bloodborne pathogens”. Frequent exposure has indeed been associated with high seroprevalence rates of hepatitis B among laboratory workers, surgeons and pathologists. The risk of hepatitis C is also increased. The trend towards greater attention to prevention of needlestick injuries is, however, also noteworthy. The adoption of universal precautions is an important advance. Under universal precautions, it is assumed that all blood-containing fluid is potentially infectious and that appropriate safeguards should always be invoked. Safe disposal containers for needles and other sharp instruments are increasingly being placed in conveniently accessible locations in treatment areas, as illustrated in figure 2. The use of new devices, such as the needle-less access system for intravenous treatment and/or blood sampling has been shown to be a cost-effective method of reducing needlestick injuries (Yassi and McGill 1995).
Figure 2. Disposal container for sharp instruments and devices
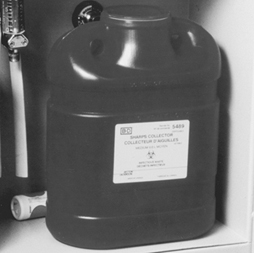
Health Sciences Centre, Winnipeg, Manitoba, Canada
Blood and body fluids are not the only source of infection for HCWs. Tuberculosis (TB) is also on the rise again in parts of the world where previously its spread had been curtailed and, as discussed later in this chapter, is a growing occupational health concern. In this, as in other nosocomial infections, such concern is heightened by the fact that so many of the organisms involved have become drug-resistant. There is also the problem of new outbreaks of deadly infectious agents, such as the Ebola virus. The article “Overview of infectious diseases” summarizes the major infectious disease risks for HCWs.
Chemical Hazards
HCWs are exposed to a wide variety of chemicals, including disinfectants, sterilants, laboratory reagents, drugs and anaesthetic agents, to name just a few of the categories. Figure 3 shows a storage cabinet in an area of a large hospital where prosthetics are fabricated and clearly illustrates the vast array of chemicals that are present in health care facilities. Some of these substances are highly irritating and may also be sensitizing. Some disinfectants and antiseptics also tend to be quite toxic, also with irritating and sensitizing propensities that may induce skin or respiratory tract disease. Some, like formaldehyde and ethylene oxide, are classified as mutagens, teratogens and human carcinogens as well. Prevention depends on the nature of the chemical, the maintenance of the apparatus in which it is used or applied, environmental controls, worker training and, in some instances, the availability of correct personal protective equipment. Often such control is straightforward and not very expensive. For example, Elias et al. (1993) showed how ethylene oxide exposure was controlled in one health care facility. Other articles in this chapter address chemical hazards and their management.
Figure 3. Storage cabinet for hazardous chemicals
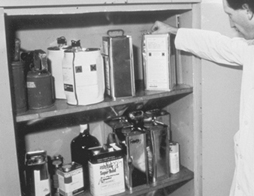
Health Sciences Centre, Winnipeg, Manitoba, Canada
Physical Hazards and the Building Environment
In addition to the specific environmental contaminants faced by HCWs, many health care facilities also have documented indoor air quality problems. Tran et al. (1994), in studying symptoms experienced by operating room personnel, noted the presence of the “sick building syndrome” in one hospital. Building design and maintenance decisions are, therefore, extremely important in health care facilities. Particular attention must be paid to correct ventilation in specific areas such as laboratories, operating rooms and pharmacies, the availability of hoods and avoidance of the insertion of chemical-laden fumes into the general air-conditioning system. Controlling the recirculation of air and using special equipment (e.g., appropriate filters and ultraviolet lamps) is needed to prevent the transmission of air-borne infectious agents. Aspects of the construction and planning of health care facilities are discussed in the article “Buildings for health care facilities”.
Physical hazards are also ubiquitous in hospitals (see “Exposure to physical agents” in this chapter). The wide variety of electrical equipment used in hospitals can present an electrocution hazard to patients and staff if not properly maintained and grounded (see figure 4). Especially in hot and humid environments, heat exposure may present a problem to workers in such areas as laundries, kitchens and boiler rooms. Ionizing radiation is a special concern for staff in diagnostic radiology (i.e., x ray, angiography, dental radiography and computerized axial tomography (CAT) scans) as well as for those in therapeutic radiology. Controlling such radiation exposures is a routine matter in designated departments where there is careful supervision, well-trained technicians and properly shielded and maintained equipment, but it can be a problem when portable equipment is used in emergency rooms, intensive care units and operating rooms. It can also be a problem to housekeeping and other support staff whose duties take them into areas of potential exposure. In many jurisdictions these workers have not been properly trained to avoid this hazard. Exposure to ionizing radiation may also present a problem in diagnostic and therapeutic nuclear medicine units and in preparing and distributing doses of radioactive pharmaceuticals. In some cases, however, radiation exposure remains a serious problem (see the article “Occupational health and safety practice: The Russian experience” in this chapter).
Figure 4. Electrical equipment in hospital
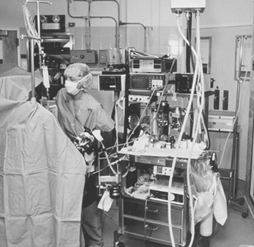
Health Sciences Centre, Winnipeg, Manitoba, Canada
Contradicting the prevailing impression of hospitals as quiet workplaces, Yassi et al. (1991) have documented the surprising extent of noise-induced hearing loss among hospital workers (see table 2). The article “Ergonomics of the physical work environment” in this chapter offers useful recommendations for controlling this hazard, as does table 3.
Table 2. 1995 integrated sound levels
|
Area monitored |
dBA (lex) Range |
|
Cast room |
76.32 to 81.9 |
|
Central energy |
82.4 to 110.4 |
|
Nutrition and food services (main kitchen) |
|
|
Housekeeping |
|
|
Laundry |
|
|
Linen service |
76.3 to 91.0 |
|
Mailroom |
|
|
Maintenance |
|
|
Materials handling |
|
|
Print shop |
|
|
Rehabilitation engineering |
|
Note: “Lex” means the equivalent sound level or the steady sound level in dBA which, if present in a workplace for 8 hours, would contain the same acoustic energy.
Table 3. Ergonomic noise reduction options
|
Work area |
Process |
Control options |
|
Central energy |
General area |
Enclose the source |
|
Dietetics |
Pot washer |
Automate process |
|
Housekeeping |
Burnishing |
Purchasing criteria |
|
Laundry |
Dryer/washer |
Isolate and reduce vibration |
|
Mailroom |
Tuberoom |
Purchasing criteria |
|
Maintenance |
Various equipment |
Purchasing criteria |
|
Materiel handling and |
Carts |
Maintenance |
|
Print shop |
Press operator |
Maintenance |
|
Rehabilitation |
Orthotics |
Purchasing criteria |
By far the most common and most costly type of injury faced by HCWs is back injury. Nurses and attendants are at greatest risk of musculoskeletal injuries due to the large amount of patient lifting and transferring that their jobs require. The epidemiology of back injury in nurses was summarized by Yassi et al. (1995a) with respect to one hospital. The pattern they observed mirrors those that have been universally reported. Hospitals are increasingly turning to preventive measures which may include staff training and the use of mechanical lifting devices. Many are also providing up-to-date diagnostic, therapeutic and rehabilitation health services that will minimize lost time and disability and are cost-effective (Yassi et al. 1995b). Hospital ergonomics has taken on increasing importance and, therefore, is the subject of a review article in this chapter. The specific problem of the prevention and management of back pain in nurses as one of the most important problems for this cohort of HCWs is also discussed in the article “Prevention and management of back pain in nurses” in this chapter. Table 4 lists the total number of injuries in a one-year period.
Table 4. Total number of injuries, mechanism of injury and nature of industry (one hospital, all departments), 1 April 1994 to 31 March 1995
|
Nature of injury sustained |
Total |
||||||||||||
|
Mechanism |
Blood/ |
Cut/ |
Bruise/ |
Sprain/ |
Fracture/ |
Burn/ |
Human |
Broken |
Head- |
Occupa- |
Other3 |
Un- |
|
|
Exertion |
|||||||||||||
|
Transferring |
105 |
105 |
|||||||||||
|
Lifting |
83 |
83 |
|||||||||||
|
Assisting |
4 |
4 |
|||||||||||
|
Turning |
27 |
27 |
|||||||||||
|
Breaking fall |
28 |
28 |
|||||||||||
|
Pushing |
1 |
25 |
26 |
||||||||||
|
Lifting |
1 |
52 |
1 |
54 |
|||||||||
|
Pulling |
14 |
14 |
|||||||||||
|
Combination- |
38 |
38 |
|||||||||||
|
Other |
74 |
74 |
|||||||||||
|
Fall |
3 |
45 |
67 |
3 |
1 |
119 |
|||||||
|
Struck/ |
66 |
76 |
5 |
2 |
2 |
1 |
152 |
||||||
|
Caught in/ |
13 |
68 |
8 |
1 |
1 |
91 |
|||||||
|
Exp. |
3 |
1 |
4 |
19 |
16 |
12 |
55 |
||||||
|
Staff abuse |
|||||||||||||
|
Patient |
16 |
11 |
51 |
28 |
8 |
3 |
1 |
2 |
120 |
||||
|
Spill/splashes |
80 |
1 |
81 |
||||||||||
|
Drug/ |
2 |
2 |
|||||||||||
|
Exp. |
5 |
5 |
10 |
||||||||||
|
Needlesticks |
159 |
22 |
181 |
||||||||||
|
Scalpel cuts |
34 |
14 |
48 |
||||||||||
|
Other5 |
3 |
1 |
29 |
1 |
6 |
40 |
|||||||
|
Unknown (no |
8 |
8 |
|||||||||||
|
Total |
289 |
136 |
243 |
558 |
5 |
33 |
8 |
7 |
19 |
25 |
29 |
8 |
1,360 |
1 No blood/body fluid. 2 This includes rashes/dermatitis/work-related illness/burning eyes, irritated eyes. 3 Exposure to chemical or physical agents but with no documented injuries affects. 4 Accident not reported. 5 Exposure to cold/heat, unknown.
In discussing musculoskeletal and ergonomic problems, it is important to note that while those engaged in direct patient care may be at greatest risk (see figure 5) many of the support personnel in hospital must contend with similar ergonomic burdens (see figure 6 and figure 7). The ergonomic problems facing hospital laundry workers have been well-documented (Wands and Yassi 1993) (see figure 8, figure 9 and figure 10) and they also are common among dentists, otologists, surgeons and especially microsurgeons, obstetricians, gynaecologists and other health personnel who often must work in awkward postures.
Figure 5. Patient lifting is an ergonomic hazard in most hospitals
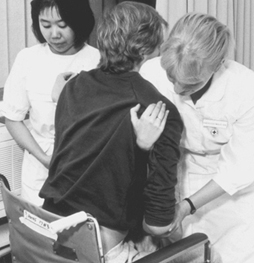
Health Sciences Centre, Winnipeg, Manitoba, Canada
Figure 6. Overhead painting: A typical ergonomic hazard for a tradesworker

Health Sciences Centre, Winnipeg, Manitoba, Canada
Figure 7. Cast-making involves many ergonomic stresses

Health Sciences Centre, Winnipeg, Manitoba, Canada
Figure 8. Laundry work such as this can cause repetitive stress injury to the upper limbs

Health Sciences Centre, Winnipeg, Manitoba, Canada
Figure 9. This laundry task requires working in an awkward position

Health Sciences Centre, Winnipeg, Manitoba, Canada
Figure 10. A poorly designed laundry operation can cause back strain
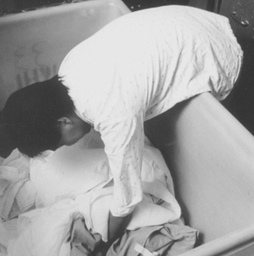
Health Sciences Centre, Winnipeg, Manitoba, Canada
Organizational Problems
The article “Strain in health care work” contains a discussion of some of the organizational problems in hospitals and a summary of the principal findings of Leppanen and Olkinuora (1987), who reviewed Finnish and Swedish studies of stress among HCWs. With the rapid changes currently under way in this industry, the extent of alienation, frustration and burnout among HCWs is considerable. Added to that is the prevalence of staff abuse, an increasingly troublesome problem in many facilities (Yassi 1994). While it is often thought that the most difficult psychosocial problem faced by HCWs is dealing with death and dying, it is being recognized increasingly that the nature of the industry itself, with its hierarchical structure, its growing job insecurity and the high demands unsupported by adequate resources, is the cause of the variety of stress-related illness faced by HCWs.
The Nature of the Health Care Sector
In 1976, Stellman wrote, “If you ever wondered how people can manage to work with the sick and always stay healthy themselves, the answer is that they can’t” (Stellman 1976). The answer has not changed, but the potential hazards have clearly expanded from infectious diseases, back and other injuries, stress and burnout to include a large variety of potentially toxic environmental, physical and psychosocial exposures. The world of the HCW continues to be largely unmonitored and largely unregulated. None the less, progress is being made in addressing occupational health and safety hazards in hospitals. The International Commission on Occupational Health (ICOH) has a sub-committee addressing this problem, and several international conferences have been held with published proceedings that offer useful information (Hagberg et al. 1995). The US Centers for Disease Control and Prevention (CDC) and NIOSH have proposed guidelines to address many of the problems of the health care industry discussed in this article (e.g., see NIOSH 1988). The number of articles and books addressing health and safety issues for HCWs has been growing rapidly, and good overviews of health and safety in the US health care industry have been published (e.g., Charney 1994; Lewy 1990; Sterling 1994). The need for systematic data collection, study and analysis regarding hazards in the health care industry and the desirability of assembling interdisciplinary occupational health teams to address them have become increasingly evident.
When considering occupational health and safety in the health care industry, it is crucial to appreciate the enormous changes currently taking place in it. Health care “reform”, being instituted in most of the developed countries of the world, is creating extraordinary turbulence and uncertainty for HCWs, who are being asked to absorb rapid changes in their work tasks often with greater exposure to risks. The transformation of health care is spurred, in part, by advances in medical and scientific knowledge, the development of innovative technological procedures and the acquisition of new skills. It is also being driven, however, and perhaps to an even greater extent, by concepts of cost-effectiveness and organizational efficiency, in which “downsizing” and “cost control” have often seemed to become goals in themselves. New institutional incentives are being introduced at different organizational levels in different countries. The contracting out of jobs and services that had traditionally been carried out by a large stable workforce is now increasingly becoming the norm. Such contracting out of work is reported to have helped the health administrators and politicians achieve their long-term goal of making the process of health care more flexible and more accountable. These changes have also brought changes in roles that were previously rather well-defined, undermining the traditional hierarchical relationships among planners, administrators, physicians and other health professionals. The rise of investor-owned health care organizations in many countries has introduced a new dynamic in the financing and management of health services. In many situations, HCWs have been forced into new working relationships that involve such changes as downgrading services so that they can be performed by less-skilled workers at lower pay, reduced staffing levels, staff redeployments involving split shifts and part-time assignments. At the same time, there has been a slow but steady growth in the numbers of such physician surrogates as physician assistants, nurse practitioners, midwives and psychiatric social workers who command lower rates of pay than the physicians they are replacing. (The ultimate social and health costs both to HCWs and to the public, as patients and payers, is still to be determined.)
A growing trend in the US that is also emerging in the UK and northern European countries is “managed care”. This generally involves the creation of organizations paid on a per capita basis by insurance companies or government agencies to provide or contract for the provision of a comprehensive range of health services to a voluntarily-enrolled population of subscribers. Their aim is to reduce the costs of health care by “managing” the process: using administrative procedures and primary care physicians as “gatekeepers” to control the utilization of expensive in-patient hospital days, reducing referrals to high-priced specialists and use of costly diagnostic procedures, and denying coverage for expensive new forms of “experimental” treatment. The growing popularity of these managed care systems, fuelled by aggressive marketing to employer- and government-sponsored groups and individuals, has made it difficult for physicians and other health care providers to resist becoming involved. Once engaged, there is a variety of financial incentives and disincentives to influence their judgement and condition their behaviour. The loss of their traditional autonomy has been particularly painful for many medical practitioners and has had a profound influence on their patterns of practice and their relationships with other HCWs.
These rapid changes in the organization of the health care industry are having profound direct and indirect effects on the health and safety of HCWs. They affect the ways health services are organized, managed, delivered and paid for. They affect the ways HCWs are trained, assigned and supervised and the extent to which considerations of their health and safety are addressed. This should be kept in mind as the various occupational health hazards faced by HCWs are discussed in this chapter. Finally, although it may not appear to be directly relevant to the content of this chapter, thought should be given to the implications of the well-being and performance of HCWs to the quality and effectiveness of the services they provide to their patients.
More...
Statistical Methods
There is much debate on the role of statistics in epidemiological research on causal relationships. In epidemiology, statistics is primarily a collection of methods for assessing data based on human (and also on animal) populations. In particular, statistics is a technique for the quantification and measurement of uncertain phenomena. All the scientific investigations which deal with non-deterministic, variable aspects of reality could benefit from statistical methodology. In epidemiology, variability is intrinsic to the unit of observation—a person is not a deterministic entity. While experimental designs would be improved in terms of better meeting the assumptions of statistics in terms of random variation, for ethical and practical reasons this approach is not too common. Instead, epidemiology is engaged in observational research which has associated with it both random and other sources of variability.
Statistical theory is concerned with how to control unstructured variability in the data in order to make valid inferences from empirical observations. Lacking any explanation for the variable behaviour of the phenomenon studied, statistics assumes it as random—that is, non-systematic deviations from some average state of nature (see Greenland 1990 for a criticism of these assumptions).
Science relies on empirical evidence to demonstrate whether its theoretical models of natural events have any validity. Indeed, the methods used from statistical theory determine the degree to which observations in the real world conform to the scientists’ view, in mathematical model form, of a phenomenon. Statistical methods, based in mathematics, have therefore to be carefully selected; there are plenty of examples about “how to lie with statistics”. Therefore, epidemiologists should be aware of the appropriateness of the techniques they apply to measure the risk of disease. In particular, great care is needed when interpreting both statistically significant and statistically non-significant results.
The first meaning of the word statistics relates to any summary quantity computed on a set of values. Descriptive indices or statistics such as the arithmetic average, the median or the mode, are widely used to summarize the information in a series of observations. Historically, these summary descriptors were used for administrative purposes by states, and therefore they were named statistics. In epidemiology, statistics that are commonly seen derive from the comparisons inherent to the nature of epidemiology, which asks questions such as: “Is one population at greater risk of disease than another?” In making such comparisons, the relative risk is a popular measure of the strength of association between an individual characteristic and the probability of becoming ill, and it is most commonly applied in aetiological research; attributable risk is also a measure of association between individual characteristics and disease occurrence, but it emphasizes the gain in terms of number of cases spared by an intervention which removes the factor in question—it is mostly applied in public health and preventive medicine.
The second meaning of the word statistics relates to the collection of techniques and the underlying theory of statistical inference. This is a particular form of inductive logic which specifies the rules for obtaining a valid generalization from a particular set of empirical observations. This generalization would be valid provided some assumptions are met. This is the second way in which an uneducated use of statistics can deceive us: in observational epidemiology, it is very difficult to be sure of the assumptions implied by statistical techniques. Therefore, sensitivity analysis and robust estimators should be companions of any correctly conducted data analysis. Final conclusions also should be based on overall knowledge, and they should not rely exclusively on the findings from statistical hypothesis testing.
Definitions
A statistical unit is the element on which the empirical observations are made. It could be a person, a biological specimen or a piece of raw material to be analysed. Usually the statistical units are independently chosen by the researcher, but sometimes more complex designs can be set up. For example, in longitudinal studies, a series of determinations is made on a collection of persons over time; the statistical units in this study are the set of determinations, which are not independent, but structured by their respective connections to each person being studied. Lack of independence or correlation among statistical units deserves special attention in statistical analysis.
A variable is an individual characteristic measured on a given statistical unit. It should be contrasted with a constant, a fixed individual characteristic—for example, in a study on human beings, having a head or a thorax are constants, while the gender of a single member of the study is a variable.
Variables are evaluated using different scales of measurement. The first distinction is between qualitative and quantitative scales. Qualitative variables provide different modalities or categories. If each modality cannot be ranked or ordered in relation to others—for example, hair colour, or gender modalities—we denote the variable as nominal. If the categories can be ordered—like degree of severity of an illness—the variable is called ordinal. When a variable consists of a numeric value, we say that the scale is quantitative. A discrete scale denotes that the variable can assume only some definite values—for example, integer values for the number of cases of disease. A continuous scale is used for those measures which result in real numbers. Continuous scales are said to be interval scales when the null value has a purely conventional meaning. That is, a value of zero does not mean zero quantity—for example, a temperature of zero degrees Celsius does not mean zero thermal energy. In this instance, only differences among values make sense (this is the reason for the term “interval” scale). A real null value denotes a ratio scale. For a variable measured on that scale, ratios of values also make sense: indeed, a twofold ratio means double the quantity. For example, to say that a body has a temperature two times greater than a second body means that it has two times the thermal energy of the second body, provided that the temperature is measured on a ratio scale (e.g., in Kelvin degrees). The set of permissible values for a given variable is called the domain of the variable.
Statistical Paradigms
Statistics deals with the way to generalize from a set of particular observations. This set of empirical measurements is called a sample. From a sample, we calculate some descriptive statistics in order to summarize the information collected.
The basic information that is generally required in order to characterize a set of measures relates to its central tendency and to its variability. The choice between several alternatives depends on the scale used to measure a phenomenon and on the purposes for which the statistics are computed. In table 1 different measures of central tendency and variability (or, dispersion) are described and associated with the appropriate scale of measurement.
Table 1. Indices of central tendency and dispersion by scale of measurement
|
Scale of measurement |
||||
|
Qualitative |
Quantitative |
|||
|
Indices |
Definition |
Nominal |
Ordinal |
Interval/ratio |
|
Arithmetic mean |
Sum of the observed values divided by the total number of observations |
|
|
x |
|
Median |
Midpoint value of the observed distribution |
|
x |
x |
|
Mode |
Most frequent value |
x |
x |
x |
|
Range |
Lowest and highest values of the distribution |
|
x |
x |
|
Variance |
Sum of the squared difference of each value from the mean divided by the total number of observations minus 1 |
|
|
x |
The descriptive statistics computed are called estimates when we use them as a substitute for the analogous quantity of the population from which the sample has been selected. The population counterparts of the estimates are constants called parameters. Estimates of the same parameter can be obtained using different statistical methods. An estimate should be both valid and precise.
The population-sample paradigm implies that validity can be assured by the way the sample is selected from the population. Random or probabilistic sampling is the usual strategy: if each member of the population has the same probability of being included in the sample, then, on average, our sample should be representative of the population and, moreover, any deviation from our expectation could be explained by chance. The probability of a given deviation from our expectation also can be computed, provided that random sampling has been performed. The same kind of reasoning applies to the estimates calculated for our sample with regard to the population parameters. We take, for example, the arithmetic average from our sample as an estimate of the mean value for the population. Any difference, if it exists, between the sample average and the population mean is attributed to random fluctuations in the process of selection of the members included in the sample. We can calculate the probability of any value of this difference, provided the sample was randomly selected. If the deviation between the sample estimate and the population parameter cannot be explained by chance, the estimate is said to be biased. The design of the observation or experiment provides validity to the estimates and the fundamental statistical paradigm is that of random sampling.
In medicine, a second paradigm is adopted when a comparison among different groups is the aim of the study. A typical example is the controlled clinical trial: a set of patients with similar characteristics is selected on the basis of pre-defined criteria. No concern for representativeness is made at this stage. Each patient enrolled in the trial is assigned by a random procedure to the treatment group—which will receive standard therapy plus the new drug to be evaluated—or to the control group—receiving the standard therapy and a placebo. In this design, the random allocation of the patients to each group replaces the random selection of members of the sample. The estimate of the difference between the two groups can be assessed statistically because, under the hypothesis of no efficacy of the new drug, we can calculate the probability of any non-zero difference.
In epidemiology, we lack the possibility of assembling randomly exposed and non-exposed groups of people. In this case, we still can use statistical methods, as if the groups analysed had been randomly selected or allocated. The correctness of this assumption relies mainly on the study design. This point is particularly important and underscores the importance of epidemiological study design over statistical techniques in biomedical research.
Signal and Noise
The term random variable refers to a variable for which a defined probability is associated with each value it can assume. The theoretical models for the distribution of the probability of a random variable are population models. The sample counterparts are represented by the sample frequency distribution. This is a useful way to report a set of data; it consists of a Cartesian plane with the variable of interest along the horizontal axis and the frequency or relative frequency along the vertical axis. A graphic display allows us to readily see what is (are) the most frequent value(s) and how the distribution is concentrated around certain central values like the arithmetic average.
For the random variables and their probability distributions, we use the terms parameters, mean expected value (instead of arithmetic average) and variance. These theoretical models describe the variability in a given phenomenon. In information theory, the signal is represented by the central tendency (for example, the mean value), while the noise is measured by a dispersion index (such as the variance).
To illustrate statistical inference, we will use the binomial model. In the sections which follow, the concepts of point estimates and confidence intervals, tests of hypotheses and probability of erroneous decisions, and power of a study will be introduced.
Table 2. Possible outcomes of a binomial experiment (yes = 1, no = 0) and their probabilities (n = 3)
|
Worker |
Probability |
||
|
A |
B |
C |
|
|
0 |
0 |
0 |
|
|
1 |
0 |
0 |
|
|
0 |
1 |
0 |
|
|
0 |
0 |
1 |
|
|
0 |
1 |
1 |
|
|
1 |
0 |
1 |
|
|
1 |
1 |
0 |
|
|
1 |
1 |
1 |
|
An Example: The Binomial Distribution
In biomedical research and epidemiology, the most important model of stochastic variation is the binomial distribution. It relies on the fact that most phenomena behave as a nominal variable with only two categories: for example, the presence/absence of disease: alive/dead, or recovered/ill. In such circumstances, we are interested in the probability of success—that is, in the event of interest (e.g., presence of disease, alive or recovery)—and in the factors or variables that can alter it. Let us consider n = 3 workers, and suppose that we are interested in the probability, p, of having a visual impairment (yes/no). The result of our observation could be the possible outcomes in table 2.
Table 3. Possible outcomes of a binomial experiment (yes = 1, no = 0) and their probabilities (n = 3)
|
Number of successes |
Probability |
|
0 |
|
|
1 |
|
|
2 |
|
|
3 |
|
The probability of any of these event combinations is easily obtained by considering p, the (individual) probability of success, constant for each subject and independent from other outcomes. Since we are interested in the total number of successes and not in a specific ordered sequence, we can rearrange the table as follows (see table 3) and, in general, express the probability of x successes P(x) as:
![]()
where x is the number of successes and the notation x! denotes the factorial of x, i.e., x! = x×(x–1)×(x–2)…×1.
When we consider the event “being/not being ill”, the individual probability, ![]() refers to the state in which the subject is presumed; in epidemiology, this probability is called “prevalence”. To estimate p, we use the sample proportion:
refers to the state in which the subject is presumed; in epidemiology, this probability is called “prevalence”. To estimate p, we use the sample proportion:
p = x/n
with variance:
![]()
In an hypothetical infinite series of replicated samples of the same size n, we would obtain different sample proportions p = x/n, with probabilities given by the binomial formula. The “true” value of ![]() is estimated by each sample proportion, and a confidence interval for p, that is, the set of likely values for p, given the observed data and a pre-defined level of confidence (say 95%), is estimated from the binomial distribution as the set of values for p which gives a probability of x greater than a pre-specified value (say 2.5%). For a hypothetical experiment in which we observed x = 15 successes in n = 30 trials, the estimated probability of success is:
is estimated by each sample proportion, and a confidence interval for p, that is, the set of likely values for p, given the observed data and a pre-defined level of confidence (say 95%), is estimated from the binomial distribution as the set of values for p which gives a probability of x greater than a pre-specified value (say 2.5%). For a hypothetical experiment in which we observed x = 15 successes in n = 30 trials, the estimated probability of success is:
Table 4. Binomial distribution. Probabilities for different values of ![]() for x = 15 successes in n = 30 trials
for x = 15 successes in n = 30 trials
|
|
Probability |
|
0.200 |
0.0002 |
|
0.300 |
0.0116 |
|
0.334 |
0.025 |
|
0.400 |
0.078 |
|
0.500 |
0.144 |
|
0.600 |
0.078 |
|
0.666 |
0.025 |
|
0.700 |
0.0116 |
The 95% confidence interval for p, obtained from table 4, is 0.334 – 0.666. Each entry of the table shows the probability of x = 15 successes in n = 30 trials computed with the binomial formula; for example, for![]() = 0.30, we obtain from:
= 0.30, we obtain from:
![]()
For n large and p close to 0.5 we can use an approximation based on the Gaussian distribution:
![]()
where za /2 denotes the value of the standard Gaussian distribution for a probability
P (|z| ³ za /2) = a/2;
1 – a being the chosen confidence level. For the example considered,![]() = 15/30 = 0.5; n = 30 and from the standard Gaussian table z0.025 = 1.96. The 95% confidence interval results in the set of values 0.321 – 0.679, obtained by substituting p = 0.5, n = 30, and z0.025 = 1.96 into the above equation for the Gaussian distribution. Note that these values are close to the exact values computed before.
= 15/30 = 0.5; n = 30 and from the standard Gaussian table z0.025 = 1.96. The 95% confidence interval results in the set of values 0.321 – 0.679, obtained by substituting p = 0.5, n = 30, and z0.025 = 1.96 into the above equation for the Gaussian distribution. Note that these values are close to the exact values computed before.
Statistical tests of hypotheses comprise a decision procedure about the value of a population parameter. Suppose, in the previous example, that we want to address the proposition that there is an elevated risk of visual impairment among workers of a given plant. The scientific hypothesis to be tested by our empirical observations then is “there is an elevated risk of visual impairment among workers of a given plant”. Statisticians demonstrate such hypotheses by falsifying the complementary hypothesis “there is no elevation of the risk of visual impairment”. This follows the mathematical demonstration per absurdum and, instead of verifying an assertion, empirical evidence is used only to falsify it. The statistical hypothesis is called the null hypothesis. The second step involves specifying a value for the parameter of that probability distribution used to model the variability in the observations. In our examples, since the phenomenon is binary (i.e., presence/absence of visual impairment), we choose the binomial distribution with parameter p, the probability of visual impairment. The null hypothesis asserts that![]() = 0.25, say. This value is chosen from the collection of knowledge about the topic and a priori knowledge of the usual prevalence of visual impairment in non-exposed (i.e., non-worker) populations. Suppose our data produced an estimate
= 0.25, say. This value is chosen from the collection of knowledge about the topic and a priori knowledge of the usual prevalence of visual impairment in non-exposed (i.e., non-worker) populations. Suppose our data produced an estimate![]() = 0.50, from the 30 workers examined.
= 0.50, from the 30 workers examined.
Can we reject the null hypothesis?
If yes, in favour of what alternative hypothesis?
We specify an alternative hypothesis as a candidate should the evidence dictate that the null hypothesis be rejected. Non-directional (two-sided) alternative hypotheses state that the population parameter is different from the value stated in the null hypothesis; directional (one-sided) alternative hypotheses state that the population parameter is greater (or lesser) than the null value.
Table 5. Binomial distribution. Probabilities of success for ![]() = 0.25 in n = 30 trials
= 0.25 in n = 30 trials
|
X |
Probability |
Cumulative probability |
|
0 |
0.0002 |
0.0002 |
|
1 |
0.0018 |
0.0020 |
|
2 |
0.0086 |
0.0106 |
|
3 |
0.0269 |
0.0374 |
|
4 |
0.0604 |
0.0979 |
|
5 |
0.1047 |
0.2026 |
|
6 |
0.1455 |
0.3481 |
|
7 |
0.1662 |
0.5143 |
|
8 |
0.1593 |
0.6736 |
|
9 |
0.1298 |
0.8034 |
|
10 |
0.0909 |
0.8943 |
|
11 |
0.0551 |
0.9493 |
|
12 |
0.0291 |
0.9784 |
|
13 |
0.0134 |
0.9918 |
|
14 |
0.0054 |
0.9973 |
|
15 |
0.0019 |
0.9992 |
|
16 |
0.0006 |
0.9998 |
|
17 |
0.0002 |
1.0000 |
|
. |
. |
. |
|
30 |
0.0000 |
1.0000 |
Under the null hypothesis, we can calculate the probability distribution of the results of our example. Table 5 shows, for![]() = 0.25 and n = 30, the probabilities (see equation (1)) and the cumulative probabilities:
= 0.25 and n = 30, the probabilities (see equation (1)) and the cumulative probabilities:
![]()
From this table, we obtain the probability of having x ³15 workers with visual impairment
P(x ³15) = 1 – P(x <15) = 1 – 0.9992 = 0.0008
This means that it is highly improbable that we would observe 15 or more workers with visual impairment if they experienced the prevalence of disease of the non-exposed populations. Therefore, we could reject the null hypothesis and affirm that there is a higher prevalence of visual impairment in the population of workers that was studied.
When n×p ³ 5 and n×(1-![]() ) ³ 5, we can use the Gaussian approximation:
) ³ 5, we can use the Gaussian approximation:

From the table of the standard Gaussian distribution we obtain:
P(|z|>2.95) = 0.0008
in close agreement with the exact results. From this approximation we can see that the basic structure of a statistical test of hypothesis consists of the ratio of signal to noise. In our case, the signal is (p–![]() ), the observed deviation from the null hypothesis, while the noise is the standard deviation of P:
), the observed deviation from the null hypothesis, while the noise is the standard deviation of P:
![]()
The greater the ratio, the lesser the probability of the null value![]() .
.
In making decisions about statistical hypotheses, we can incur two kinds of errors: a type I error, rejection of the null hypothesis when it is true; or a type II error, acceptance of the null hypothesis when it is false. The probability level, or p-value, is the probability of a type I error, denoted by the Greek letter a. This is calculated from the probability distribution of the observations under the null hypothesis. It is customary to predefine an a-error level (e.g., 5%, 1%) and reject the null hypothesis when the result of our observation has a probability equal to or less than this so-called critical level.
The probability of a type II error is denoted by the Greek letter β. To calculate it, we need to specify, in the alternative hypothesis, α value for the parameter to be tested (in our example, α value for![]() ). Generic alternative hypotheses (different from, greater than, less than) are not useful. In practice, the β-value for a set of alternative hypotheses is of interest, or its complement, which is called the statistical power of the test. For example, fixing the α-error value at 5%, from table 5, we find:
). Generic alternative hypotheses (different from, greater than, less than) are not useful. In practice, the β-value for a set of alternative hypotheses is of interest, or its complement, which is called the statistical power of the test. For example, fixing the α-error value at 5%, from table 5, we find:
P(x ³12) <0.05
under the null hypothesis![]() = 0.25. If we were to observe at least x = 12 successes, we would reject the null hypothesis. The corresponding β values and the power for x = 12 are given by table 6.
= 0.25. If we were to observe at least x = 12 successes, we would reject the null hypothesis. The corresponding β values and the power for x = 12 are given by table 6.
Table 6. Type II error and power for x = 12, n = 30, α = 0.05
|
|
β |
Power |
|
0.30 |
0.9155 |
0.0845 |
|
0.35 |
0.7802 |
0.2198 |
|
0.40 |
0.5785 |
0.4215 |
|
0.45 |
0.3592 |
0.6408 |
|
0.50 |
0.1808 |
0.8192 |
|
0.55 |
0.0714 |
0.9286 |
In this case our data cannot discriminate whether![]() is greater than the null value of 0.25 but less than 0.50, because the power of the study is too low (<80%) for those values of
is greater than the null value of 0.25 but less than 0.50, because the power of the study is too low (<80%) for those values of![]() <0.50—that is, the sensitivity of our study is 8% for
<0.50—that is, the sensitivity of our study is 8% for![]() = 0.3, 22% for
= 0.3, 22% for![]() = 0.35,…, 64% for
= 0.35,…, 64% for![]() = 0.45.
= 0.45.
The only way to achieve a lower β, or a higher level of power, would be to increase the size of the study. For example, in table 7 we report β and power for n = 40; as expected, we should be able to detect a ![]() value greater than 0.40.
value greater than 0.40.
Table 7. Type II error and power for x = 12, n = 40, α = 0.05
|
|
β |
Power |
|
0.30 |
0.5772 |
0.4228 |
|
0.35 |
0.3143 |
0.6857 |
|
0.40 |
0.1285 |
0.8715 |
|
0.45 |
0.0386 |
0.8614 |
|
0.50 |
0.0083 |
0.9917 |
|
0.55 |
0.0012 |
0.9988 |
Study design is based on careful scrutiny of the set of alternative hypotheses which deserve consideration and guarantee power to the study providing an adequate sample size.
In the epidemiological literature, the relevance of providing reliable risk estimates has been emphasized. Therefore, it is more important to report confidence intervals (either 95% or 90%) than a p-value of a test of a hypothesis. Following the same kind of reasoning, attention should be given to the interpretation of results from small-sized studies: because of low power, even intermediate effects could be undetected and, on the other hand, effects of great magnitude might not be replicated subsequently.
Advanced Methods
The degree of complexity of the statistical methods used in the occupational medicine context has been growing over the last few years. Major developments can be found in the area of statistical modelling. The Nelder and Wedderburn family of non-Gaussian models (Generalized Linear Models) has been one of the most striking contributions to the increase of knowledge in areas such as occupational epidemiology, where the relevant response variables are binary (e.g., survival/death) or counts (e.g., number of industrial accidents).
This was the starting point for an extensive application of regression models as an alternative to the more traditional types of analysis based on contingency tables (simple and stratified analysis). Poisson, Cox and logistic regression are now routinely used for the analysis of longitudinal and case-control studies, respectively. These models are the counterpart of linear regression for categorical response variables and have the elegant feature of providing directly the relevant epidemiological measure of association. For example, the coefficients of Poisson regression are the logarithm of the rate ratios, while those of logistic regression are the log of the odds ratios.
Taking this as a benchmark, further developments in the area of statistical modelling have taken two main directions: models for repeated categorical measures and models which extend the Generalized Linear Models (Generalized Additive Models). In both instances, the aims are focused on increasing the flexibility of the statistical tools in order to cope with more complex problems arising from reality. Repeated measures models are needed in many occupational studies where the units of analysis are at the sub-individual level. For example:
- The study of the effect of working conditions on carpal tunnel syndrome has to consider both hands of a person, which are not independent from one other.
- The analysis of time trends of environmental pollutants and their effect on children’s respiratory systems can be evaluated using extremely flexible models since the exact functional form of the dose-response relationship is difficult to obtain.
A parallel and probably faster development has been seen in the context of Bayesian statistics. The practical barrier of using Bayesian methods collapsed after the introduction of computer-intensive methods. Monte Carlo procedures such as Gibbs sampling schemes have allowed us to avoid the need for numerical integration for computing the posterior distributions which represented the most challenging feature of Bayesian methods. The number of applications of Bayesian models in real and complex problems have found increasing space in applied journals. For example, geographical analyses and ecological correlations at the small area level and AIDS prediction models are more and more often tackled using Bayesian approaches. These developments are welcomed because they represent not only an increase in the number of alternative statistical solutions which could be employed in the analysis of epidemiological data, but also because the Bayesian approach can be considered a more sound strategy.
Impact of Random Measurement Error
Errors in exposure measurement may have different impacts on the exposure-disease relationship being studied, depending on how the errors are distributed. If an epidemiological study has been conducted blindly (i.e., measurements have been taken with no knowledge of the disease or health status of the study participants) we expect that measurement error will be evenly distributed across the strata of disease or health status.
Table 1 provides an example: suppose we recruit a cohort of people exposed at work to a toxicant, in order to investigate a frequent disease. We determine the exposure status only at recruitment (T0), and not at any further points in time during follow-up. However, let us say that a number of individuals do, in fact, change their exposure status in the following year: at time T1, 250 of the original 1,200 exposed people have ceased being exposed, while 150 of the original 750 non-exposed people have started to be exposed to the toxicant. Therefore, at time T1, 1,100 individuals are exposed and 850 are not exposed. As a consequence, we have “misclassification” of exposure, based on our initial measurement of exposure status at time T0. These individuals are then traced after 20 years (at time T2) and the cumulative risk of disease is evaluated. (The assumption being made in the example is that only exposure of more than one year is a concern.)
Table 1. Hypothetical cohort of 1950 individuals (exposed and unexposed at work), recruited at time T0 and whose disease status is ascertained at time T2
|
Time |
|||
|
T0 |
T1 |
T2 |
|
Exposed workers 1200 250 quit exposure 1100 (1200-250+150)
Cases of disease at time T2 = 220 among exposed workers
Non-exposed workers 750 150 start exposure 850 (750-150+250)
Cases of disease at time T2 = 85 among non-exposed workers
The true risk of disease at time T2 is 20% among exposed workers (220/1100),
and 10% in non-exposed workers (85/850) (risk ratio = 2.0).
Estimated risk at T2 of disease among those classified as exposed at T0: 20%
(i.e., true risk in those exposed) ´ 950 (i.e., 1200-250)+ 10%
(i.e., true risk in non-exposed) ´ 250 = (190+25)/1200 = 17.9%
Estimated risk at T2 of disease among those classified as non-exposed at
T0: 20% (i.e., true risk in those exposed) ´ 150 +10%
(i.e., true risk innon-exposed) ´ 600 (i.e., 750-150) = (30+60)/750 = 12%
Estimated risk ratio = 17.9% / 12% = 1.49
Misclassification depends, in this example, on the study design and the characteristics of the population, rather than on technical limitations of the exposure measurement. The effect of misclassification is such that the “true” ratio of 2.0 between the cumulative risk among exposed people and non-exposed people becomes an “observed” ratio of 1.49 (table 1). This underestimation of the risk ratio arises from a “blurring” of the relationship between exposure and disease, which occurs when the misclassification of exposure, as in this case, is evenly distributed according to the disease or health status (i.e., the exposure measurement is not influenced by whether or not the person suffered from the disease that we are studying).
By contrast, either underestimation or overestimation of the association of interest may occur when exposure misclassification is not evenly distributed across the outcome of interest. In the example, we may have bias, and not only a blurring of the aetiologic relationship, if classification of exposure depends on the disease or health status among the workers. This could arise, for example, if we decide to collect biological samples from a group of exposed workers and from a group of unexposed workers, in order to identify early changes related to exposure at work. Samples from the exposed workers might then be analysed in a more accurate way than samples from those unexposed; scientific curiosity might lead the researcher to measure additional biomarkers among the exposed people (including, e.g., DNA adducts in lymphocytes or urinary markers of oxidative damage to DNA), on the assumption that these people are scientifically “more interesting”. This is a rather common attitude which, however, could lead to serious bias.
Validity Issues in Study Design
The Need for Validity
Epidemiology aims at providing an understanding of the disease experience in populations. In particular, it can be used to obtain insight into the occupational causes of ill health. This knowledge comes from studies conducted on groups of people having a disease by comparing them to people without that disease. Another approach is to examine what diseases people who work in certain jobs with particular exposures acquire and to compare these disease patterns to those of people not similarly exposed. These studies provide estimates of risk of disease for specific exposures. For information from such studies to be used for establishing prevention programmes, for the recognition of occupational diseases, and for those workers affected by exposures to be appropriately compensated, these studies must be valid.
Validity can be defined as the ability of a study to reflect the true state of affairs. A valid study is therefore one which measures correctly the association (either positive, negative or absent) between an exposure and a disease. It describes the direction and magnitude of a true risk. Two types of validity are distinguished: internal and external validity. Internal validity is a study’s ability to reflect what really happened among the study subjects; external validity reflects what could occur in the population.
Validity relates to the truthfulness of a measurement. Validity must be distinguished from precision of the measurement, which is a function of the size of the study and the efficiency of the study design.
Internal Validity
A study is said to be internally valid when it is free from biases and therefore truly reflects the association between exposure and disease which exists among the study participants. An observed risk of disease in association with an exposure may indeed result from a real association and therefore be valid, but it may also reflect the influence of biases. A bias will give a distorted image of reality.
Three major types of biases, also called systematic errors, are usually distinguished:
- selection bias
- information or observation bias
- confounding
They will be presented briefly below, using examples from the occupational health setting.
Selection bias
Selection bias will occur when the entry into the study is influenced by knowledge of the exposure status of the potential study participant. This problem is therefore encountered only when the disease has already taken place by the time (before) the person enters the study. Typically, in the epidemiological setting, this will happen in case-control studies or in retrospective cohort studies. This means that a person will be more likely to be considered a case if it is known that he or she has been exposed. Three sets of circumstances may lead to such an event, which will also depend on the severity of the disease.
Self-selection bias
This can occur when people who know they have been exposed to known or believed harmful products in the past and who are convinced their disease is the result of the exposure will consult a physician for symptoms which other people, not so exposed, might have ignored. This is particularly likely to happen for diseases which have few noticeable symptoms. An example may be early pregnancy loss or spontaneous abortion among female nurses handling drugs used for cancer treatment. These women are more aware than most of reproductive physiology and, by being concerned about their ability to have children, may be more likely to recognize or label as a spontaneous abortion what other women would only consider as a delay in the onset of menstruation. Another example from a retrospective cohort study, cited by Rothman (1986), involves a Centers for Disease Control study of leukaemia among troops who had been present during a US atomic test in Nevada. Of the troops present on the test site, 76% were traced and constituted the cohort. Of these, 82% were found by the investigators, but an additional 18% contacted the investigators themselves after hearing publicity about the study. Four cases of leukaemia were present among the 82% traced by CDC and four cases were present among the self-referred 18%. This strongly suggests that the investigators’ ability to identify exposed persons was linked to leukaemia risk.
Diagnostic bias
This will occur when the doctors are more likely to diagnose a given disease once they know to what the patient has been previously exposed. For example, when most paints were lead-based, a symptom of disease of the peripheral nerves called peripheral neuritis with paralysis was also known as painters’ “wrist drop”. Knowing the occupation of the patient made it easier to diagnose the disease even in its early stages, whereas the identification of the causal agent would be much more difficult in research participants not known to be occupationally exposed to lead.
Bias resulting from refusal to participate in a study
When people, either healthy or sick, are asked to participate in a study, several factors play a role in determining whether or not they will agree. Willingness to answer variably lengthy questionnaires, which at times inquire about sensitive issues, and even more so to give blood or other biological samples, may be determined by the degree of self-interest held by the person. Someone who is aware of past potential exposure may be ready to comply with this inquiry in the hope that it will help to find the cause of the disease, whereas someone who considers that they have not been exposed to anything dangerous, or who is not interested in knowing, may decline the invitation to participate in the study. This can lead to a selection of those people who will finally be the study participants as compared to all those who might have been.
Information bias
This is also called observation bias and concerns disease outcome in follow-up studies and exposure assessment in case-control studies.
Differential outcome assessment in prospective follow-up (cohort) studies
Two groups are defined at the start of the study: an exposed group and an unexposed group. Problems of diagnostic bias will arise if the search for cases differs between these two groups. For example, consider a cohort of people exposed to an accidental release of dioxin in a given industry. For the highly exposed group, an active follow-up system is set up with medical examinations and biological monitoring at regular intervals, whereas the rest of the working population receives only routine care. It is highly likely that more disease will be identified in the group under close surveillance, which would lead to a potential over-estimation of risk.
Differential losses in retrospective cohort studies
The reverse mechanism to that described in the preceding paragraph may occur in retrospective cohort studies. In these studies, the usual way of proceeding is to start with the files of all the people who have been employed in a given industry in the past, and to assess disease or mortality subsequent to employment. Unfortunately, in almost all studies files are incomplete, and the fact that a person is missing may be related either to exposure status or to disease status or to both. For example, in a recent study conducted in the chemical industry in workers exposed to aromatic amines, eight tumours were found in a group of 777 workers who had undergone cytological screening for urinary tumours. Altogether, only 34 records were found missing, corresponding to a 4.4% loss from the exposure assessment file, but for bladder cancer cases, exposure data were missing for two cases out of eight, or 25%. This shows that the files of people who became cases were more likely to become lost than the files of other workers. This may occur because of more frequent job changes within the company (which may be linked to exposure effects), resignation, dismissal or mere chance.
Differential assessment of exposure in case-control studies
In case-control studies, the disease has already occurred at the start of the study, and information will be sought on exposures in the past. Bias may result either from the interviewer’s or study participant’s attitude to the investigation. Information is usually collected by trained interviewers who may or may not be aware of the hypothesis underlying the research. For example, in a population-based case-control study of bladder cancer conducted in a highly industrialized region, study staff may well be aware of the fact that certain chemicals, such as aromatic amines, are risk factors for bladder cancer. If they also know who has developed the disease and who has not, they may be likely to conduct more in-depth interviews with the participants who have bladder cancer than with the controls. They may insist on more detailed information of past occupations, searching systematically for exposure to aromatic amines, whereas for controls they may record occupations in a more routine way. The resulting bias is known as exposure suspicion bias.
The participants themselves may also be responsible for such bias. This is called recall bias to distinguish it from interviewer bias. Both have exposure suspicion as the mechanism for the bias. Persons who are sick may suspect an occupational origin to their disease and therefore will try to remember as accurately as possible all the dangerous agents to which they may have been exposed. In the case of handling undefined products, they may be inclined to recall the names of precise chemicals, particularly if a list of suspected products is made available to them. By contrast, controls may be less likely to go through the same thought process.
Confounding
Confounding exists when the association observed between exposure and disease is in part the result of a mixing of the effect of the exposure under study and another factor. Let us say, for example, that we are finding an increased risk of lung cancer among welders. We are tempted to conclude immediately that there is a causal association between exposure to welding fumes and lung cancer. However, we also know that smoking is by far the main risk factor for lung cancer. Therefore, if information is available, we begin checking the smoking status of welders and other study participants. We may find that welders are more likely to smoke than non-welders. In that situation, smoking is known to be associated with lung cancer and, at the same time, in our study smoking is also found to be associated with being a welder. In epidemiological terms, this means that smoking, linked both to lung cancer and to welding, is confounding the association between welding and lung cancer.
Interaction or effect modification
In contrast to all the issues listed above, namely selection, information and confounding, which are biases, interaction is not a bias due to problems in study design or analysis, but reflects reality and its complexity. An example of this phenomenon is the following: exposure to radon is a risk factor for lung cancer, as is smoking. In addition, smoking and radon exposure have different effects on lung cancer risk depending on whether they act together or in isolation. Most of the occupational studies on this topic have been conducted among underground miners and at times have provided conflicting results. Overall, there seem to be arguments in favour of an interaction of smoking and radon exposure in producing lung cancer. This means that lung cancer risk is increased by exposure to radon, even in non-smokers, but that the size of the risk increase from radon is much greater among smokers than among non-smokers. In epidemiological terms, we say that the effect is multiplicative. In contrast to confounding, described above, interaction needs to be carefully analysed and described in the analysis rather than simply controlled, as it reflects what is happening at the biological level and is not merely a consequence of poor study design. Its explanation leads to a more valid interpretation of the findings from a study.
External Validity
This issue can be addressed only after ensuring that internal validity is secured. If we are convinced that the results observed in the study reflect associations which are real, we can ask ourselves whether or not we can extrapolate these results to the larger population from which the study participants themselves were drawn, or even to other populations which are identical or at least very similar. The most common question is whether results obtained for men also apply to women. For years, studies and, in particular, occupational epidemiological investigations have been conducted exclusively among men. Studies among chemists carried out in the 1960s and 1970s in the United States, United Kingdom and Sweden all found increased risks of specific cancers—namely leukaemia, lymphoma and pancreatic cancer. Based on what we knew of the effects of exposure to solvents and some other chemicals, we could already have deduced at the time that laboratory work also entailed carcinogenic risk for women. This in fact was shown to be the case when the first study among women chemists was finally published in the mid-1980s, which found results similar to those among men. It is worth noting that other excess cancers found were tumours of the breast and ovary, traditionally considered as being related only to endogenous factors or reproduction, but for which newly suspected environmental factors such as pesticides may play a role. Much more work needs to be done on occupational determinants of female cancers.
Strategies for a Valid Study
A perfectly valid study can never exist, but it is incumbent upon the researcher to try to avoid, or at least to minimize, as many biases as possible. This can often best be done at the study design stage, but can also be carried out during analysis.
Study design
Selection and information bias can be avoided only through the careful design of an epidemiological study and the scrupulous implementation of all the ensuing day-to-day guidelines, including meticulous attention to quality assurance, for the conduct of the study in field conditions. Confounding may be dealt with either at the design or analysis stage.
Selection
Criteria for considering a participant as a case must be explicitly defined. One cannot, or at least should not, attempt to study ill-defined clinical conditions. A way of minimizing the impact that knowledge of the exposure may have on disease assessment is to include only severe cases which would have been diagnosed irrespective of any information on the history of the patient. In the field of cancer, studies often will be limited to cases with histological proof of the disease to avoid the inclusion of borderline lesions. This also will mean that groups under study are well defined. For example, it is well-known in cancer epidemiology that cancers of different histological types within a given organ may have dissimilar risk factors. If the number of cases is sufficient, it is better to separate adenocarcinoma of the lung from squamous cell carcinoma of the lung. Whatever the final criteria for entry into the study, they should always be clearly defined and described. For example, the exact code of the disease should be indicated using the International Classification of Diseases (ICD) and also, for cancer, the International Classification of Diseases-Oncology (ICD-O).
Efforts should be made once the criteria are specified to maximize participation in the study. The decision to refuse to participate is hardly ever made at random and therefore leads to bias. Studies should first of all be presented to the clinicians who are seeing the patients. Their approval is needed to approach patients, and therefore they will have to be convinced to support the study. One argument that is often persuasive is that the study is in the interest of the public health. However, at this stage it is better not to discuss the exact hypothesis being evaluated in order to avoid unduly influencing the clinicians involved. Physicians should not be asked to take on supplementary duties; it is easier to convince health personnel to lend their support to a study if means are provided by the study investigators to carry out any additional tasks, over and above routine care, necessitated by the study. Interviewers and data abstractors ought to be unaware of the disease status of their patients.
Similar attention should be paid to the information provided to participants. The goal of the study must be described in broad, neutral terms, but must also be convincing and persuasive. It is important that issues of confidentiality and interest for public health be fully understood while avoiding medical jargon. In most settings, use of financial or other incentives is not considered appropriate, although compensation should be provided for any expense a participant may incur. Last, but not least, the general population should be sufficiently scientifically literate to understand the importance of such research. Both the benefits and the risks of participation must be explained to each prospective participant where they need to complete questionnaires and/or to provide biological samples for storage and/or analysis. No coercion should be applied in obtaining prior and fully informed consent. Where studies are exclusively records-based, prior approval of the agencies responsible for ensuring the confidentiality of such records must be secured. In these instances, individual participant consent usually can be waived. Instead, approval of union and government officers will suffice. Epidemiological investigations are not a threat to an individual’s private life, but are a potential aid to improve the health of the population. The approval of an institutional review board (or ethics review committee) will be needed prior to the conduct of a study, and much of what is stated above will be expected by them for their review.
Information
In prospective follow-up studies, means for assessment of the disease or mortality status must be identical for exposed and non-exposed participants. In particular, different sources should not be used, such as only checking in a central mortality register for non-exposed participants and using intensive active surveillance for exposed participants. Similarly, the cause of death must be obtained in strictly comparable ways. This means that if a system is used to gain access to official documents for the unexposed population, which is often the general population, one should never plan to get even more precise information through medical records or interviews on the participants themselves or on their families for the exposed subgroup.
In retrospective cohort studies, efforts should be made to determine how closely the population under study is compared to the population of interest. One should beware of potential differential losses in exposed and non-exposed groups by using various sources concerning the composition of the population. For example, it may be useful to compare payroll lists with union membership lists or other professional listings. Discrepancies must be reconciled and the protocol adopted for the study must be closely followed.
In case-control studies, other options exist to avoid biases. Interviewers, study staff and study participants need not be aware of the precise hypothesis under study. If they do not know the association being tested, they are less likely to try to provide the expected answer. Keeping study personnel in the dark as to the research hypothesis is in fact often very impractical. The interviewer will almost always know the exposures of greatest potential interest as well as who is a case and who is a control. We therefore have to rely on their honesty and also on their training in basic research methodology, which should be a part of their professional background; objectivity is the hallmark at all stages in science.
It is easier not to inform the study participants of the exact object of the research. Good, basic explanations on the need to collect data in order to have a better understanding of health and disease are usually sufficient and will satisfy the needs of ethics review.
Confounding
Confounding is the only bias which can be dealt with either at the study design stage or, provided adequate information is available, at the analysis stage. If, for example, age is considered to be a potential confounder of the association of interest because age is associated with the risk of disease (i.e., cancer becomes more frequent in older age) and also with exposure (conditions of exposure vary with age or with factors related to age such as qualification, job position and duration of employment), several solutions exist. The simplest is to limit the study to a specified age range—for example, enrol only Caucasian men aged 40 to 50. This will provide elements for a simple analysis, but will also have the drawback of limiting the application of the results to a single sex age/racial group. Another solution is matching on age. This means that for each case, a referent of the same age is needed. This is an attractive idea, but one has to keep in mind the possible difficulty of fulfilling this requirement as the number of matching factors increases. In addition, once a factor has been matched on, it becomes impossible to evaluate its role in the occurrence of disease. The last solution is to have sufficient information on potential confounders in the study database in order to check for them in the analysis. This can be done either through a simple stratified analysis, or with more sophisticated tools such as multivariate analysis. However, it should be remembered that analysis will never be able to compensate for a poorly designed or conducted study.
Conclusion
The potential for biases to occur in epidemiological research is long established. This was not too much of a concern when the associations being studied were strong (as is the case for smoking and lung cancer) and therefore some inaccuracy did not cause too severe a problem. However, now that the time has come to evaluate weaker risk factors, the need for better tools becomes paramount. This includes the need for excellent study designs and the possibility of combining the advantages of various traditional designs such as the case-control or cohort studies with more innovative approaches such as case-control studies nested within a cohort. Also, the use of biomarkers may provide the means of obtaining more accurate assessments of current and possibly past exposures, as well as for the early stages of disease.
Measuring Effects of Exposures
Epidemiology involves measuring the occurrence of disease and quantifying associations between diseases and exposures.
Measures of Disease Occurrence
Disease occurrence can be measured by frequencies (counts) but is better described by rates, which are composed of three elements: the number of people affected (numerator), the number of people in the source or base population (i.e., the population at risk) from which the affected persons come, and the time period covered. The denominator of the rate is the total person-time experienced by the source population. Rates allow more informative comparisons between populations of different sizes than counts alone. Risk, the probability of an individual developing disease within a specified time period, is a proportion, ranging from 0 to 1, and is not a rate per se. Attack rate, the proportion of people in a population who are affected within a specified time period, is technically a measure of risk, not a rate.
Disease-specific morbidity includes incidence, which refers to the number of persons who are newly diagnosed with the disease of interest. Prevalence refers to the number of existing cases. Mortality refers to the number of persons who die.
Incidence is defined as the number of newly diagnosed cases within a specified time period, whereas the incidence rate is this number divided by the total person-time experienced by the source population (table 1). For cancer, rates are usually expressed as annual rates per 100,000 people. Rates for other more common diseases may be expressed per a smaller number of people. For example, birth defect rates are usually expressed per 1,000 live births. Cumulative incidence, the proportion of people who become cases within a specified time period, is a measure of average risk for a population.
Table 1. Measures of disease occurrence: Hypothetical population observed for a five-year period
|
Newly diagnosed cases |
10 |
|
Previously diagnosed living cases |
12 |
|
Deaths, all causes* |
5 |
|
Deaths, disease of interest |
3 |
|
Persons in population |
100 |
|
Years observed |
5 |
|
Incidence |
10 persons |
|
Annual incidence rate |
|
|
Point prevalence (at end of year 5) |
(10 + 12 - 3) = 19 persons |
|
Period prevalence (five-year period) |
(10 + 12) = 22 persons |
|
Annual death rate |
|
|
Annual mortality rate |
|
*To simplify the calculations, this example assumes that all deaths occurred at the end of the five-year period so that all 100 persons in the population were alive for the full five years.
Prevalence includes point prevalence, the number of cases of disease at a point in time, and period prevalence, the total number of cases of a disease known to have existed at some time during a specified period.
Mortality, which concerns deaths rather than newly diagnosed cases of disease, reflects factors that cause disease as well as factors related to the quality of medical care, such as screening, access to medical care, and availability of effective treatments. Consequently, hypothesis-generating efforts and aetiological research may be more informative and easier to interpret when based on incidence rather than on mortality data. However, mortality data are often more readily available on large populations than incidence data.
The term death rate is generally accepted to mean the rate for deaths from all causes combined, whereas mortality rate is the rate of death from one specific cause. For a given disease, the case-fatality rate (technically a proportion, not a rate) is the number of persons dying from the disease during a specified time period divided by the number of persons with the disease. The complement of the case-fatality rate is the survival rate. The five-year survival rate is a common benchmark for chronic diseases such as cancer.
The occurrence of a disease may vary across subgroups of the population or over time. A disease measure for an entire population, without consideration of any subgroups, is called a crude rate. For example, an incidence rate for all age groups combined is a crude rate. The rates for the individual age groups are the age-specific rates. To compare two or more populations with different age distributions, age-adjusted (or, age-standardized) rates should be calculated for each population by multiplying each age-specific rate by the per cent of the standard population (e.g., one of the populations under study, the 1970 US population) in that age group, then summing over all age groups to produce an overall age-adjusted rate. Rates can be adjusted for factors other than age, such as race, gender or smoking status, if the category-specific rates are known.
Surveillance and evaluation of descriptive data can provide clues to disease aetiology, identify high-risk subgroups that may be suitable for intervention or screening programmes, and provide data on the effectiveness of such programmes. Sources of information that have been used for surveillance activities include death certificates, medical records, cancer registries, other disease registries (e.g., birth defects registries, end-stage renal disease registries), occupational exposure registries, health or disability insurance records and workmen’s compensation records.
Measures of Association
Epidemiology attempts to identify and quantify factors that influence disease. In the simplest approach, the occurrence of disease among persons exposed to a suspect factor is compared to the occurrence among persons unexposed. The magnitude of an association between exposure and disease can be expressed in either absolute or relative terms. (See also "Case Study: Measures").
Absolute effects are measured by rate differences and risk differences (table 2). A rate difference is one rate minus a second rate. For example, if the incidence rate of leukaemia among workers exposed to benzene is 72 per 100,000 person-years and the rate among non-exposed workers is 12 per 100,000 person-years, then the rate difference is 60 per 100,000 person-years. A risk difference is a difference in risks or cumulative incidence and can range from -1 to 1.
Table 2. Measures of association for a cohort study
|
Cases |
Person-years at risk |
Rate per 100,000 |
|
|
Exposed |
100 |
20,000 |
500 |
|
Unexposed |
200 |
80,000 |
250 |
|
Total |
300 |
100,000 |
300 |
Rate Difference (RD) = 500/100,000 - 250/100,000
= 250/100,000 per year
(146.06/100,000 - 353.94/100,000)*
Rate ratio (or relative risk) (RR) = ![]()
Attributable risk in the exposed (ARe) = 100/20,000 - 200/80,000
= 250/100,000 per year
Attributable risk per cent in the exposed (ARe%) =![]()
Population attributable risk (PAR) = 300/100,000 - 200/80,000
= 50/100,000 per year
Population attributable risk per cent (PAR%) =
![]()
* In parentheses 95% confidence intervals computed using the formulas in the boxes.
Relative effects are based on ratios of rates or risk measures, instead of differences. A rate ratio is the ratio of a rate in one population to the rate in another. The rate ratio has also been called the risk ratio, relative risk, relative rate, and incidence (or mortality) rate ratio. The measure is dimensionless and ranges from 0 to infinity. When the rate in two groups is similar (i.e., there is no effect from the exposure), the rate ratio is equal to unity (1). An exposure that increased risk would yield a rate ratio greater than unity, while a protective factor would yield a ratio between 0 and 1. The excess relative risk is the relative risk minus 1. For example, a relative risk of 1.4 may also be expressed as an excess relative risk of 40%.
In case-control studies (also called case-referent studies), persons with disease are identified (cases) and persons without disease are identified (controls or referents). Past exposures of the two groups are compared. The odds of being an exposed case is compared to the odds of being an exposed control. Complete counts of the source populations of exposed and unexposed persons are not available, so disease rates cannot be calculated. Instead, the exposed cases can be compared to the exposed controls by calculation of relative odds, or the odds ratio (table 3).
Table 3. Measures of association for case-control studies: Exposure to wood dust and adenocarcinoma of the nasal cavity and paranasal sinues
|
Cases |
Controls |
|
|
Exposed |
18 |
55 |
|
Unexposed |
5 |
140 |
|
Total |
23 |
195 |
Relative odds (odds ratio) (OR) = ![]()
Attributable risk per cent in the exposed (![]() ) =
) = ![]()
Population attributable risk per cent (PAR%) = ![]()
where ![]() = proportion of exposed controls = 55/195 = 0.28
= proportion of exposed controls = 55/195 = 0.28
* In parentheses 95% confidence intervals computed using the formulas in the box overleaf.
Source: Adapted from Hayes et al. 1986.
Relative measures of effect are used more frequently than absolute measures to report the strength of an association. Absolute measures, however, may provide a better indication of the public health impact of an association. A small relative increase in a common disease, such as heart disease, may affect more persons (large risk difference) and have more of an impact on public health than a large relative increase (but small absolute difference) in a rare disease, such as angiosarcoma of the liver.
Significance Testing
Testing for statistical significance is often performed on measures of effect to evaluate the likelihood that the effect observed differs from the null hypothesis (i.e., no effect). While many studies, particularly in other areas of biomedical research, may express significance by p-values, epidemiological studies typically present confidence intervals (CI) (also called confidence limits). A 95% confidence interval, for example, is a range of values for the effect measure that includes the estimated measure obtained from the study data and that which has 95% probability of including the true value. Values outside the interval are deemed to be unlikely to include the true measure of effect. If the CI for a rate ratio includes unity, then there is no statistically significant difference between the groups being compared.
Confidence intervals are more informative than p-values alone. A p-value’s size is determined by either or both of two reasons. Either the measure of association (e.g., rate ratio, risk difference) is large or the populations under study are large. For example, a small difference in disease rates observed in a large population may yield a highly significant p-value. The reasons for the large p-value cannot be identified from the p-value alone. Confidence intervals, however, allow us to disentangle the two factors. First, the magnitude of the effect is discernible by the values of the effect measure and the numbers encompassed by the interval. Larger risk ratios, for example, indicate a stronger effect. Second, the size of the population affects the width of the confidence interval. Small populations with statistically unstable estimates generate wider confidence intervals than larger populations.
The level of confidence chosen to express the variability of the results (the “statistical significance”) is arbitrary, but has traditionally been 95%, which corresponds to a p-value of 0.05. A 95% confidence interval has a 95% probability of containing the true measure of the effect. Other levels of confidence, such as 90%, are occasionally used.
Exposures can be dichotomous (e.g., exposed and unexposed), or may involve many levels of exposure. Effect measures (i.e., response) can vary by level of exposure. Evaluating exposure-response relationships is an important part of interpreting epidemiological data. The analogue to exposure-response in animal studies is “dose-response”. If the response increases with exposure level, an association is more likely to be causal than if no trend is observed. Statistical tests to evaluate exposure-response relationships include the Mantel extension test and the chi-square trend test.
Standardization
To take into account factors other than the primary exposure of interest and the disease, measures of association may be standardized through stratification or regression techniques. Stratification means dividing the populations into homogenous groups with respect to the factor (e.g., gender groups, age groups, smoking groups). Risk ratios or odds ratios are calculated for each stratum and overall weighted averages of the risk ratios or odds ratios are calculated. These overall values reflect the association between the primary exposure and disease, adjusted for the stratification factor, i.e., the association with the effects of the stratification factor removed.
A standardized rate ratio (SRR) is the ratio of two standardized rates. In other words, an SRR is a weighted average of stratum-specific rate ratios where the weights for each stratum are the person-time distribution of the non-exposed, or referent, group. SRRs for two or more groups may be compared if the same weights are used. Confidence intervals can be constructed for SRRs as for rate ratios.
The standardized mortality ratio (SMR) is a weighted average of age-specific rate ratios where the weights (e.g., person-time at risk) come from the group under study and the rates come from the referent population, the opposite of the situation in a SRR. The usual referent population is the general population, whose mortality rates may be readily available and based on large numbers and thus are more stable than using rates from a non-exposed cohort or subgroup of the occupational population under study. Using the weights from the cohort instead of the referent population is called indirect standardization. The SMR is the ratio of the observed number of deaths in the cohort to the expected number, based on the rates from the referent population (the ratio is typically multiplied by 100 for presentation). If no association exists, the SMR equals 100. It should be noted that because the rates come from the referent population and the weights come from the study group, two or more SMRs tend not to be comparable. This non-comparability is often forgotten in the interpretation of epidemiological data, and erroneous conclusions can be drawn.
Healthy Worker Effect
It is very common for occupational cohorts to have lower total mortality than the general population, even if the workers are at increased risk for selected causes of death from workplace exposures. This phenomenon, called the healthy worker effect, reflects the fact that any group of employed persons is likely to be healthier, on average, than the general population, which includes workers and persons unable to work due to illnesses and disabilities. The overall mortality rate in the general population tends to be higher than the rate in workers. The effect varies in strength by cause of death. For example, it appears to be less important for cancer in general than for chronic obstructive lung disease. One reason for this is that it is likely that most cancers would not have developed out of any predisposition towards cancer underlying job/career selection at a younger age. The healthy worker effect in a given group of workers tends to diminish over time.
Proportional Mortality
Sometimes a complete tabulation of a cohort (i.e., person-time at risk) is not available and there is information only on the deaths or some subset of deaths experienced by the cohort (e.g., deaths among retirees and active employees, but not among workers who left employment before becoming eligible for a pension). Computation of person-years requires special methods to deal with person-time assessment, including life-table methods. Without total person-time information on all cohort members, regardless of disease status, SMRs and SRRs cannot be calculated. Instead, proportional mortality ratios (PMRs) can be used. A PMR is the ratio of the observed number of deaths due to a specific cause in comparison to the expected number, based on the proportion of total deaths due to the specific cause in the referent population, multiplied by the number of total deaths in the study group, multiplied by 100.
Because the proportion of deaths from all causes combined must equal 1 (PMR=100), some PMRs may appear to be in excess, but are actually artificially inflated due to real deficits in other causes of death. Similarly, some apparent deficits may merely reflect real excesses of other causes of death. For example, if aerial pesticide applicators have a large real excess of deaths due to accidents, the mathematical requirement that the PMR for all causes combined equal 100 may cause some one or other causes of death to appear deficient even if the mortality is excessive. To ameliorate this potential problem, researchers interested primarily in cancer can calculate proportionate cancer mortality ratios (PCMRs). PCMRs compare the observed number of cancer deaths to the number expected based on the proportion of total cancer deaths (rather than all deaths) for the cancer of interest in the referent population multiplied by the total number of cancer deaths in the study group, multiplied by 100. Thus, the PCMR will not be affected by an aberration (excess or deficit) in a non-cancer cause of death, such as accidents, heart disease or non-malignant lung disease.
PMR studies can better be analysed using mortality odds ratios (MORs), in essence analysing the data as if they were from a case-control study. The “controls” are the deaths from a subset of all deaths that are thought to be unrelated to the exposure under study. For example, if the main interest of the study were cancer, mortality odds ratios could be calculated comparing exposure among the cancer deaths to exposure among the cardiovascular deaths. This approach, like the PCMR, avoids the problems with the PMR which arise when a fluctuation in one cause of death affects the apparent risk of another simply because the overall PMR must equal 100. The choice of the control causes of death is critical, however. As mentioned above, they must not be related to the exposure, but the possible relationship between exposure and disease may not be known for many potential control diseases.
Attributable Risk
There are measures available which express the amount of disease that would be attributable to an exposure if the observed association between the exposure and disease were causal. The attributable risk in the exposed (ARe) is the disease rate in the exposed minus the rate in the unexposed. Because disease rates cannot be measured directly in case-control studies, the ARe is calculable only for cohort studies. A related, more intuitive, measure, the attributable risk percent in the exposed (ARe%), can be obtained from either study design. The ARe% is the proportion of cases arising in the exposed population that is attributable to the exposure (see table 2 and table 3 for formula). The ARe% is the rate ratio (or the odds ratio) minus 1, divided by the rate ratio (or odds ratio), multiplied by 100.
The population attributable risk (PAR) and the population attributable risk per cent (PAR%), or aetiological fraction, express the amount of disease in the total population, which is comprised of exposed and unexposed persons, that is due to the exposure if the observed association is causal. The PAR can be obtained from cohort studies (table 28.3 ) and the PAR% can be calculated in both cohort and case-control studies (table 2 and table 3).
Representativeness
There are several measures of risk that have been described. Each assumes underlying methods for counting events and in the representatives of these events to a defined group. When results are compared across studies, an understanding of the methods used is essential for explaining any observed differences.
" DISCLAIMER: The ILO does not take responsibility for content presented on this web portal that is presented in any language other than English, which is the language used for the initial production and peer-review of original content. Certain statistics have not been updated since the production of the 4th edition of the Encyclopaedia (1998)."