- You are here:
-
Home

-
Part IV. Tools and Approaches
-
Record Systems and Surveillance
- Occupational Disease Surveillance and Reporting Systems

32. Record Systems and Surveillance
Chapter Editor: Steven D. Stellman
Table of Contents
Tables and Figures
Occupational Disease Surveillance and Reporting Systems
Steven B. Markowitz
Occupational Hazard Surveillance
David H. Wegman and Steven D. Stellman
Surveillance in Developing Countries
David Koh and Kee-Seng Chia
Development and Application of an Occupational Injury and Illness Classification System
Elyce Biddle
Risk Analysis of Nonfatal Workplace Injuries and Illnesses
John W. Ruser
Case Study: Worker Protection and Statistics on Accidents and Occupational Diseases - HVBG, Germany
Martin Butz and Burkhard Hoffmann
Case Study: Wismut - A Uranium Exposure Revisited
Heinz Otten and Horst Schulz
Measurement Strategies and Techniques for Occupational Exposure Assessment in Epidemiology
Frank Bochmann and Helmut Blome
Case Study: Occupational Health Surveys in China
Tables
Click a link below to view the table in article context.
1. Angiosarcoma of the liver - world register
2. Occupational illness, US, 1986 versus 1992
3. US Deaths from pneumoconiosis & pleural mesothelioma
4. Sample list of notifiable occupational diseases
5. Illness & injury reporting code structure, US
6. Nonfatal occupational injuries & illnesses, US 1993
7. Risk of occupational injuries & illnesses
8. Relative risk for repetitive motion conditions
9. Workplace accidents, Germany, 1981-93
10. Grinders in metalworking accidents, Germany, 1984-93
11. Occupational disease, Germany, 1980-93
12. Infectious diseases, Germany, 1980-93
13. Radiation exposure in the Wismut mines
14. Occupational diseases in Wismut uranium mines 1952-90
Figures
Point to a thumbnail to see figure caption, click to see the figure in article context.


Occupational Disease Surveillance and Reporting Systems
Occupational disease and injury surveillance entails the systematic monitoring of health events in working populations in order to prevent and control occupational hazards and their associated diseases and injuries. Occupational disease and injury surveillance has four essential components (Baker, Melius and Millar 1988; Baker 1986).
- Gather information on cases of occupational diseases and injuries.
- Distil and analyse the data.
- Disseminate organized data to necessary parties, including workers, unions, employers, governmental agencies and the public.
- Intervene on the basis of data to alter the factors that produced these health events.
Surveillance in occupational health has been more concisely described as counting, evaluating and acting (Landrigan 1989).
Surveillance commonly refers to two broad sets of activities in occupational health. Public health surveillance refers to activities undertaken by federal, state or local governments within their respective jurisdictions to monitor and to follow up on occupational diseases and injuries. This type of surveillance is based on a population, that is, the working public. The recorded events are suspected or established diagnoses of occupational illness and injury. This article will examine these activities.
Medical surveillance refers to the application of medical tests and procedures to individual workers who may be at risk for occupational morbidity, to determine whether an occupational disorder may be present. Medical surveillance is generally broad in scope and represents the first step in ascertaining the presence of a work-related problem. If an individual or a population is exposed to a toxin with known effects, and if the tests and procedures are highly targeted to detect the likely presence of one or more effects in these persons, then this surveillance activity is more aptly described as medical screening (Halperin and Frazier 1985). A medical surveillance programme applies tests and procedures on a group of workers with common exposures for the purpose of identifying individuals who may have occupational illnesses and for the purpose of detecting patterns of illness which may be produced by occupational exposures among the programme participants. Such a programme is usually undertaken under the auspices of the individual’s employer or union.
Functions of Occupational Health Surveillance
Foremost among the purposes of occupational health surveillance is to identify the incidence and prevalence of known occupational diseases and injuries. Gathering descriptive epidemiological data on the incidence and prevalence of these diseases on an accurate and comprehensive basis is an essential prerequisite for establishing a rational approach to the control of occupational disease and injury. Assessment of the nature, magnitude and distribution of occupational disease and injury in any geographic area requires a sound epidemiological database. It is only through an epidemiological assessment of the dimensions of occupational disease that its importance relative to other public health problems, its claim for resources and the urgency of legal standard setting can be reasonably evaluated. Second, the collection of incidence and prevalence data allows analysis of trends of occupational disease and injury among different groups, at different places and during different time periods. Detecting such trends is useful for determining control and research priorities and strategies, and for evaluating the effectiveness of any interventions undertaken (Baker, Melius and Millar 1988).
A second broad function of occupational health surveillance is to identify individual cases of occupational disease and injury in order to find and evaluate other individuals from the same workplaces who may be at risk for similar disease and injury. Also, this process permits the initiation of control activities to ameliorate the hazardous conditions associated with causation of the index case (Baker, Melius and Millar 1988; Baker, Honchar and Fine 1989).An index case of occupational disease or injury is defined as the first ill or injured individual from a given workplace to receive medical care and thereby to draw attention to the existence of a workplace hazard and an additional workplace population at risk. A further purpose of case identification may be to assure that the affected individual receives appropriate clinical follow-up, an important consideration in view of the scarcity of clinical occupational medicine specialists (Markowitz et al. 1989; Castorino and Rosenstock 1992).
Finally, occupational health surveillance is an important means of discovering new associations between occupational agents and accompanying diseases, since the potential toxicity of most chemicals used in the workplace is not known. Discovery of rare diseases, patterns of common diseases or suspicious exposure-disease associations through surveillance activities in the workplace can provide vital leads for a more conclusive scientific evaluation of the problem and possible verification of new occupational diseases.
Obstacles to the Recognition of Occupational Diseases
Several important factors undermine the ability of occupational disease surveillance and reporting systems to fulfil the functions cited above. First, recognition of the underlying cause or causes of any illness is the sine qua non for recording and reporting occupational diseases. However, in a traditional medical model that emphasizes symptomatic and curative care, identifying and eliminating the underlying cause of illness may not be a priority. Furthermore, health care providers are often not adequately trained to suspect work as a cause of disease (Rosenstock 1981) and do not routinely obtain histories of occupational exposure from their patients (Institute of Medicine 1988). This should not be surprising, given that in the United States, the average medical student receives only six hours of training in occupational medicine during the four years of medical school (Burstein and Levy 1994).
Certain features characteristic of occupational disease exacerbate the difficulty of recognizing occupational diseases. With few exceptions—most notably, angiosarcoma of the liver, malignant mesothelioma and the pneumoconioses—most diseases that can be caused by occupational exposures also have non-occupational causes. This non-specificity renders difficult the determination of the occupational contribution to disease occurrence. Indeed, the interaction of occupational exposures with other risk factors may greatly increase the risk of disease, as occurs with asbestos exposure and cigarette smoking. For chronic occupational diseases such as cancer and chronic respiratory disease, there usually exists a long period of latency between onset of occupational exposure and presentation of clinical disease. For example, malignant mesothelioma typically has a latency of 35 years or more. A worker so affected may well have retired, further diminishing a physician’s suspicion of possible occupational aetiologies.
Another cause of the widespread under-recognition of occupational disease is that the majority of chemicals in commerce have never been evaluated with regard to their potential toxicity. A study by the National Research Council in the United States in the 1980s found no information available on the toxicity of approximately 80% of the 60,000 chemical substances in commercial use. Even for those groups of substances that are most closely regulated and about which the most information is available—drugs and food additives—reasonably complete information on possibly untoward effects is available for only a minority of agents (NRC 1984).
Workers may have a limited ability to provide an accurate report of their toxic exposures. Despite some improvement in countries such as the United States in the 1980s, many workers are not informed of the hazardous nature of the materials with which they work. Even when such information is provided, recalling the extent of exposure to multiple agents in a variety of jobs over a working career may be difficult. As a result, even health care providers who are motivated to obtain occupational information from their patients may not be able to do so.
Employers may be an excellent source of information regarding occupational exposures and the occurrence of work-related diseases. However, many employers do not have the expertise to assess the extent of exposure in the workplace or to determine whether an illness is work related. In addition, financial disincentives to finding that a disease is occupational in origin may discourage employers from using such information appropriately. The potential conflict of interest between the financial health of the employer and the physical and mental health of the worker represents a major obstacle to improving surveillance of occupational disease.
Registries and other Data Sources Specific for Occupational Diseases
International registries
International registries for occupational diseases are an exciting development in occupational health. The obvious benefit of these registries is the ability to conduct large studies, which would allow determination of the risk of rare diseases. Two such registries for occupational diseases were initiated during the 1980s.
The International Agency for Research on Cancer (IARC) established the International Register of Persons Exposed to Phenoxy Herbicides and Contaminants in 1984 (IARC 1990). As of 1990, it had enrolled 18,972 workers from 19 cohorts in ten countries. By definition all enrolees worked in industries involving phenoxy herbicides and/or chlorophenols, principally in manufacturing/formulating industries or as applicators. Exposure estimates have been made for participating cohorts (Kauppinen et al. 1993), but analyses of cancer incidence and mortality have not yet been published.
An international registry of cases of angiosarcoma of the liver (ASL) is being coordinated by Bennett of ICI Chemicals and Polymers Limited in England. Occupational exposure to vinyl chloride is the only known cause of angiosarcoma of the liver. Cases are reported by a voluntary group of scientists from companies producing vinyl chloride, governmental agencies and universities. As of 1990, 157 cases of ASL with dates of diagnosis between 1951 and 1990 were reported to the registry from 11 countries or regions. Table 1 also shows that most of the recorded cases were reported from countries where facilities started polyvinyl chloride manufacture before 1950. The registry has recorded six clusters of ten or more cases of ASL at facilities in North America and Europe (Bennett 1990).
Table 1. Number of cases of angiosarcoma of the liver in the world register by country and year of first production of vinyl chloride
|
Country/Region |
Number of PVC |
Year PVC production initiated |
Number of cases |
|
USA |
50 |
(1939?) |
39 |
|
Canada |
5 |
(1943) |
13 |
|
West Germany |
10 |
(1931) |
37 |
|
France |
8 |
(1939) |
28 |
|
United Kingdom |
7 |
(1940) |
16 |
|
Other Western Europe |
28 |
(1938) |
15 |
|
Eastern Europe |
23 |
(pre-1939) |
6 |
|
Japan |
36 |
(1950) |
3 |
|
Central and |
22 |
(1953) |
0 |
|
Australia |
3 |
(1950s) |
0 |
|
Middle East |
1 |
(1987) |
0 |
|
Total |
193 |
157 |
Source: Bennett, B. World Register of Cases of Angiosarcoma of the Liver (ASL)
due to Vinyl Chloride Monomer, January 1, 1990.
Governmental surveys
Employers are sometimes legally required to record occupational injuries and illnesses that occur in their facilities. Like other workplace-based information, such as numbers of employees, wages and overtime, injury and illness data may be systematically collected by governmental agencies for the purpose of surveillance of work-related health outcomes.
In the United States, the Bureau of Labor Statistics (BLS) of the US Department of Labor has conducted the Annual Survey of Occupational Injuries and Illnesses (BLS Annual Survey) since 1972 as required by the Occupational Safety and Health Act (BLS 1993b). The goal of the survey is to obtain the numbers and the rates of illnesses and injuries recorded by private employers as being occupational in origin (BLS 1986). The BLS Annual Survey excludes employees of farms with fewer than 11 employees, the self-employed and employees of the federal, state and local governments. For the most recent year available, 1992, the survey reflects questionnaire data obtained from a stratified random sample of approximately 250,000 establishments in the private sector in the United States (BLS 1994).
The BLS survey questionnaire completed by the employer is derived from a written record of occupational injuries and illnesses which employers are required to maintain by the Occupational Safety and Health Administration (OSHA 200 Log). Although OSHA mandates that the employer keep the 200 Log for examination by an OSHA inspector upon request, it does not require that employers routinely report the log’s contents to OSHA, except for the sample of employers included in the BLS Annual Survey (BLS 1986).
Some well-recognized weaknesses severely limit the ability of the BLS survey to provide a full and accurate count of occupational illnesses in the United States (Pollack and Keimig 1987). Data are employer derived. Any illness that the employee does not report to the employer as being work related will not be reported by the employer on the annual survey. Among active workers, such a failure to report may be due to fear of consequences to the employee. Another major obstacle to reporting is the failure of the employee’s physician to diagnose illness as being work related, especially for chronic diseases. Occupational diseases occurring among retired workers are not subject to the BLS reporting requirement. Indeed, it is unlikely that the employer would be aware of the onset of a work-related illness in a retiree. Since many cases of chronic occupational illnesses with long latency, including cancer and lung disease, are likely to have their onset following retirement, a large proportion of such cases would not be included in the data collected by the BLS. These limitations were recognized by BLS in a recent report on its annual survey (BLS 1993a). In response to recommendations by the National Academy of Sciences, the BLS re-designed and implemented a new annual survey in 1992.
According to the 1992 BLS Annual Survey, there were 457,400 occupational illnesses in private industry in the United States (BLS 1994). This represented a 24% increase, or 89,100 cases, over the 368,300 illnesses recorded in the 1991 BLS Annual Survey. The incidence of new occupational illnesses was 60.0 per 10,000 workers in 1992.
Disorders associated with repeated trauma, such as carpal tunnel syndrome, tendonitis of the wrist and elbow and hearing loss, dominate the occupational illnesses recorded in the BLS Annual survey and have done so since 1987 (table 2). In 1992, they accounted for 62% of all illness cases recorded on the annual survey. Other important categories of disease were skin disorders, pulmonary diseases and disorders associated with physical trauma.
Table 2. Number of new cases of occupational illness by category of illness-US Bureau of Labor Statistics Annual Survey, 1986 versus 1992.
|
Category of Illness |
1986 |
1992 |
% Change 1986–1992 |
|
Skin diseases |
41,900 |
62,900 |
+ 50.1% |
|
Dust diseases of the lungs |
3,200 |
2,800 |
– 12.5% |
|
Respiratory conditions due to toxic agents |
12,300 |
23,500 |
+ 91.1% |
|
Poisonings |
4,300 |
7,000 |
+ 62.8% |
|
Disorders due to physical agents |
9,200 |
22,200 |
+141.3% |
|
Disorders associated with repeated trauma |
45,500 |
281,800 |
+519.3% |
|
All other occupational illnesses |
20,400 |
57,300 |
+180.9% |
|
Total |
136,900 |
457,400 |
+234.4% |
|
Total excluding repeated trauma |
91,300 |
175,600 |
+ 92.3% |
|
Average annual employment in the private sector, United States |
83,291,200 |
90,459,600 |
+ 8.7% |
Sources: Occupational Injuries and Illnesses in the United States by Industry, 1991.
US Department of Labor, Bureau of Labor Statistics, May 1993. Unpublished data,
US Department of Labor, Bureau of Labor Statistics, December, 1994.
Although disorders associated with repeated trauma clearly account for the largest proportion of the increase in cases of occupational illness, there was also a 50% increase in the recorded incidence in occupational illnesses other than those due to repeated trauma in the six years between 1986 and 1992, during which employment in the United States rose by just 8.7%.
These increases in the numbers and rates of occupational diseases recorded by employers and reported to the BLS in recent years in the United States are remarkable. The rapid change in the recording of occupational illnesses in the United States is due to a change in the underlying occurrence of disease and to a change in the recognition and reporting of these conditions. By comparison, during the same time period, 1986 to 1991, the rate of occupational injuries per 100 full-time workers recorded by the BLS went from 7.7 in 1986 to 7.9 in 1991, a mere 2.6% increase. The number of recorded fatalities in the workplace has likewise not increased dramatically in the first half of the 1990s.
Employer-based surveillance
Apart from the BLS survey, many US employers conduct medical surveillance of their workforces and thereby generate a vast amount of medical information that is relevant to the surveillance of occupational diseases. These surveillance programmes are undertaken for numerous purposes: to comply with OSHA regulations; to maintain a healthy workforce through the detection and treatment of non-occupational disorders; to ensure that the employee is fit to perform the tasks of the job, including the need to wear a respirator; and to conduct epidemiological surveillance to uncover patterns of exposure and disease. These activities utilize considerable resources and could potentially make a major contribution to the public health surveillance of occupational diseases. However, since these data are non-uniform, of uncertain quality and largely inaccessible outside the companies in which they are collected, their exploitation in occupational health surveillance has been realized on only a limited basis (Baker, Melius and Millar 1988).
OSHA also requires that employers perform selected medical surveillance tests for workers exposed to a limited number of toxic agents. Additionally, for fourteen well-recognized bladder and lung carcinogens, OSHA requires a physical examination and occupational and medical histories. The data collected under these OSHA provisions are not routinely reported to governmental agencies or other centralized data banks and are not accessible for the purposes of occupational disease reporting systems.
Surveillance of public employees
Occupational disease reporting systems may differ for public versus private employees. For example, in the United States, the annual survey of occupational illnesses and injuries conducted by the federal Department of Labor (BLS Annual Survey) excludes public employees. Such workers are, however, an important part of the workforce, representing approximately 17% (18.4 million workers) of the total workforce in 1991. Over three-fourths of these workers are employed by state and local governments.
In the United States, data on occupational illnesses among federal employees are collected by the Federal Occupational Workers’ Compensation Program. In 1993, there were 15,500 occupational disease awards to federal workers, yielding a rate of 51.7 cases of occupational illnesses per 10,000 full-time workers (Slighter 1994). At the state and local levels, the rates and numbers of illnesses due to occupation are available for selected states. A recent study of state and local employees in New Jersey, a sizeable industrial state, documented 1,700 occupational illnesses among state and local employees in 1990, yielding an incidence of 50 per 10,000 public-sector workers (Roche 1993). Notably, the rates of occupational disease among federal and non-federal public workers are remarkably congruent with the rates of such illness among private sector workers as recorded in the BLS Annual Survey. The distribution of illness by type differs for public versus private workers, a consequence of the different type of work that each sector performs.
Workers’ compensation reports
Workers’ compensation systems provide an intuitively appealing surveillance tool in occupational health, because the determination of work-relatedness of disease in such cases has presumably undergone expert review. Health conditions that are acute and easily recognized in origin are frequently recorded by workers’ compensation systems. Examples include poisonings, acute inhalation of respiratory toxins and dermatitis.
Unfortunately, the use of workers’ compensation records as a credible source for surveillance data is subject to severe limitations, including lack of standardization of eligibility requirements, deficiency of standard case definitions, disincentives to workers and employers to file claims, the lack of physician recognition of chronic occupational diseases with long latent periods and the usual gap of several years between initial filing and resolution of a claim. The net effect of these limitations is that there is significant under-recording of occupational disease by workers’ compensation systems.
Thus, in a study by Selikoff in the early 1980s, less than one-third of US insulators who were disabled by asbestos-related diseases, including asbestosis and cancer, had even filed for workers’ compensation benefits, and many fewer were successful in their claims (Selikoff 1982). Similarly, a US Department of Labor study of workers who reported disability from occupational disease found that less than 5% of these workers received workers’ compensation benefits (USDOL 1980). A more recent study in the state of New York found that the number of people admitted to hospitals for pneumoconioses vastly outnumbered the people who were newly awarded workers’ compensation benefits during a similar time period (Markowitz et al. 1989). Since workers’ compensation systems record simple health events such as dermatitis and musculoskeletal injuries much more readily than complex diseases of long latency, use of such data leads to a skewed picture of the true incidence and distribution of occupational diseases.
Laboratory reports
Clinical laboratories can be an excellent source of information on excessive levels of selected toxins in body fluids. Advantages of this source are timely reporting, quality-control programmes already in place and the leverage for compliance provided by the licensing of such laboratories by governmental agencies. In the United States, numerous states require that clinical laboratories report the results of selected categories of specimens to the state health departments. Occupational agents subject to this reporting requirement are lead, arsenic, cadmium and mercury as well as substances reflecting pesticide exposure (Markowitz 1992).
In the United States, the National Institute for Occupational Safety and Health (NIOSH) began to assemble the results of adult blood lead testing into the Adult Blood Lead Epidemiology and Surveillance programme in 1992 (Chowdhury, Fowler and Mycroft 1994). By the end of 1993, 20 states, representing 60% of the US population, were reporting elevated blood lead levels to NIOSH, and an additional 10 states were developing the capacity to collect and report blood lead data. In 1993, there were 11,240 adults with blood lead levels that equalled or exceeded 25 micrograms per decilitre of blood in the 20 reporting states. The vast majority of these individuals with elevated blood lead levels (over 90%) were exposed to lead at the workplace. Over one-quarter (3,199) of these individuals had blood leads greater than or equal to 40 ug/dl, the threshold at which the US Occupational Safety and Health Administration requires actions to protect workers from occupational lead exposure.
Reporting of elevated levels of toxins to the state health department may be followed by a public health investigation. Confidential follow-up interviews with affected individuals allows timely identification of the workplaces where exposure occurred, categorization of the case by occupation and industry, estimation of the number of other workers at the workplace potentially exposed to lead and assurance of medical follow-up (Baser and Marion 1990). Worksite visits are followed by recommendations for voluntary actions to reduce exposure or may lead to reporting to authorities with legal enforcement powers.
Physicians’ reports
In an attempt to replicate the strategy successfully utilized for the monitoring and control of infectious diseases, an increasing number of states in the United States require physicians to report one or more occupational diseases (Freund, Seligman and Chorba 1989). As of 1988, 32 states required reporting of occupational diseases, though these included ten states where only one occupational disease is reportable, usually lead or pesticide poisoning. In other states, such as Alaska and Maryland, all occupational diseases are reportable. In most states, reported cases are used only to count the number of people in the state affected by the disease. In only one-third of the states with reportable disease requirements does a report of a case of occupational disease lead to follow-up activities, such as workplace inspection (Muldoon, Wintermeyer and Eure 1987).
Despite the evidence of increased recent interest, physician reporting of occupational diseases to appropriate state governmental authorities is widely acknowledged to be inadequate (Pollack and Keimig 1987; Wegman and Froines 1985). Even in California, where a system for physician reporting has been in place for a number of years (Doctor’s First Report of Occupational Illness and Injury) and recorded nearly 50,000 occupational illnesses in 1988, physician compliance with reporting is regarded as incomplete (BLS 1989).
A promising innovation in occupational health surveillance in the United States is the emergence of the concept of the sentinel provider, part of an initiative undertaken by NIOSH called Sentinel Event Notification System for Occupational Risks (SENSOR). A sentinel provider is a physician or other health care provider or facility that is likely to provide care for workers with occupational disorders due to the provider’s specialty or geographic location.
Since sentinel providers represent a small subset of all health care providers, health departments can feasibly organize an active occupational disease reporting system by performing outreach, offering education and providing timely feedback to sentinel providers. In a recent report from three states participating in the SENSOR programme, physician reports of occupational asthma increased sharply after the state health departments developed concerted educational and outreach programmes to identify and recruit sentinel providers (Matte, Hoffman and Rosenman 1990).
Specialized occupational health clinical facilities
A newly emergent resource for occupational health surveillance has been the development of occupational health clinical centres that are independent of the workplace and that specialize in the diagnosis and treatment of occupational disease. Several dozen such facilities currently exist in the United States. These clinical centres can play several roles in enhancing occupational health surveillance (Welch 1989). First, the clinics can play a primary role in case-finding—that is, identifying occupational sentinel health events—since they represent a unique organizational source of expertise in clinical occupational medicine. Second, the occupational health clinical centres can serve as a laboratory for the development and refinement of surveillance case definitions for occupational disease. Third, the occupational health clinics can serve as a primary clinical referral resource for the diagnosis and evaluation of workers who are employed at a worksite where an index case of occupational disease has been identified.
Occupational health clinics have become organized into a national association in the United States (the Association of Occupational and Environmental Clinics) to enhance their visibility and to collaborate on research and clinical investigations (Welch 1989). In some states, such as New York, a statewide network of clinical centres has been organized by the state health department and receives stable funding from a surcharge on workers’ compensation premiums (Markowitz et al. 1989). The clinical centres in New York State have collaborated in the development of information systems, clinical protocols and professional education and are beginning to generate substantial data on the numbers of cases of occupational disease in the state.
Use of Vital Statistics and Other General Health Data
Death certificates
The death certificate is a potentially very useful instrument for occupational disease surveillance in many countries in the world. Most countries have death registries. Uniformity and comparability is promoted by the common use of the International Classification of Diseases to identify cause of death. Furthermore, many jurisdictions include information on death certificates concerning the occupation and industry of the deceased. A major limitation in the use of death certificates for occupational disease surveillance is the lack of unique relationships between occupational exposures and specific causes of death.
The use of mortality data for occupational disease surveillance is most salient for diseases that are uniquely caused by occupational exposures. These include the pneumoconioses and one type of cancer, malignant mesothelioma of the pleura. Table 3 shows the numbers of deaths attributed to these diagnoses as the underlying cause of death and as one of multiple causes of death listed on the death certificate in the United States. The underlying cause of death is considered the principal cause for death, while the listing of multiple causes includes all conditions considered important in contributing to death.
Table 3. Deaths due to pneumoconiosis and malignant mesothelioma of the pleura. Underlying cause and multiple causes, United States, 1990 and 1991
|
ICD-9 Code |
Cause of death |
Numbers of deaths |
|
|
Underlying cause 1991 |
Multiple causes 1990 |
||
|
500 |
Coal workers’ pneumoconiosis |
693 |
1,990 |
|
501 |
Asbestosis |
269 |
948 |
|
502 |
Silicosis |
153 |
308 |
|
503-505 |
Other pneumoconioses |
122 |
450 |
|
Sub-total |
1,237 |
3,696 |
|
|
163.0, 163.1, and 163.9 |
Malignant mesothelioma pleura |
452 |
553 |
|
Total |
1,689 |
4,249 |
|
Source: United States National Center for Health Statistics.
In 1991, there were 1,237 deaths due to the dust diseases of the lung as the underlying cause, including 693 deaths due to coal workers pneumoconioses and 269 deaths due to asbestosis. For malignant mesothelioma, there was a total of 452 deaths due to pleural mesothelioma. It is not possible to identify the number of deaths due to malignant mesothelioma of the peritoneum, also caused by occupational exposure to asbestos, since International Classification of Disease codes are not specific for malignant mesothelioma of this site.
Table 3 also shows the numbers of deaths in the United States in 1990 due to pneumoconioses and malignant mesothelioma of the pleura when they appear as one of multiple causes of death on the death certificate. For the pneumoconioses, the total where they appear as one of multiple causes is important, since the pneumoconioses often co-exist with other chronic lung diseases.
An important issue is the extent to which pneumoconioses may be under-diagnosed and, therefore, missing from death certificates. The most extensive analysis of the under-diagnosis of a pneumoconiosis has been performed among insulators in the United States and Canada by Selikoff and colleagues (Selikoff, Hammond and Seidman 1979; Selikoff and Seidman 1991). Between 1977 and 1986, there were 123 insulator deaths ascribed to asbestosis on the death certificates. When investigators reviewed medical records, chest radiographs and tissue pathology where available, they ascribed 259 of insulator deaths occurring in these years to asbestosis. Over one-half of pneumoconiosis deaths were, thus, missed in this group well-known to have heavy asbestos exposure. Unfortunately, there are not a sufficient number of other studies of the under-diagnosis of pneumoconioses on death certificates to allow a reliable correction of mortality statistics.
Deaths due to causes that are not specific to occupational exposures have also been used as part of occupational disease surveillance when occupation or industry of decedents is recorded on the death certificates. Analysis of these data in a specified geographical area during a selected time period can yield rates and ratios of disease by cause for different occupations and industries. The role of non-occupational factors in the deaths examined cannot be defined by this approach. However, differences in rates of disease in different occupations and industries suggest that occupational factors may be important and provide leads for more detailed studies. Other advantages of this approach include the ability to study occupations that are usually distributed among many workplaces (e.g., cooks or dry cleaner workers), the use of routinely collected data, a large sample size, relatively low expense and an important health outcome (Baker, Melius and Millar 1988; Dubrow, Sestito and Lalich 1987; Melius, Sestito and Seligman 1989).
Such occupational mortality studies have been published over the past several decades in Canada (Gallagher et al. 1989), Great Britain (Registrar General 1986), and the United States (Guralnick 1962, 1963a and 1963b). In recent years, Milham utilized this approach to examine the occupational distribution of all men who died between 1950 and 1979 in the state of Washington in the United States. He compared the proportion of all deaths due to any specific cause for one occupational group with the relevant proportion for all occupations. Proportional mortality ratios are thereby obtained (Milham 1983). As an example of the yield of this approach, Milham noted that 10 of 11 occupations with probable exposure to electrical and magnetic fields showed an elevation in the proportional mortality ratio for leukaemia (Milham 1982). This was one of the first studies of the relationship between occupational exposure to electro-magnetic radiation and cancer and has been followed by numerous studies that have corroborated the original finding (Pearce et al. 1985; McDowell 1983; Linet, Malker and McLaughlin 1988).
As a result of a cooperative effort between NIOSH, the National Cancer Institute, and the National Center for Health Statistics during the 1980s, analyses of the mortality patterns by occupation and industry between 1984 and 1988 in 24 states in the United States have recently been published (Robinson et al. 1995). These studies evaluated 1.7 million deaths. They confirmed several well-known exposure-disease relationships and reported new associations between selected occupations and specific causes of death. The authors emphasize that occupational mortality studies may be useful to develop new leads for further study, to evaluate results of other studies and to identify opportunities for health promotion.
More recently, Figgs and colleagues at the US National Cancer Institute used this 24-state occupational mortality database to examine occupational associations with non-Hodgkin’s lymphoma (NHL) (Figgs, Dosemeci and Blair 1995). A case-control analysis involving approximately 24,000 NHL deaths occurring between 1984 and 1989 confirmed previously demonstrated excess risks of NHL among farmers, mechanics, welders, repairmen, machine operators and a number of white-collar occupations.
Hospital discharge data
Diagnoses of hospitalized patients represent an excellent source of data for the surveillance of occupational diseases. Recent studies in several states in the United States show that hospital discharge data can be more sensitive than workers’ compensation records and vital statistics data in detecting cases of diseases that are specific to occupational settings, such as the pneumoconioses (Markowitz et al. 1989; Rosenman 1988). In New York State, for example, an annual average of 1,049 people were hospitalized for pneumoconioses in the mid-1980s, compared to 193 newly awarded workers’ compensation cases and 95 recorded deaths from these diseases each year during a similar time interval (Markowitz et al. 1989).
In addition to providing a more accurate count of the number of people ill with selected serious occupational diseases, hospital discharge data can be usefully followed up to detect and to alter workplace conditions that caused the disease. Thus, Rosenman evaluated workplaces in New Jersey where individuals who were hospitalized for silicosis had previously worked and found that the majority of these workplaces had never performed air sampling for silica, had never been inspected by the federal regulatory authority (OSHA) and did not perform medical surveillance for the detection of silicosis (Rosenman 1988).
Advantages of using hospital discharge data for the surveillance of occupational disease are their availability, low cost, relative sensitivity to serious illness and reasonable accuracy. Important disadvantages include the lack of information on occupation and industry and uncertain quality control (Melius, Sestito and Seligman 1989; Rosenman 1988). In addition, only individuals with disease sufficiently severe to require hospitalization will be included in the database and, therefore, cannot reflect the full spectrum of morbidity associated with occupational diseases. Nonetheless, it is likely that hospital discharge data will be increasingly used in occupational health surveillance in future years.
National surveys
Special surveillance surveys undertaken on a national or regional basis can be the source of information more detailed than can be obtained through use of routine vital records. In the United States, the National Center for Health Statistics (NCHS) conducts two periodic national health surveys relevant to occupational health surveillance: the National Health Interview Survey (NHIS) and the National Health and Nutrition Examination Survey (NHANES). The National Health Interview Survey is a national household survey designed to obtain estimates of the prevalence of health conditions from a representative sample of households reflecting the civilian non-institutionalized population of the United States (USDHHS 1980). A chief limitation of this survey is its reliance on self-reporting of health conditions. Occupational and industrial data on participating individuals have been used in the past decade for evaluating rates of disability by occupation and industry (USDHHS 1980), assessing the prevalence of cigarette smoking by occupation (Brackbill, Frazier and Shilling 1988) and recording workers’ views about the occupational risks that they face (Shilling and Brackbill 1987).
With the assistance of NIOSH, an Occupational Health Supplement (NHIS-OHS) was included in 1988 in order to obtain population-based estimates of the prevalence of selected conditions that may be associated with work (USDHHS 1993). Approximately 50,000 households were sampled in 1988, and 27,408 currently employed individuals were interviewed. Among the health conditions addressed by the NHIS-OHS are work-related injuries, dermatologic conditions, cumulative trauma disorders, eye, nose and throat irritation, hearing loss and low-back pain.
In the first completed analysis from the NHIS-OHS, Tanaka and colleagues from NIOSH estimated that the national prevalence of work-related carpal tunnel syndrome in 1988 was 356,000 cases (Tanaka et al. 1995). Of the estimated 675,000 people with prolonged hand pain and medically diagnosed carpal tunnel syndrome, over 50% reported that their health care provider had stated that their wrist condition was caused by workplace activities. This estimate does not include workers who had not worked in the 12 months prior to the survey and who may have been disabled due to work-related carpal tunnel syndrome.
In contrast to the NHIS, the NHANES directly assesses the health of a probability sample of 30,000 to 40,000 individuals in the United States by performing physical examinations and laboratory tests in addition to collecting questionnaire information. The NHANES was conducted twice in the 1970s and most recently in 1988. The NHANES II, which was conducted in the late 1970s, collected limited information on indicators of exposure to lead and selected pesticides. Initiated in 1988, the NHANES III collected additional data on occupational exposures and disease, especially concerning respiratory and neurologic disease of occupational origin (USDHHS 1994).
Summary
Occupational disease surveillance and reporting systems have significantly improved since the mid-1980s. Recording of illnesses is best for diseases unique or virtually unique to occupational causes, such as the pneumoconioses and malignant mesothelioma. Identification and reporting of other occupational diseases depends upon the ability to match occupational exposures with health outcomes. Many data sources enable occupational disease surveillance, though all have important shortcomings with regard to quality, comprehensiveness and accuracy. Important obstacles to improving occupational disease reporting include the lack of interest in prevention in health care, the inadequate training of health care practitioners in occupational health and the inherent conflicts between employers and workers in the recognition of work-related disease. Despite these factors, gains in occupational disease reporting and surveillance are likely to continue in the future.
Occupational Hazard Surveillance
Hazard surveillance is the process of assessing the distribution of, and the secular trends in, use and exposure levels of hazards responsible for disease and injury (Wegman 1992). In a public health context, hazard surveillance identifies work processes or individual workers exposed to high levels of specific hazards in particular industries and job categories. Since hazard surveillance is not directed at disease events, its use in guiding public health intervention generally requires that a clear exposure-outcome relationship has previously been established. Surveillance can then be justified on the assumption that reduction in the exposure will result in reduced disease. Proper use of hazard surveillance data enables timely intervention, permitting the prevention of occupational illness. Its most significant benefit is therefore the elimination of the need to wait for obvious illness or even death to occur before taking measures to protect workers.
There are at least five other advantages of hazard surveillance which complement those provided by disease surveillance. First, identifying hazard events is usually much easier than identifying occupational disease events, particularly for diseases such as cancer that have long latency periods. Second, a focus on hazards (rather than illnesses) has the advantage of directing attention to the exposures which ultimately are to be controlled. For example, surveillance of lung cancer might focus on rates in asbestos workers. However, a sizeable proportion of lung cancer in this population could be due to cigarette smoking, either independently of or interacting with the asbestos exposure, so that large numbers of workers might need to be studied to detect a small number of asbestos-related cancers. On the other hand, surveillance of asbestos exposure could provide information on the levels and patterns of exposure (jobs, processes or industries) where the poorest exposure control exists. Then, even without an actual count of lung cancer cases, efforts to reduce or eliminate exposure would be appropriately implemented.
Third, since not every exposure results in disease, hazard events occur with much higher frequency than disease events, resulting in the opportunity to observe an emerging pattern or change over time more easily than with disease surveillance. Related to this advantage is the opportunity to make greater use of sentinel events. A sentinel hazard can be simply the presence of an exposure (e.g., beryllium), as indicated via direct measurement in the workplace; the presence of an excessive exposure, as indicated via biomarker monitoring (e.g., elevated blood lead levels); or a report of an accident (e.g., a chemical spill).
A fourth advantage of the surveillance of hazards is that data collected for this purpose do not infringe on an individual’s privacy. Confidentiality of medical records is not at risk and the possibility of stigmatizing an individual with a disease label is avoided. This is particularly important in industrial settings where a person’s job may be in jeopardy or a potential compensation claim may affect a physician’s choice of diagnostic options.
Finally, hazard surveillance can take advantage of systems designed for other purposes. Examples of ongoing collection of hazard information which already exists include registries of toxic substance use or hazardous material discharges, registries for specific hazardous substances and information collected by regulatory agencies for use in compliance. In many respects, the practising industrial hygienist is already quite familiar with the surveillance uses of exposure data.
Hazard surveillance data can complement disease surveillance both for research to establish or confirm a hazard-disease association, as well as for public health applications, and the data collected in either instance can be used to determine the need for remediation. Different functions are served by national surveillance data (as might be developed using the US OSHA Integrated Management Information System data on industrial hygiene compliance sample results—see below) in contrast to those served by hazard surveillance data at a plant level, where much more detailed focus and analysis are possible.
National data may be extremely important in targeting inspections for compliance activity or for determining what is the probable distribution of risks that will result in specific demands on medical services for a region. Plant-level hazard surveillance, however, provides the necessary detail for close examination of trends over time. Sometimes a trend occurs independently of changes in controls but rather in response to product changes which would not be evident in regionally grouped data. Both national and plant-level approaches can be useful in determining whether there is a need for planned scientific studies or for worker and management educational programmes.
By combining hazard surveillance data from routine inspections in a wide range of seemingly unrelated industries, it is sometimes possible to identify groups of workers for whom heavy exposure might otherwise be overlooked. For example, analysis of airborne lead concentrations as determined in OSHA compliance inspections for 1979 to 1985 identified 52 industries in which the permissible exposure limit (PEL) was exceeded in more than one-third of inspections (Froines et al. 1990). These industries included primary and secondary smelting, battery manufacture, pigment manufacture and brass/bronze foundries. As these are all industries with historically high lead exposure, excessive exposures indicated poor control of known hazards. However some of these workplaces are quite small, such as secondary lead smelter operations, and individual plant managers or operators may be unlikely to undertake systematic exposure sampling and could thus be unaware of serious lead exposure problems in their own workplaces. In contrast to high levels of ambient lead exposures that might have been expected in these basic lead industries, it was also noted that over one-third of the plants in the survey in which the PELs were exceeded resulted from painting operations in a wide variety of general industry settings. Structural steel painters are known to be at risk for lead exposure, but little attention has been directed to industries that employ painters in small operations painting machinery or machinery parts. These workers are at risk of hazardous exposures, yet they often are not considered to be lead workers because they are in an industry which is not a lead-based industry. In a sense, this survey revealed evidence of a risk that was known but had been forgotten until it was identified by analysis of these surveillance data.
Objectives of Hazard Surveillance
Programmes of hazard surveillance can have a variety of objectives and structures. First, they permit focus on intervention actions and help to evaluate existing programmes and to plan new ones. Careful use of hazard surveillance information can lead to early detection of system failure and call attention to the need for improved controls or repairs before excess exposures or diseases are actually experienced. Data from such efforts can also provide evidence of need for new or revised regulation for a specific hazard. Second, surveillance data can be incorporated into projections of future disease to permit planning of both compliance and medical resource use. Third, using standardized exposure methodologies, workers at various organizational and governmental levels can produce data which permit focus on a nation, a city, an industry, a plant or even a job. With this flexibility, surveillance can be targeted, adjusted as needed, and refined as new information becomes available or as old problems are solved or new ones appear. Finally, hazard surveillance data should prove valuable in planning epidemiological studies by identifying areas where such studies would be most fruitful.
Examples of Hazard Surveillance
Carcinogen Registry—Finland. In 1979 Finland began to require national reporting of the use of 50 different carcinogens in industry. The trends over the first seven years of surveillance were reported in 1988 (Alho, Kauppinen and Sundquist 1988). Over two-thirds of workers exposed to carcinogens were working with only three types of carcinogens: chromates, nickel and inorganic compounds, or asbestos. Hazard surveillance revealed that a surprisingly small number of compounds accounted for most carcinogen exposures, thus greatly improving the focus for efforts at toxic use reduction as well as efforts at exposure controls.
Another important use of the registry was the evaluation of reasons that listings “exited” the system—that is, why use of a carcinogen was reported once but not on subsequent surveys. Twenty per cent of exits were due to continuing but unreported exposure. This led to education for, as well as feedback to, the reporting industries about the value of accurate reporting. Thirty-eight per cent exited because exposure had stopped, and among these over half exited due to substitution by a non-carcinogen. It is possible that the results of the surveillance system reports stimulated the substitution. Most of the remainder of the exits resulted from elimination of exposures by engineering controls, process changes or considerable decrease in use or exposure time. Only 5% of exits resulted from use of personal protective equipment. This example shows how an exposure registry can provide a rich resource for understanding the use of carcinogens and for tracking the change in use over time.
National Occupational Exposure Survey (NOES). The US NIOSH carried out two National Occupational Exposure Surveys (NOES) ten years apart to estimate the number of workers and workplaces potentially exposed to each of a wide variety of hazards. National and state maps were prepared that show the items surveyed, such as the pattern of workplace and worker exposures to formaldehyde (Frazier, Lalich and Pedersen 1983). Superimposing these maps on maps of mortality for specific causes (e.g., nasal sinus cancer) provides the opportunity for simple ecological examinations designed to generate hypotheses which can then be investigated by appropriate epidemiological study.
Changes between the two surveys have also been examined—for example, the proportions of facilities in which there were potential exposures to continuous noise without functioning controls (Seta and Sundin 1984). When examined by industry, little change was seen for general building contractors (92.5% to 88.4%), whereas a striking decrease was seen for chemicals and allied products (88.8% to 38.0%) and for miscellaneous repair services (81.1% to 21.2%). Possible explanations included passage of the Occupational Safety and Health Act, collective bargaining agreements, concerns with legal liability and increased employee awareness.
Inspection (Exposure) Measures (OSHA). The US OSHA has been inspecting workplaces to evaluate the adequacy of exposure controls for over twenty years. For most of that time, the data have been placed in a database, the Integrated Management Information System (OSHA/IMIS). Overall secular trends in selected cases have been examined for 1979 to 1987. For asbestos, there is good evidence for largely successful controls. In contrast, while the number of samples collected for exposures to silica and lead declined over those years, both substances continued to show a substantial number of overexposures. The data also showed that despite reduced numbers of inspections, the proportion of inspections in which exposure limits were exceeded remained essentially constant. Such data could be highly instructive to OSHA when planning compliance strategies for silica and lead.
Another use of the workplace inspection database has been a quantitative examination of silica exposure levels for nine industries and jobs within those industries (Froines, Wegman and Dellenbaugh 1986). Exposure limits were exceeded to various degrees, from 14% (aluminium foundries) to 73% (potteries). Within the potteries, specific jobs were examined and the proportion where exposure limits were exceeded ranged from 0% (labourers) to 69% (sliphouse workers). The degree to which samples exceeded the exposure limit varied by job. For sliphouse workers excess exposures were, on average, twice the exposure limit, while slip/glaze sprayers had average excess exposures of over eight times the limit. This level of detail should prove valuable to management and workers employed in potteries as well as to government agencies responsible for regulating occupational exposures.
Summary
This article has identified the purpose of hazard surveillance, described its benefits and some of its limitations and offered several examples in which it has provided useful public health information. However, hazard surveillance should not replace disease surveillance for noninfectious diseases. In 1977 a NIOSH task force emphasized the relative interdependence of the two major types of surveillance, stating:
The surveillance of hazards and diseases cannot proceed in isolation from each other. The successful characterization of the hazards associated with different industries or occupations, in conjunction with toxicological and medical information relating to the hazards, can suggest industries or occupational groups appropriate for epidemiological surveillance (Craft et al. 1977).
Surveillance in Developing Countries
It is estimated that more than 80% of the world’s population live in the developing countries in Africa, the Middle East, Asia and South and Central America. The developing countries are often financially disadvantaged, and many have largely rural and agricultural economies. However, they are widely different in many ways, with diverse aspirations, political systems and varying stages of industrial growth. The status of health among people in the developing countries is generally lower than in the developed countries, as reflected by higher infant mortality rates and lower life expectancies.
Several factors contribute to the need for occupational safety and health surveillance in developing countries. First, many of these countries are rapidly industrializing. In terms of the size of industrial establishments, many of the new industries are small-scale industries. In such situations, safety and health facilities are often very limited or non-existent. In addition, developing countries are often the recipients of technology transfer from developed countries. Some of the more hazardous industries, which have difficulty in operating in countries with more stringent and better enforced occupational health legislation, may be “exported” to developing countries.
Second, with regard to the workforce, the education level of the workers in developing countries is often lower, and workers may be untrained in safe work practices. Child labour is often more prevalent in developing countries. These groups are relatively more vulnerable to health hazards at work. In addition to these considerations, there is generally a lower pre-existing level of health among workers in developing countries.
These factors would ensure that throughout the world, workers in developing countries are among those who are most vulnerable to and who face the greatest risk from occupational health hazards.
Occupational Health Effects are Different from Those Seen in Developed Countries
It is important to obtain data on health effects for prevention and for prioritization of approaches to solve occupational health problems. However, most of the available morbidity data may not be applicable for developing countries, as they originate from the developed countries.
In developing countries, the nature of the occupational health effects from workplace hazards may be different from those in the developed countries. Overt occupational diseases such as chemical poisonings and the pneumoconioses, which are caused by exposures to high levels of workplace toxins, are still encountered in significant numbers in developing countries, while these problems may have been substantially reduced in the developed countries.
For example, in the case of pesticide poisoning, acute health effects and even deaths from high exposures are a greater immediate concern in developing agricultural countries, as compared to the long-term health effects from low dose exposure to pesticides, which might be a more important issue in the developed countries. In fact, the morbidity burden from acute pesticide poisoning in some developing countries, such as Sri Lanka, may even surpass that of traditional public health problems such as diphtheria, whooping cough and tetanus.
Thus, some surveillance of occupational health morbidity is required from the developing countries. The information would be useful for the assessment of the magnitude of the problem, prioritization of plans to cope with the problems, allocation of resources and for subsequent evaluation of the impact of interventions.
Unfortunately, such surveillance information is often lacking in the developing countries. It should be recognized that surveillance programmes in developed countries may be inappropriate for developing countries, and such systems probably cannot be adopted in their entirety for developing countries because of the various problems which may impede surveillance activities.
Problems of Surveillance in Developing Countries
While the need for surveillance of occupational safety and health problems exists in developing countries, the actual implementation of surveillance is often fraught with difficulties.
The difficulties may arise because of poor control of industrial development, the absence of, or an inadequately developed infrastructure for, occupational health legislation and services, insufficiently trained occupational health professionals, limited health services and poor health reporting systems. Very often the information on the workforce and general population may be lacking or inadequate.
Another major problem is that in many developing countries, occupational health is not accorded a high priority in national development programmes.
Activities in Occupational Health and Safety Surveillance
Surveillance of occupational safety and health may involve activities such as the monitoring of dangerous occurrences at work, work injury and work fatalities. It also includes surveillance of occupational illness and surveillance of the work environment. It is probably easier to collect information on work injury and accidental death at work, since such events are fairly easily defined and recognized. In contrast, surveillance of the health status of the working population, including occupational diseases and the state of the work environment, is more difficult.
The rest of this article will therefore deal mainly with the issue of surveillance of occupational illness. The principles and approaches which are discussed can be applied to the surveillance of work injuries and fatalities, which are also very important causes of morbidity and mortality among workers in developing countries.
Surveillance of workers’ health in developing countries should not be limited only to occupational diseases, but should also be for general diseases of the working population. This is because the main health problems among workers in some developing countries in Africa and Asia may not be occupational, but may include other general diseases such as infectious diseases—for example, tuberculosis or sexually transmitted diseases. The information collected would then be useful for planning and allocation of health care resources for the promotion of health of the working population.
Some Approaches to Overcome the Problems of Surveillance
Which types of occupational health surveillance are appropriate in developing countries? In general, a system with simple mechanisms, employing available and appropriate technology, would be best suited for developing countries. Such a system should also take into account the types of industries and work hazards which are important in the country.
Utilization of existing resources
Such a system may utilize the existing resources such as the primary health care and environmental health services. For example, occupational health surveillance activities can be integrated into the current duties of primary health care personnel, public health inspectors and environmental engineers.
For this to happen, primary health care and public health personnel have first to be trained to recognize illness which may be related to the work, and even to perform simple assessments of unsatisfactory workplaces in terms of occupational safety and health. Such personnel should, of course, receive adequate and appropriate training in order to perform these tasks.
The data on conditions of work and illness arising from work activities can be collated while such persons conduct their routine work in the community. The information collected can be channelled to regional centres, and ultimately to a central agency responsible for the monitoring of conditions of work and occupational health morbidity that is also responsible for acting on these problems.
Registry of factories and work processes
A registry of factories and work processes, as opposed to a disease registry, could be initiated. This registry would obtain information from the registration stage of all factories, including work processes and materials used. The information should be updated periodically when new work processes or materials are introduced. Where, in fact, such registration is required by national legislation, it needs to be enforced in a comprehensive manner.
However, for small-scale industries, such registration is often bypassed. Simple field surveys and assessments of the types of industry and the state of working conditions could provide basic information. The persons who could perform such simple assessments could again be the primary health care and public health personnel.
Where such a registry is in effective operation, there is also a need for periodic update of the data. This could be made compulsory for all registered factories. Alternatively, it may be desirable to request an update from factories in various high-risk industries.
Notification of occupational diseases
Legislation for notification of selected occupational health disorders could be introduced. It would be important to publicize and educate people on this matter before implementation of the law. Questions such as what diseases should be reported, and who should be the persons responsible for notification, should first be resolved. For example, in a developing country like Singapore, physicians who suspect the occupational diseases listed in table 1 have to notify the Ministry of Labour. Such a list has to be tailored to the types of industry in a country, and be revised and updated periodically. Furthermore, the persons responsible for notification should be trained to recognize, or at least to suspect, the occurrence of the diseases.
Table 1. Sample list of notifiable occupational diseases
|
Aniline poisoning |
Industrial dermatitis |
|
Anthrax |
Lead poisoning |
|
Arsenical poisoning |
Liver angiosarcoma |
|
Asbestosis |
Manganese poisoning |
|
Barotrauma |
Mercurial poisoning |
|
Beryllium poisoning |
Mesothelioma |
|
Byssinosis |
Noise-induced deafness |
|
Cadmium poisoning |
Occupational asthma |
|
Carbon disulphide poisoning |
Phosphorous poisoning |
|
Chrome ulceration |
Silicosis |
|
Chronic benzene poisoning |
Toxic anaemia |
|
Compressed air illness |
Toxic hepatitis |
Continuous follow-up and enforcement action is needed to ensure the success of such notification systems. Otherwise, gross underreporting would limit their usefulness. For example, occupational asthma was first made notifiable and compensable in Singapore in 1985. An occupational lung disease clinic was also set up. Despite these efforts, a total of only 17 cases of occupational asthma were confirmed. This can be contrasted with the data from Finland, where there were 179 reported cases of occupational asthma in 1984 alone. Finland’s population of 5 million is only about twice that of Singapore. This gross under-reporting of occupational asthma is probably due to the difficulty in diagnosing the condition. Many doctors are unfamiliar with the causes and features of occupational asthma. Hence, even with the implementation of compulsory notification, it is important to continue to educate the health professionals, employers and employees.
When the notification system is initially implemented, a more accurate assessment of the prevalence of the occupational disease can be made. For example, the number of notifications of noise-induced hearing loss in Singapore increased six-fold after statutory medical examinations were introduced for all noise-exposed workers. Subsequently, if the notification is fairly complete and accurate, and if a satisfactory denominator population could be obtained, it may even be possible to estimate the incidence of the condition and its relative risk.
As in many notification and surveillance systems, the important role of notification is to alert the authorities to index cases at the workplace. Further investigations and workplace interventions, if necessary, are required follow-up activities. Otherwise, the efforts of notification would be wasted.
Other sources of information
Hospital and outpatient health information is often underutilized in the surveillance of occupational health problems in a developing country. Hospitals and outpatient clinics can and should be incorporated into the notification system for specific diseases, such as acute work-related poisonings and injuries. The data from these sources would also provide an idea of the common health problems among workers, and can be used for the planning of workplace health promotion activities.
All this information is usually routinely collected, and few extra resources are required to direct the data to the occupational health and safety authorities in a developing country.
Another possible source of information would be the compensation clinics or tribunals. Finally, if the resources are available, some regional occupational medicine referral clinics might also be initiated. These clinics could be staffed by more qualified occupational health professionals, and would investigate any suspected work-related illness.
Information from existing disease registries should also be utilized. In many larger cities of developing countries, cancer registries are in place. Though the occupational history obtained from these registries may not be complete and accurate, it is useful for preliminary monitoring of broad occupational groups. Data from such registries will be even more valuable if registers of workers exposed to specific hazards are available for cross-matching.
The role of data linkage
While this may sound attractive, and has been employed with some success in some developed countries, this approach may not be appropriate or even possible in developing countries at present. This is because the infrastructure required for such a system is often not available in developing countries. For example, disease registries and workplace registers may not be available or, if they exist, may not be computerized and easily linked.
Help from international agencies
International agencies such as the International Labour Organization, the World Health Organization and bodies such as the International Commission on Occupational Health can contribute their experience and expertise in overcoming common problems of occupational health and safety surveillance in a country. In addition, training courses as well as training opportunities for primary care persons may be developed or offered.
Sharing of information from regional countries with similar industries and occupational health problems is also often useful.
Summary
Occupational safety and health services are important in developing countries. This is especially so in view of the rapid industrialization of the economy, the vulnerable work population and the poorly controlled health hazards faced at work.
In the development and delivery of occupational health services in these countries, it is important to have some type of surveillance of occupational ill health. This is necessary for the justification, planning and prioritization of occupational health legislation and services, and the evaluation of the outcome of these measures.
While surveillance systems are in place in the developed countries, such systems may not always be appropriate for developing countries. Surveillance systems in developing countries should take into account the type of industry and hazards which are important in the country. Simple surveillance mechanisms, employing available and appropriate technology, are often the best options for developing countries.
Development and Application of an Occupational Injury and Illness Classification System
Systems of workplace injury and illness surveillance constitute a critical resource for management and reduction of occupational injuries and illnesses. They provide essential data which can be used to identify workplace problems, develop corrective strategies and thus prevent future injuries and illnesses. To accomplish these goals effectively, surveillance systems must be constructed which capture the characteristics of workplace injuries in considerable detail. To be of maximum value, such a system should be able to provide answers to such questions as which workplaces are the most hazardous, which injuries produce the most time lost from work and even what part of the body is injured most frequently.
This article describes the development of an exhaustive classification system by the Bureau of Labor Statistics of the United States Department of Labor (BLS). The system was developed to meet the needs of a variety of constituencies: state and federal policy analysts, safety and health researchers, employers, employee organizations, safety professionals, the insurance industry and others involved in promoting safety and health in the workplace.
Background
For a number of years, the BLS has collected three basic types of information concerning an occupational injury or illness:
- industry, geographic location of the incident and any associated lost workdays
- characteristics of the affected employee, such as age, gender and occupation
- how the incident or exposure occurred, the objects or substances involved, the nature of the injury or illness and part of the body affected.
The previous classification system, though useful, was somewhat limited and did not fully meet the needs described above. In 1989 it was decided that a revision of the existing system was in order that would best suit the needs of the varied users.
The Classification System
A BLS task force was organized in September 1989 to establish requirements for a system that would “accurately describe the nature of the occupational safety and health problem” (OSHA 1970). This team worked in consultation with safety and health specialists from the public and private sectors, with the goal of developing a revamped and expanded classification system.
Several criteria were established governing the individual code structures. The system must have a hierarchical arrangement to allow maximum flexibility for varied users of occupational injury and illness data. The system should be, to the extent possible, compatible with the International Classification of Diseases, 9th Revision, Clinical Modification (ICD-9-CM) of the WHO (1977). The system should meet the needs of other government agencies involved in the safety and health arena. Finally, the system must be responsive to the differing traits of nonfatal and fatal cases.
Drafts of the case characteristic classification structures were produced and released for comment in 1989 and again in 1990. The system included nature of injury or illness, part of body affected, source of injury or illness, event or exposure structures and secondary source. Comments were received and incorporated from bureau staff, state agencies, Occupational Safety and Health Administration, Employment Standards Administration and NIOSH, after which the system was ready for an onsite test.
Pilot testing of the structures for compiling data for nonfatal injuries and illnesses, as well as the operational application in the Census of Fatal Occupational Injuries, was conducted in four states. Test results were analysed and revisions completed by the fall of 1991.
The final 1992 version of the classification system consists of five case characteristic code structures, an occupational code structure and an industry code structure. The Standard Industrial Classification Manual is used to classify industry (OMB 1987), and the Bureau of the Census Alphabetical Index of Occupations for coding occupation (Bureau of the Census 1992). The BLS Occupational Injury and Illness Classification System (1992) is used to code the following five characteristics:
- nature of injury or illness
- part of body affected
- event or exposure
- source of injury or illness
- secondary source of injury or illness.
Besides numerical codes that represent specific conditions or circumstances, each code structure includes aids to assist in identification and selection of the proper code. These aids include: definitions, rules of selection, descriptive paragraphs, alphabetical listings and edit criteria for each of the structures. The rules of selection offer guidance to choose the appropriate code uniformly when two or more code selections are possible. The descriptive paragraphs provide additional information about the codes such as what is included or excluded in a particular code. For instance, the code for eye includes the eyeball, the lens, the retina and the eyelashes. The alphabetical listings can be used to quickly find the numerical code for a specific characteristic, such as medical terminology or specialized machinery. Finally, edit criteria are quality-assurance tools that can be used to determine which code combinations are incorrect prior to final selection.
Nature of injury or illness codes
The nature of injury or illness code structure describes the principal physical characteristic of the worker’s injury or illness. This code serves as the basis for all other case classifications. Once the nature of injury or illness has been identified, the remaining four classifications represent the circumstances associated with that particular outcome. The classification structure for nature of injury of illness contains seven divisions:
- traumatic injuries and disorders
- systemic diseases or disorders
- infectious and parasitic diseases
- neoplasms, tumours and cancer
- symptoms, signs and ill-defined conditions
- other conditions or disorders
- multiple diseases, conditions or disorders.
Before finalizing this structure, two similar classifications systems were evaluated for possible adoption or emulation. Because the American National Standards Institute (ANSI) Z16.2 standard (ANSI 1963) was developed for use in accident prevention, it does not contain a sufficient number of illness categories for many agencies to accomplish their missions.
The ICD-9-CM, designed for classifying morbidity and mortality information and used by a large portion of the medical community, provides the required detailed codes for illnesses. However, technical knowledge and training requirements for users and compilers of these statistics made this system prohibitive.
The final structure arrived at is a hybrid which combines the application method and rules of selection from the ANSI Z16.2 with the basic divisional organization from the ICD-9-CM. With few exceptions, divisions in the BLS structure can be directly mapped to the ICD-9-CM. For example, the BLS division identifying infectious and parasitic diseases maps directly to Chapter 1, Infectious and Parasitic Diseases, of the ICD-9-CM.
The first division in the BLS nature of injury or illness structure classifies traumatic injuries and disorders, effects of external agents and poisoning, and corresponds to Chapter 17 of the ICD-9-CM. Outcomes in this division are generally the result of a single incident, event or exposure, and include conditions such as fractures, bruises, cuts and burns. In the occupational environment, this division accounts for the great majority of reported cases.
Several situations required careful consideration when establishing rules to select codes in this division. Review of fatality cases revealed difficulties in coding certain types of fatal injuries. For example, fatal fractures usually involve direct or indirect mortal damage to a vital organ, such as the brain or spinal column. Specific coding categories and instructions were required to note the mortal damage associated with these types of injuries.
Gunshot wounds constitute a separate category with special instructions for those instances in which such wounds also resulted in amputations or paralysis. In keeping with an overall philosophy of coding the most serious injury, paralysis and amputations take precedence over less serious damage from a gunshot wound.
Responses to questions on employer reporting forms concerning what happened to the injured or ill worker do not always adequately describe the injury or illness. If the source document indicates only that the employee “hurt his back”, it is not appropriate to assume this is a sprain, strain, dorsopathy or any other specific condition. To solve the problem, individual codes were established for non-specific descriptions of injury or illness like “sore,” “hurt” and “pain”.
Finally, this division has a section of codes to classify the most frequently occurring combinations of conditions that result from the same incident. For example, a worker may suffer both scratches and bruises from a single incident.
Five of the remaining divisions of this classification structure were devoted to identification of occupational diseases and disorders. These sections present codes for specific conditions that are of paramount interest to the safety and health community. In recent years, a growing number of diseases and disorders have been linked to the work environment but were seldom represented in the existing classification structures. The structure has a vastly expanded list of specific diseases and disorders such as carpal tunnel syndrome, Legionnaire’s disease, tendonitis and tuberculosis.
Part of body affected
The part of body affected classification structure specifies the part of the body which was directly affected by the injury or illness. When linked with the nature of injury or illness code, it provides a more complete picture of the damage incurred: amputated finger, lung cancer, fractured jaw. This structure consists of eight divisions:
- head
- neck, including throat
- trunk
- upper extremities
- lower extremities
- body systems
- multiple body parts
- other body parts.
Three issues surfaced during evaluation of redesign options for this theoretically simple and straightforward piece of the classification system. The first was the merit of coding external location (arm, trunk, leg) of the injury or illness versus the affected internal site (heart, lungs, brain).
Test results indicated that coding the internal part of body affected was appropriate for diseases and disorders, but extremely confusing when applied to many traumatic injuries such as cuts or bruises. The BLS developed a policy of coding the external location for most traumatic injuries and coding internal locations, where appropriate, for diseases.
The second issue was how to handle diseases that affect more than one body system simultaneously. For instance, hypothermia, a condition of low body temperature due to exposure to the cold, can affect the nervous and endocrine systems. Because it is difficult for nonmedical personnel to determine which is the appropriate choice, this could lead to a tremendous amount of research time with no clear resolution. Therefore, the BLS system was designed with a single entry, body systems, that categorizes one or more body systems.
Adding detail to identify typical combinations of parts in the upper extremities and the lower extremities was the third major enhancement to this code structure. These combinations, such as hand and wrist, proved to be supportable by the source documents.
Event or exposure
The event or exposure code structure describes the manner in which the injury or illness was inflicted or produced. The following eight divisions were created to identify the primary method of injury or exposure to a harmful substance or situation:
- contact with objects and equipment
- falls
- bodily reaction and exertion
- exposure to harmful substances or environments
- transportation accidents
- fires and explosions
- assaults and violent acts
- other events or exposures.
Injury-producing incidents are frequently composed of a series of events. To illustrate, consider what occurs in a traffic accident: A car hits a guard-rail, crosses the median strip and collides with a truck. The driver has several injuries from striking parts of the car and being struck by broken glass. If the micro-events—such as hitting the windshield or being struck by flying glass—were coded, the overall fact that the person was in a traffic accident could be missed.
In these multiple event instances, the BLS designated several occurrences to be considered primary events and to take precedence over other micro-events associated with them. These primary events included:
- assaults and violent acts
- transportation accidents
- fires
- explosions.
An order of precedence was established within these groups as well because they frequently overlap—for example, a highway accident can involve a fire. This order of precedence is the order which they appear in the above list. Assaults and violent acts were assigned first precedence. Codes within this division generally describe the type of violence, while the weapon is addressed in the source code. Transportation accidents are next in precedence, followed by fires and explosions.
These last two events, fires and explosions, are combined in a single division. Because the two often occur simultaneously, an order of precedence between the two had to be established. In accordance with the ICD-9 Supplementary Classification of External Causes, fires were given precedence over explosions (USPHS 1989).
Selection of codes for inclusion in this structure was influenced by the emergence of non-contact disorders that are associated with the activities and ergonomics of the job. These cases typically involve nerve, muscle or ligament damage brought about by exertion, repetitive motion and even simple body motions such as when the worker’s back “goes out” when reaching over to pick up an item. Carpal tunnel syndrome is now widely recognized to be tied to repetitive actions such as key entry, typing, cutting actions and even operating a cash register. The division bodily reaction and exertion identifies these non-contact, or non-impact, incidents.
The event division “exposure to harmful substances or environments” distinguishes the specific method of exposure to toxic or harmful substances: inhalation, skin contact, ingestion or injection. A separate category to identify the transmission of an infectious agent through a needle stick was developed. Also included in this division are other non-impact incidents in which the worker was harmed by electric power or by environmental conditions, such as extreme cold.
Contact with objects and equipment and falls are the divisions that will capture most impact events that injure workers.
Source of injury or illness
The source of injury or illness classification code identifies the object, substance, bodily motion or exposure which directly produced or inflicted the injury or illness. If a worker is cut on the head by a falling brick, the brick is the source of injury. There is a direct relationship between the source and the nature of the injury or illness. If a worker slips on oil and falls to the floor, breaking an elbow, the fracture is produced by hitting the floor, so the floor is source of injury. This code system contains ten divisions:
- chemicals and chemical products
- containers
- furniture and fixtures
- machinery
- parts and materials
- persons, plants, animals and minerals
- structures and surfaces
- tools, instruments and equipment
- vehicles
- other sources.
The general definitions and coding concepts for the new BLS Source Classification Structure were carried over from the ANSI Z16.2 classification system. However, the task of developing a more complete and hierarchical code listing was initially daunting, since virtually any item or substance in the world can qualify as a source of injury or illness. Not only can everything in the world qualify as source, so can pieces or parts of everything in the world. To add to the difficulty, all candidates for inclusion in the source codes had to be grouped into only ten divisional categories.
Examination of historical data on work injuries and illness identified areas where the previous code structure was inadequate or out of date. The machinery and tools sections needed expansion and updating. There was no code for computers. Newer technology had made the list of power tools obsolete, and many items listed as nonpowered tools were now almost always powered: screwdrivers, hammers and so on. There was a demand from users to expand and update the list of chemicals in the new structure. The US Occupational Safety and Health Administration requested expanded detail for a variety of items, including several types of scaffolds, forklifts and construction and logging machines.
The most difficult aspect of developing the source structure was organizing the items required for inclusion into distinct divisions and groups within the division. To add to the difficulty, the source code categories had to be mutually exclusive. But no matter what categories were developed, there were many items that logically fit in two or more divisions. For example, there was general agreement that there should be separate categories for vehicles and for machines. However, reviewers disagreed about whether certain equipment such as road pavers or forklifts, belonged with machines or vehicles.
Another area of debate developed on how to group the machines within the machinery division. The options included associating machines with a process or an industry (for example, agricultural or garden machines), grouping them by function (printing machines, heating and cooling machinery) or by type of object processed (metal working, woodworking machines). Unable to find a single solution which was workable for all types of machines, the BLS compromised with a listing that uses an industry function for some groups (agricultural machines, construction and logging machines), general function for other groups (material handling machines, office machines), and some material-specific functional groupings (metalworking, woodworking). Where the possibility of overlap occurred, such as a woodworking machine used for construction work, the structure defined the category to which it belonged, to keep the codes mutually exclusive.
Special codes were added to capture information on injuries and illnesses occurring in the health care industry, which has emerged as one of the largest employment sectors in the United States, and one with serious safety and health problems. As an example, many of the participating state agencies recommended inclusion of a code for patients and residents of health care facilities, since nurses and health aides can be hurt while trying to lift, move or otherwise care for their patients.
Secondary source of injury or illness
The BLS and other data users recognized that the occupational injury and illness source classification structure captures the object that produced the injury or illness but sometimes fails to identify other important contributors to the event. In the previous system, for example, if a worker was struck by a piece of wood that flew off a jammed saw, the wood was the source of injury; the fact that a power saw was involved was lost. If a worker was burned by fire, the flame was selected as the source of injury; one could not also identify the source of the fire.
To make up for this potential loss of information, the BLS developed a secondary source of injury or illness which “identifies the object, substance, or person that generated the source or injury or illness or that contributed to the event or exposure”. Within the specific rules of selection for this code, the emphasis is on identifying the machines, tools, equipment or other energy-generating substances (such as flammable liquids) that are not identified through source classification. In the first example noted above, the power saw would be the secondary source, since it threw out the piece of wood. In the latter example, the substance that ignited (grease, gasoline and so on) would be named as the secondary source.
Implementation Requirements: Review, Verification and Validation
Establishing a comprehensive classification system is only one step in assuring that accurate information concerning workplace injuries and illnesses is captured and available for use. It is important that workers in the field understand how to apply the coding system accurately, uniformly and according to the system design.
The first step in quality assurance was to thoroughly train those who will be assigning the classification system codes. Beginning, intermediate and advanced courses were developed to assist in uniform coding techniques. A small group of trainers was charged with delivering these courses to concerned personnel throughout the United States.
Electronic edit checks were devised to assist in the review, verification and validation process for the case characteristic and demographic estimates. Criteria of what can and cannot be combined were identified and an automated system to identify those combinations as errors was put into place. This system has over 550 groups of cross check which verify that the incoming data meet quality checks. For example, a case that identified carpal tunnel syndrome as affecting the knee would be deemed an error. This automated system also identifies invalid codes, that is, codes that do not exist in the classification structure.
Clearly, these edit checks cannot be sufficiently stringent to capture all suspect data. The data should be examined for overall reasonableness. For example, over the years of collecting similar data for the part of body, nearly 25% of the cases named the back as the affected area. This gave review staff a benchmark for validating data. A review of cross tabulations for overall sensibility also gives insight into how well the classification system was applied. Finally, special rare events, such as work-related tuberculosis, should be validated. One important element of a comprehensive validation system could involve recontacting the employer to insure the accuracy of the source document, although this requires additional resources.
Examples
Selected examples from each of the four illness and injury classification coding systems are shown in table 1 in order to illustrate the level of detail and the resulting richness of the final system. The power of the system as a whole is demonstrated in table 2, which shows a variety of characteristics that were tabulated for one set of related injury types—falls. In addition to total falls, the data are further subdivided into falls on the same level, falls to a lower level and jumping to a lower level. It can be seen, for instance, that falls were most likely to occur to workers age 25 to 34 years old, to operators, fabricators and labourers, to workers in the manufacturing industries and to workers with less than five years of service to their current employer (data not shown). The accident was most often associated with work on a floor or ground surface, and the subsequent injury was most likely to be a sprain or strain affecting the back, resulting in the worker spending more than one month away from work.
Table 1. Nature of injury or illness code—Examples
Nature of injury or illness code-Examples
0* Traumatic Injuries and Disorders
08* Multiple traumatic injuries and disorders
080 Multiple traumatic injuries and disorders, unspecified
081 Cuts, abrasions, bruises
082 Sprains and bruises
083 Fractures and burns
084 Fractures and other injuries
085 Burns and other injuries
086 Intracranial injuries and injuries to internal organs
089 Other combinations of traumatic injuries and disorders, n.e.c.
Event or exposure code-Examples
1* Falls
11* Fall to lower level
113 Fall from ladder
114 Fall from piled or stacked material
115* Fall from roof
1150 Fall from roof, unspecified
1151 Fall through existing roof opening
1152 Fall through roof surface
1153 Fall through skylight
1154 Fall from roof edge
1159 Fall from roof, n.e.c.
116 Fall from scaffold, staging
117 Fall from building girders or other structural steel
118 Fall from nonmoving vehicle
119 Fall to lower level, n.e.c.
Source of injury or illness code-Examples
7*Tools, instruments and equipment
72* Handtools-powered
722* Cutting handtools, powered
7220 Cutting handtools, powered, unspecified
7221 Chainsaws, powered
7222 Chisels, powered
7223 Knives, powered
7224 Saws, powered, except chainsaws
7229 Cutting handtools, powered, n.e.c.
723* Striking and nailing handtools, powered
7230 Striking handtools, powered, unspecified
7231 Hammers, powered
7232 Jackhammers, powered
7233 Punches, powered
Part of body affected code-Examples
2* Trunk
23* Back, including spine, spinal cord
230 Back, including spine, spinal cord, unspecified
231 Lumbar region
232 Thoracic region
233 Sacral region
234 Coccygeal region
238 Multiple back regions
239 Back, including spine, spinal cord, n.e.c.
* = division, major group, or group titles; n.e.c. = not elsewhere classified.
Table 2. Number and percentage of nonfatal occupational injuries and illnesses with days away from work involving falls, by selected worker and case characteristics, US 19931
|
Characteristic |
All events |
All falls |
Fall to lower level |
Jump to lower level |
Fall on same level |
|||||
|
Number |
% |
Number |
% |
Number |
% |
Number |
% |
Number |
% |
|
|
Total |
2,252,591 |
100.0 |
370,112 |
100.0 |
111,266 |
100.0 |
9,433 |
100.0 |
244,115 |
100.0 |
|
Sex: |
||||||||||
|
Men |
1,490,418 |
66.2 |
219,199 |
59.2 |
84,868 |
76.3 |
8,697 |
92.2 |
121,903 |
49.9 |
|
Women |
735,570 |
32.7 |
148,041 |
40.0 |
25,700 |
23.1 |
645 |
6.8 |
120,156 |
49.2 |
|
Age: |
||||||||||
|
14 to 15 years |
889 |
0.0 |
246 |
0.1 |
118 |
0.1 |
— |
— |
84 |
0.0 |
|
16 to 19 years |
95,791 |
4.3 |
15,908 |
4.3 |
3,170 |
2.8 |
260 |
2.8 |
12,253 |
5.0 |
|
20 to 24 years |
319,708 |
14.2 |
43,543 |
11.8 |
12,840 |
11.5 |
1,380 |
14.6 |
28,763 |
11.8 |
|
25 to 34 years |
724,355 |
32.2 |
104,244 |
28.2 |
34,191 |
30.7 |
3,641 |
38.6 |
64,374 |
26.4 |
|
35 to 44 years |
566,429 |
25.1 |
87,516 |
23.6 |
27,880 |
25.1 |
2,361 |
25.0 |
56,042 |
23.0 |
|
45 to 54 years |
323,503 |
14.4 |
64,214 |
17.3 |
18,665 |
16.8 |
1,191 |
12.6 |
43,729 |
17.9 |
|
55 to 64 years |
148,249 |
6.6 |
37,792 |
10.2 |
9,886 |
8.9 |
470 |
5.0 |
27,034 |
11.1 |
|
65 years and over |
21,604 |
1.0 |
8,062 |
2.2 |
1,511 |
1.4 |
24 |
0.3 |
6,457 |
2.6 |
|
Occupation: |
||||||||||
|
Managerial and professional |
123,596 |
5.5 |
26,391 |
7.1 |
6,364 |
5.7 |
269 |
2.9 |
19,338 |
7.9 |
|
Technical, sales and administrative support |
344,402 |
15.3 |
67,253 |
18.2 |
16,485 |
14.8 |
853 |
9.0 |
49,227 |
20.2 |
|
Service |
414,135 |
18.4 |
85,004 |
23.0 |
13,512 |
12.1 |
574 |
6.1 |
70,121 |
28.7 |
|
Farming, forestry and fishing |
59,050 |
2.6 |
9,979 |
2.7 |
4,197 |
3.8 |
356 |
3.8 |
5,245 |
2.1 |
|
Precision production, craft and repair |
366,112 |
16.3 |
57,254 |
15.5 |
27,805 |
25.0 |
1,887 |
20.0 |
26,577 |
10.9 |
|
Operators, fabricators and labourers |
925,515 |
41.1 |
122,005 |
33.0 |
42,074 |
37.8 |
5,431 |
57.6 |
72,286 |
29.6 |
|
Nature of injuries, illness: |
||||||||||
|
Sprains, strains |
959,163 |
42.6 |
133,538 |
36.1 |
38,636 |
34.7 |
5,558 |
58.9 |
87,152 |
35.7 |
|
Fractures |
136,478 |
6.1 |
55,335 |
15.0 |
21,052 |
18.9 |
1,247 |
13.2 |
32,425 |
13.3 |
|
Cuts, lacerations punctures |
202,464 |
9.0 |
10,431 |
2.8 |
2,350 |
2.1 |
111 |
1.2 |
7,774 |
3.2 |
|
Bruises, contusions |
211,179 |
9.4 |
66,627 |
18.0 |
17,173 |
15.4 |
705 |
7.5 |
48,062 |
19.7 |
|
Multiple injuries |
73,181 |
3.2 |
32,281 |
8.7 |
11,313 |
10.2 |
372 |
3.9 |
20,295 |
8.3 |
|
With fractures |
13,379 |
0.6 |
4,893 |
1.3 |
2,554 |
2.3 |
26 |
0.3 |
2,250 |
0.9 |
|
With sprains |
26,969 |
1.2 |
15,991 |
4.3 |
4,463 |
4.0 |
116 |
1.2 |
11,309 |
4.6 |
|
Soreness, Pain |
127,555 |
5.7 |
20,855 |
5.6 |
5,614 |
5.0 |
529 |
5.6 |
14,442 |
5.9 |
|
Back pain |
58,385 |
2.6 |
8,421 |
2.3 |
2,587 |
2.3 |
214 |
2.3 |
5,520 |
2.3 |
|
All other |
411,799 |
18.3 |
50,604 |
13.7 |
15,012 |
13.5 |
897 |
9.5 |
33,655 |
13.8 |
|
Part of body affected: |
||||||||||
|
Head |
155,504 |
6.9 |
13,880 |
3.8 |
2,994 |
2.7 |
61 |
0.6 |
10,705 |
4.4 |
|
Eye |
88,329 |
3.9 |
314 |
0.1 |
50 |
0.0 |
11 |
0.1 |
237 |
0.1 |
|
Neck |
40,704 |
1.8 |
3,205 |
0.9 |
1,097 |
1.0 |
81 |
0.9 |
1,996 |
0.8 |
|
Trunk |
869,447 |
38.6 |
118,369 |
32.0 |
33,984 |
30.5 |
1,921 |
20.4 |
80,796 |
33.1 |
|
Back |
615,010 |
27.3 |
72,290 |
19.5 |
20,325 |
18.3 |
1,523 |
16.1 |
49,461 |
20.3 |
|
Shoulder |
105,881 |
4.7 |
16,186 |
4.4 |
4,700 |
4.2 |
89 |
0.9 |
11,154 |
4.6 |
|
Source of injury illness: |
||||||||||
|
Chemicals, chemical products |
43,411 |
1.9 |
22 |
0.0 |
— |
— |
— |
— |
16 |
0.0 |
|
Containers |
330,285 |
14.7 |
7,133 |
1.9 |
994 |
0.9 |
224 |
2.4 |
5,763 |
2.4 |
|
Furniture, fixtures |
88,813 |
3.9 |
7,338 |
2.0 |
881 |
0.8 |
104 |
1.1 |
6,229 |
2.6 |
|
Machinery |
154,083 |
6.8 |
4,981 |
1.3 |
729 |
0.7 |
128 |
14 |
4,035 |
1.7 |
|
Parts and materials |
249,077 |
11.1 |
6,185 |
1.7 |
1,016 |
0.9 |
255 |
2.7 |
4,793 |
2.0 |
|
Worker motion or position |
331,994 |
14.7 |
— |
— |
— |
— |
— |
— |
— |
— |
|
Floor, ground surfaces |
340,159 |
15.1 |
318,176 |
86.0 |
98,207 |
88.3 |
7,705 |
81.7 |
208,765 |
85.5 |
|
Handtools |
105,478 |
4.7 |
727 |
0.2 |
77 |
0.1 |
41 |
0.4 |
600 |
0.2 |
|
Vehicles |
157,360 |
7.0 |
9,789 |
2.6 |
3,049 |
2.7 |
553 |
5.9 |
6,084 |
2.5 |
|
Health care patient |
99,390 |
4.4 |
177 |
0.0 |
43 |
0.0 |
8 |
0.1 |
90 |
0.0 |
|
All other |
83,813 |
3.7 |
15,584 |
4.2 |
6,263 |
5.6 |
414 |
4.4 |
7,741 |
3.2 |
|
Industry division: |
||||||||||
|
Agriculture, forestry and fishing2 |
44,826 |
2.0 |
8,096 |
2.2 |
3,636 |
3.3 |
301 |
3.2 |
3,985 |
1.6 |
|
Mining3 |
21,090 |
0.9 |
3,763 |
1.0 |
1,757 |
1.6 |
102 |
1.1 |
1,874 |
0.8 |
|
Construction |
204,769 |
9.1 |
41,787 |
11.3 |
23,748 |
21.3 |
1,821 |
19.3 |
15,464 |
6.3 |
|
Manufacturing |
583,841 |
25.9 |
63,566 |
17.2 |
17,693 |
15.9 |
2,161 |
22.9 |
42,790 |
17.5 |
|
Transportation and public utilities3 |
232,999 |
10.3 |
38,452 |
10.4 |
14,095 |
12.7 |
1,797 |
19.0 |
21,757 |
8.9 |
|
Wholesale trade |
160,934 |
7.1 |
22,677 |
6.1 |
8,119 |
7.3 |
1,180 |
12.5 |
12,859 |
5.3 |
|
Retail trade |
408,590 |
18.1 |
78,800 |
21.3 |
15,945 |
14.3 |
1,052 |
11.1 |
60,906 |
24.9 |
|
Finance, insurance and real estate |
60,159 |
2.7 |
14,769 |
4.0 |
5,353 |
4.8 |
112 |
1.2 |
9,167 |
3.8 |
|
Services |
535,386 |
23.8 |
98,201 |
26.5 |
20,920 |
18.8 |
907 |
9.6 |
75,313 |
30.9 |
|
Number of days away from work: |
||||||||||
|
Cases involving 1 day |
366,054 |
16.3 |
48,550 |
13.1 |
12,450 |
11.2 |
1,136 |
12.0 |
34,319 |
14.1 |
|
Cases involving 2 days |
291,760 |
13.0 |
42,912 |
11.6 |
11,934 |
10.7 |
1,153 |
12.2 |
29,197 |
12.0 |
|
Cases involving 3-5 days |
467,001 |
20.7 |
72,156 |
19.5 |
20,167 |
18.1 |
1,770 |
18.8 |
49,329 |
20.2 |
|
Cases involving 6-10 days |
301,941 |
13.4 |
45,375 |
12.3 |
13,240 |
11.9 |
1,267 |
13.4 |
30,171 |
12.4 |
|
Cases involving 11-20 days |
256,319 |
11.4 |
44,228 |
11.9 |
13,182 |
11.8 |
1,072 |
11.4 |
29,411 |
12.0 |
|
Cases involving 21-30 days |
142,301 |
6.3 |
25,884 |
7.0 |
8,557 |
7.7 |
654 |
6.9 |
16,359 |
6.7 |
|
Cases involving 31 or more days |
427,215 |
19.0 |
91,008 |
24.6 |
31,737 |
28.5 |
2,381 |
25.2 |
55,329 |
22.7 |
|
Median days away from work |
6 days |
7 days |
10 days |
8 days |
7 days |
|||||
1 Days away from work cases include those which result in days away from work with or without restricted work activity.
2 Excludes farms with fewer than 11 employees.
3 Data conforming to OSHA definitions for mining operators in coal, metal, and nonmetal mining and for employers in railroad transportation are provided to BLS by the Mine Safety and Health Administration, U.S. Department of Labor; the Federal Railroad Administration and U.S. Department of Transportation. Independent mining contractors are excluded from the coal, metal, and nonmetal mining industries.
NOTE: Because of rounding and data exclusion of nonclassifiable responses, data may not sum to the totals. Dashes indicate data that do not meet publication guidelines. The survey estimates of occupational injuries and illnesses are based on a scientifically selected sample of employers. The sample used was one of many possible samples, each of which could have produced different estimates. The relative standard error is a measure of the variation in the sample estimates across all possible samples that could have been selected. The percent relative standard errors for the estimates included here range from less than 1 per cent to 58 per cent.
Survey of Occupational Injuries and Illnesses, Bureau of Labor Statistics, US Department of Labor, April 1995.
It is clear that data such as these can have an important impact upon development of programmes for work-related accident and disease prevention. Even so, they do not indicate which occupations or industries are the most hazardous, since some very dangerous occupations may have small numbers of workers. Determination of levels of risk associated with particular occupations and industries is explained in the accompanying article “Risk analysis of nonfatal workplace injuries and illnesses”.
Risk Analysis of Nonfatal Workplace Injuries and Illnesses
The United States Bureau of Labor Statistics routinely classifies nonfatal workplace injuries and illnesses by worker and case characteristics, using data from the US Survey of Occupational Injuries and Illnesses. While these counts identify groups of workers who experience large numbers of workplace injuries, they do not measure risk. Thus a particular group may sustain many workplace injuries simply because of the large number of workers in that group, and not because the jobs performed are especially hazardous.
In order to quantify actual risk, data on workplace injuries must be related to a measure of exposure to risk, such as number of hours worked, a labour supply measure which may be available from other surveys. The rate of nonfatal workplace injuries for a group of workers may be calculated by dividing the number of injuries recorded for that group by the number of hours worked during the same time period. The rate obtained this way represents the risk of injury per hour of work:
![]()
A convenient way of comparing the risk of injury among various groups of workers is to compute the relative risk:
![]()
The reference group may be a special group of workers, such as all managerial and professional specialty workers. Alternatively, it might consist of all workers. In any case, the relative risk (RR) corresponds to the rate ratio commonly used in epidemiological studies (Rothman 1986). It is algebraically equivalent to the percentage of all injuries which occur to the special group divided by the percentage of hours accounted for by the special group. When the RR is greater than 1.0, it indicates that members of the selected group are more likely to sustain injuries than members of the reference group; when the RR is less than 1.0, it indicates that, on the average, members of this group experience fewer injuries per hour.
The following tables show how indexes of relative risk for different groups of workers can identify those at greatest risk of workplace injury. The injury data are from the 1993 Survey of Occupational Injuries and Illnesses (BLS 1993b) and measure the number of injuries and illnesses with days away from work. The calculation relies upon estimates of annual hours worked taken from the microdata files of the US Bureau of the Census Current Population Surveys for 1993, which is obtained from household surveys (Bureau of the Census 1993).
Table 1 presents data by occupation on the share of workplace injuries, the share of hours worked and their ratio, which is the RR for injuries and illnesses with days away from work. The reference group is taken to be “All nonfarm private industry occupations” with workers of age 15 and older, which comprises 100%. As an example, the group “Operators, fabricators and labourers” experienced 41.64% of all injuries and illnesses, but contributed only 18.37% of the total hours worked by the reference population. Therefore, the RR for “Operators, fabricators and labourers” is 41.64/18.37 = 2.3. In other words, workers in this group of occupations have on average 2.3 times the injury/illness rate of all nonfarm private industry workers combined. Furthermore, they are about 11 times as likely to sustain a serious injury as employees in a managerial or professional specialty.
Table 1. Risk of occupational injuries and illnesses
|
Occupation |
Percentage1 |
Index |
|
|
Injury and illness cases |
Hours worked |
||
|
All nonfarm private industry occupations |
100.00 |
100.00 |
1.0 |
|
Managerial and professional specialty |
5.59 |
24.27 |
0.2 |
|
Executive, administrative and managerial |
2.48 |
13.64 |
0.2 |
|
Professional specialty |
3.12 |
10.62 |
0.3 |
|
Technical, sales and administrative support |
15.58 |
32.19 |
0.5 |
|
Technicians and related support |
2.72 |
3.84 |
0.7 |
|
Sales occupations |
5.98 |
13.10 |
0.5 |
|
Administrative support, including clerical |
6.87 |
15.24 |
0.5 |
|
Service occupations2 |
18.73 |
11.22 |
1.7 |
|
Protective service3 |
0.76 |
0.76 |
1.0 |
|
Service occupations, except protective service |
17.97 |
10.46 |
1.7 |
|
Farming, forestry and fishing occupations4 |
1.90 |
0.92 |
2.1 |
|
Precision production, craft and repair |
16.55 |
13.03 |
1.3 |
|
Mechanics and repairers |
6.30 |
4.54 |
1.4 |
|
Construction trades |
6.00 |
4.05 |
1.5 |
|
Extractive occupations |
0.32 |
0.20 |
1.6 |
|
Precision production occupations |
3.93 |
4.24 |
0.9 |
|
Operators, fabricators and labourers |
41.64 |
18.37 |
2.3 |
|
Machine operators, assemblers and inspectors |
15.32 |
8.62 |
1.8 |
|
Transportation and material moving occupations |
9.90 |
5.16 |
1.9 |
|
Handlers, equipment cleaners, helpers and laborers |
16.42 |
4.59 |
3.6 |
1 Percentage of injuries and illnesses, hours worked and index of relative risk for occupational injuries and illnesses with days away from work, by occupation, US nonfarm private industry employees 15 years and over, 1993.
2 Excludes private household workers and protective service workers in the public sector
3 Excludes protective service workers in the public sector
4 Excludes workers in agricultural production industries
Sources: BLS Survey of Occupational Injuries and Illnesses, 1993; Current Population Survey, 1993.
The various occupational groups may be ranked according to degree of risk simply by comparing their RR indices. The highest RR in the table (3.6) is associated with “handlers, equipment cleaners, helpers and labourers”, while the group at lowest risk is managerial and professional specialty workers (RR = 0.2). More refined interpretations may be made. While the table suggests that workers with lower levels of skills are in jobs with higher risks of injury and illness, even among blue-collar occupations the injury and illness rate is higher for less-skilled operators, fabricators and labourers compared to precision production, craft and repair workers.
In the above discussion, the RRs have been based upon all injuries and illnesses with days away from work, since these data have long been readily available and understood. Using the extensive and newly developed coding structure of the Survey of Occupational Injuries and Illnesses, researchers may now examine specific injuries and illnesses in detail.
As an example, table 2 shows the RR for the same set of occupation groupings, but restricted to the single outcome “Repetitive Motion Conditions” (event code 23) with days away from work, by occupation and gender. Repetitive motion conditions include carpal tunnel syndrome, tendonitis and certain strains and sprains. The group most severely affected by this type of injury is quite clearly female machine operators, assemblers and inspectors (RR = 7.3), followed by female handlers, equipment cleaners, helpers and labourers (RR = 7.1).
Table 2. Index of relative risk for repetitive motion conditions with days away from work, by occupation and gender, US nonfarm private industry employees 15 years and over, 1993
|
Occupation |
All |
Men |
Women |
|
All nonfarm private industry occupations |
1.0 |
0.6 |
1.5 |
|
Managerial and professional specialty |
0.2 |
0.1 |
0.3 |
|
Executive, administrative and managerial |
0.2 |
0.0 |
0.3 |
|
Professional specialty |
0.2 |
0.1 |
0.3 |
|
Technical, sales and administrative support |
0.8 |
0.3 |
1.1 |
|
Technicians and related support |
0.6 |
0.3 |
0.8 |
|
Sales occupations |
0.3 |
0.1 |
0.6 |
|
Administrative support, including clerical |
1.2 |
0.7 |
1.4 |
|
Service occupations1 |
0.7 |
0.3 |
0.9 |
|
Protective service2 |
0.1 |
0.1 |
0.4 |
|
Service occupations, except protective service |
0.7 |
0.4 |
0.9 |
|
Farming, forestry and fishing occupations3 |
0.8 |
0.6 |
1.8 |
|
Precision production, craft and repair |
1.0 |
0.7 |
4.2 |
|
Mechanics and repairers |
0.7 |
0.6 |
2.4 |
|
Construction trades |
0.6 |
0.6 |
— |
|
Extractive occupations |
0.1 |
0.1 |
— |
|
Precision production occupations |
1.8 |
1.0 |
4.6 |
|
Operators, fabricators and laborers |
2.7 |
1.4 |
6.9 |
|
Machine operators, assemblers and inspectors |
4.1 |
2.3 |
7.3 |
|
Transportation and material moving occupations |
0.5 |
0.5 |
1.6 |
|
Handlers, equipment cleaners, helpers and laborers |
2.4 |
1.4 |
7.1 |
1 Excludes private household workers and protective service workers in the public sector
2 Excludes protective service workers in the public sector
3 Excludes workers in agricultural production industries
Note: Long dashes — indicate that data do not meet publication guidelines.
Source: Calculated from the BLS Survey of Occupational Injuries and Illnesses, 1993, and Current Population Survey, 1993.
The table shows striking differences in the risk of repetitive motion conditions that depend on the gender of the worker. Overall, a woman is 2.5 times as likely as a man to lose work due to repetitive motion illness (2.5 = 1.5/0.6). However, this difference does not simply reflect a difference in the occupations of men and women. Women are at higher risk in all of the major occupational groups, as well as the less aggregated occupational groupings reported in the table. Their risk relative to men is especially high in sales and blue-collar occupations. Women are six times as likely as men to lose work time from repetitive motion injuries in sales and in precision production, craft and repair occupations.
Case Study: Worker Protection and Statistics on Accidents and Occupational Diseases - HVBG, Germany
The German Berufsgenossenschaften (BG)
Under the social insurance system in Germany, statutory accident insurance covers the results of accidents at work and accidents on the way to and from work, as well as occupational diseases. This statutory accident insurance is organized into three areas:
- industrial accident insurance (represented by the BGs)
- agricultural accident insurance
- public sector’s own accident insurance scheme.
The 35 Berufsgenossenschaften (BG) cover the various branches of the industrial economy in Germany. They are responsible for 39 million employees insured in 2.6 million enterprises. Every person in a work, service or training position is insured, regardless of age, sex or income level. Their umbrella organization is the Central Federation of the Berufsgenossenschaften (HVBG).
By law, the BG is responsible for using all appropriate means to prevent workplace accidents and occupational diseases, to provide effective first aid and optimal medical, occupational and social rehabilitation, and to pay benefits to the injured and sick, and to survivors. Thus prevention, rehabilitation and compensation are all under one roof.
The premiums to finance these benefits are paid exclusively by the employers. In 1993 all industrial employers paid on average DM 1.44 to the BG for every DM 100 wages, or 1.44%. In all, the premiums came to DM 16 billion (US billion used—one thousand million), of which about 80% was spent for rehabilitation and pensions. The remainder was used primarily for prevention programmes.
Occupational Safety and Health Protection
The employer is responsible for the health and safety of the employee at work. The legal scope of this responsibility is set by government in laws and ordinances, and in the protective labour regulations of the industrial BGs, which complete and concretize governmental protective labour law for each branch of industry. The system of prevention of the BGs is notable for its orientation to actual practice, its constant adaptation to the needs of the industry and to the state of technology, as well as for its effective support of the employer and the employee.
The BGs’ tasks of prevention, which are primarily carried out by the Technical Inspection Service (TAD) of the BG and the Occupational Medical Service (AMD), include:
- advising and motivating the employer
- supervising industrial occupational protective measures
- occupational medical care
- informing and training company staff
- safety checking on appliances and equipment
- initiating, carrying out and financing research.
Responsibility for implementing industrial occupational protection lies with the employer, who is legally obliged to hire appropriately qualified personnel to assist in occupational protection. These are specialists in work safety (safety officers, safety technicians and safety engineers) and company doctors. In companies with more than 20 employees, one or more safety representatives must be hired. The scope of the responsibility of the company for occupational safety specialists and company doctors is set by trade association regulations that are specific to the branch of industry and degree of hazard. In companies where an occupational safety specialist or a company doctor is employed, the employer must organize an occupational safety committee, made up of one company representative, two workers’ representatives, the company doctor, and occupational safety specialists and safety representatives. First-aid personnel, whose training is directed by the BG, also belong to the company occupational safety organization.
Occupational medical care has a special significance. Every employee who is at risk for a specific type of health threat at the workplace is examined in a uniform manner, and the results of the examination are assessed according to stated guidelines. In 1993 approximately four million occupational preventive medical examinations were carried out by specially authorized doctors. Lasting health concerns were ascertained in less than 1% of the examinations.
Employees who work with hazardous/carcinogenic materials also have a right to be medically examined even after the hazardous activity has been completed. The BGs have established services to be able to examine these employees. There are now three such services:
- Organizational Service for On-going Examinations (ODIN)
- Central Registration Service for Asbestos Dust-Endangered Employees (ZAs)
- Wismut Central Care Office (ZeBWis).
The three services cared for approximately 600,000 people in 1993. Collecting examination data assists in individual care and also helps improve scientific research for early detection of cancer cases.
Statistics on Workplace Accidents
Goal. The primary goal of collecting statistics on workplace accidents is to improve workplace safety by assessing and interpreting data on accident occurrences. These data are compiled from reports on workplace accidents; 5% to 10% of the accidents (approximately 100,000 accidents) are investigated each year by the Technical Inspection Services of the BGs.
Employers’ reporting responsibility. Every employer is obliged to report a workplace accident to his responsible BG within three days if the accident results in an incapacity to work for three calendar days or causes the death of the insured (“legally reportable workplace accident”). This includes accidents going to or from work. Accidents that cause only property damage or prevent the injured person from working for less than three days do not have to be reported. For reportable workplace accidents, a form “Accident Notification” (figure 1) is submitted by the employer. The time away from work is the significant factor for reporting purposes, regardless of the seriousness of the injury. Accidents that appear harmless must be reported if the injured person cannot work for longer than three days. This three-day requirement facilitates pursuing later claims. Failure to file an accident report, or filing one late, constitutes a violation of regulations that can be punished by the BG with a monetary fine of up to DM 5,000.
Figure 1. An example of an accident notification form
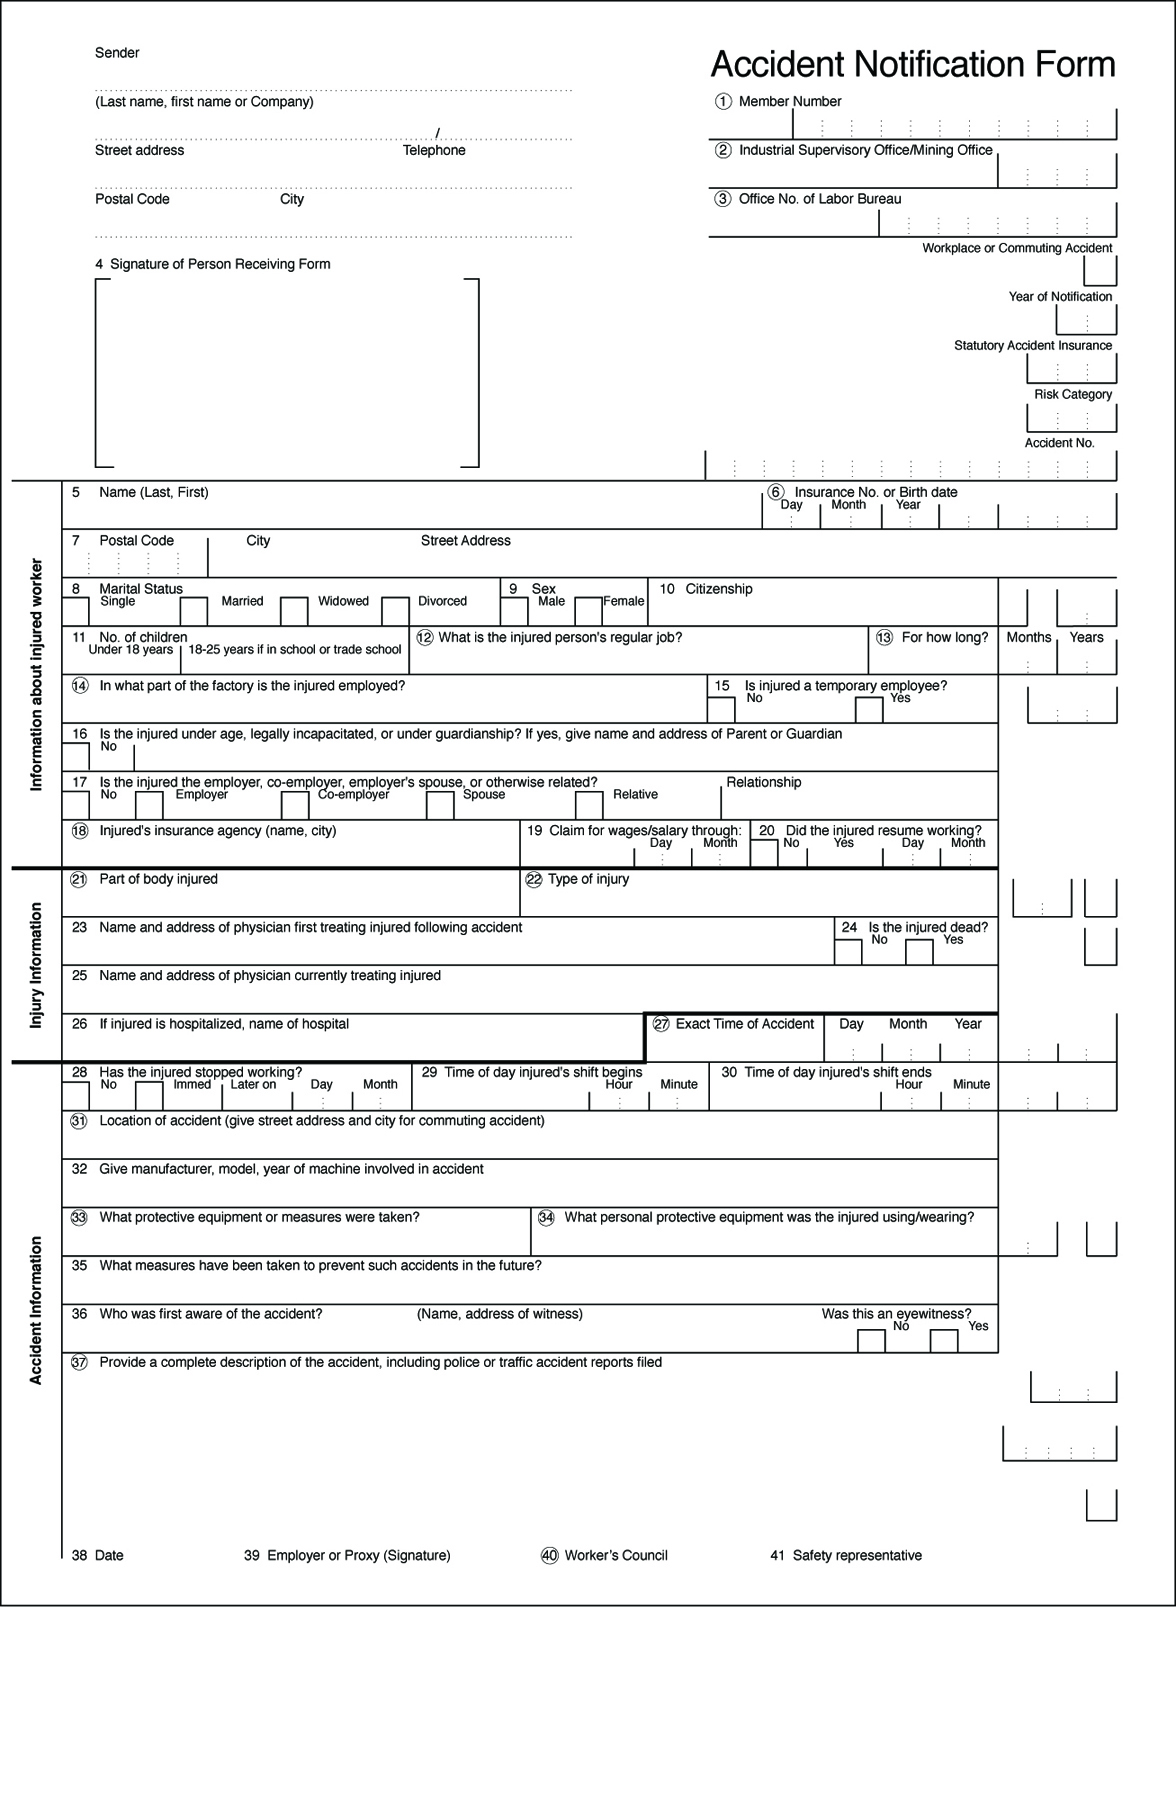
Notification by the attending physician. To optimize medical rehabilitation and to determine how long the employee is unable to work, the injured person receives treatment from a medical specialist selected for this work. The doctor is paid by the responsible industrial BG. Thus, the BG also receives notification of reportable workplace injuries from the doctor if the employer has failed to (promptly) file an accident report. The BG can then request the employer to file a workplace accident notification. This dual reporting system (employer and doctor) assures the BG of receiving knowledge of practically all reportable workplace accidents.
Using the information on the accident notification report and the medical report, the BG checks whether the accident is, in the legal sense, a workplace accident within its jurisdictional competence. On the basis of the medical diagnosis, the BG can, if needed, proceed immediately to ensuring optimal treatment.
A correct and complete description of the circumstances of the accident is especially important for prevention. This enables the BG’s Technical Inspection Service to draw conclusions about defective machinery and equipment that require immediate action to avoid further similar accidents. In the case of serious or fatal workplace accidents, regulations require the employer to immediately notify the BG. These occurrences are immediately investigated by the BG’s occupational safety experts.
In calculating a company’s premium, the BG takes into account the number and cost of workplace accidents that have taken place at this company. A bonus/malus procedure set by law is used in the calculation, and a portion of the company’s premium is determined by the company’s accident trend. This can lead to a higher or lower premium, thus creating financial incentives for employers to maintain safe workplaces.
Collaboration of the employees’ representatives and the safety representatives. Any accident report must also be signed by the workers’ council (Betriebsrat) and by the safety representatives (if these exist). The purpose of this rule is to inform the workers’ council and the safety representatives of the company’s overall accident situation, so that they can effectively exercise their collaborative rights in questions of workplace safety.
Compiling workplace accident statistics. On the basis of the information that the BG receives on a workplace accident from the accident report and the doctor’s report, the accounts are translated into statistical code numbers. The coding covers three areas, among others:
- description of the injured (age, sex, job)
- description of the injury (location of injury, type of injury)
- description of the accident (location, object causing the accident and circumstances of the accident).
Coding is performed by highly trained data specialists who are familiar with the organization of BG industries, utilizing a list of accident and injury codes which contains over 10,000 entries. In order to achieve the highest quality statistics, the classifications are regularly reworked, in order, for example, to adapt them to new technological developments. Furthermore, coding personnel are periodically retrained, and the data are subject to formal-logical and content-sensitive tests.
Uses of workplace accident statistics
An important task of these statistics is to describe the circumstances of the accident at the workplace. Table 1 portrays trends in reportable workplace accidents, new accident pension cases and fatal workplace accidents between 1981 and 1993. Column 3 (“New pension cases”) shows cases for which, because of the seriousness of the accident, a pension payment was first made by the industrial BGs in the given year.
Table 1. Occurrences of workplace accidents, Germany, 1981-93
|
Year |
Workplace accidents |
||
|
Reportable accidents |
New pension cases |
Deaths |
|
|
1981 |
1,397,976 |
40,056 |
1,689 |
|
1982 |
1,228,317 |
39,478 |
1,492 |
|
1983 |
1,144,814 |
35,119 |
1,406 |
|
1984 |
1,153,321 |
34,749 |
1,319 |
|
1985 |
1,166,468 |
34,431 |
1,204 |
|
1986 |
1,212,064 |
33,737 |
1,069 |
|
1987 |
1,211,517 |
32,537 |
1,057 |
|
1988 |
1,234,634 |
32,256 |
1,130 |
|
1989 |
1,262,374 |
30,840 |
1,098 |
|
1990 |
1,331,395 |
30,142 |
1,086 |
|
1991 |
1,587,177 |
30,612 |
1,062 |
|
1992 |
1,622,732 |
32,932 |
1,310 |
|
1993 |
1,510,745 |
35,553 |
1,414 |
Source: Central Federation of Berufsgenossenschaften (HVBG), Germany.
To judge the average accident risk of an insured, the number of workplace accidents is divided by the actual time worked, to produce an accident rate. The rate per one million hours worked is used for comparison internationally and across years. Figure 2 shows how this rate varied between 1981 and 1993.
Figure 2. Frequency of workplace accidents
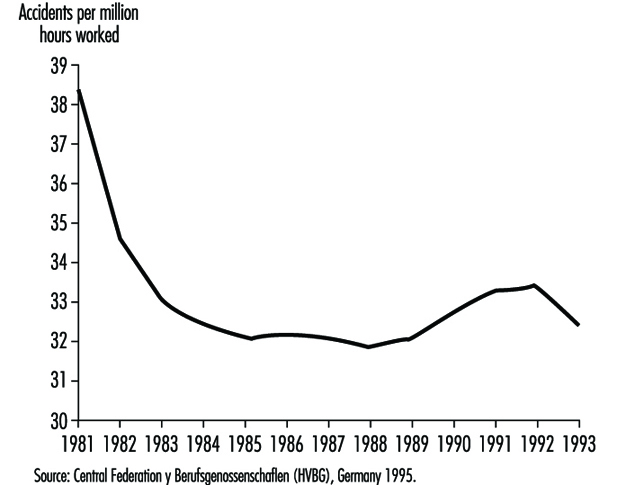
Industry-specific accident statistics. In addition to describing general trends, workplace statistics can be broken down by industry. For example, one might ask, “How many workplace accidents with portable grinders in the metalworking trade were there in the last few years; how and where did they take place; and what injuries resulted?” Such analyses may be useful to many people and institutions, such as government ministries, supervisory officials, research institutes, universities, businesses and workplace safety experts (table 2).
Table 2. Workplace accidents with portable grinders in metalworking, Germany, 1984-93
|
Year |
Reportable accidents |
New accident pensions |
|
1984 |
9,709 |
79 |
|
1985 |
10,560 |
62 |
|
1986 |
11,505 |
76 |
|
1987 |
11,852 |
75 |
|
1988 |
12,436 |
79 |
|
1989 |
12,895 |
76 |
|
1990 |
12,971 |
78 |
|
1991 |
19,511 |
70 |
|
1992 |
17,180 |
54 |
|
1993 |
17,890 |
70 |
Source: Central Federation of Berufsgenossenschaften (HVBG), Germany.
For example, table 2 shows that reportable workplace accidents with portable grinders in metalworking rose continuously from the middle of the 1980s to 1990. From 1990 to 1991 a considerable increase in the accident figures is to be noted. This is an artefact resulting from the inclusion, beginning in 1991, of figures encompassing the new borders of reunited Germany. (The earlier figures cover only the Federal Republic of Germany.)
Other data compiled from accident reports reveal that not all accidents with metalworking portable grinders take place primarily in companies in the metalworking industry. Portable grinders, which of course are often used as angle grinders to cut pipes, iron bars and other objects, are frequently employed on construction sites. Accordingly, nearly one-third of the accidents are concentrated in companies in the construction industry. Working with portable grinders in metalworking results mainly in head and hand injuries. The most common head injuries affect the eyes and the area surrounding the eyes, which are injured by broken pieces, splinters and flying sparks. The tool has a fast-spinning grinding wheel, and hand injuries result when the person using the portable machine loses control of it. The high number of eye injuries proves that the importance and obligation of wearing safety glasses while grinding metal with this portable machine must be emphasized within companies.
Comparison of accident rates within and between industries. Although in 1993 there were nearly 18,000 workplace accidents with portable grinders in metalworking, compared to only 2,800 workplace accidents with hand-held power saws in woodworking, one cannot automatically conclude that this machinery poses a greater risk to metalworkers. To assess accident risk for specific industries, the number of accidents must first be related to a measure of exposure to danger, such as hours worked (see “Risk analysis of nonfatal workplace injuries and illnesses” [REC05AE]). However, this information is not always available. Therefore, a surrogate rate is derived as the proportion which serious accidents make of all reportable accidents. Comparing the serious-injury proportions for portable grinders in metalworking and portable circular saws in woodworking demonstrates that portable circular saws have an accident seriousness rate ten times higher than portable grinders. For prioritizing workplace safety measures, this is an important finding. This type of comparative risk analysis is an important component of an overall industrial accident prevention strategy.
Occupational Disease Statistics
Definition and reporting
In Germany an occupational disease is legally defined as a disease whose cause can be traced to the occupational activity of the affected person. An official list of occupational diseases exists. Therefore, assessing whether a sickness constitutes an occupational disease is both a medical and legal question and is referred by public law to the BG. If an occupational disease is suspected, it is not sufficient to prove that the employee suffers from, for example, an eczema. Additional knowledge is required about substances used at work and their potential for harming the skin.
Compiling occupational disease statistics. Because the BGs are responsible for compensating workers with occupational diseases as well as for providing rehabilitation and prevention, they have a considerable interest in application of statistics derived from occupational disease reports. These applications include targeting preventive measures on the basis of identified high-risk industries and occupations, and also providing their findings to the public, the scientific community and political authorities.
To support these activities, the BGs introduced in 1975 a set of occupational disease statistics, which contain data on every occupational disease report and its final determination—whether recognized or denied—including the reasons for the decision at the level of the individual case. This data base contains anonymous data on:
- the person, such as sex, year of birth, nationality
- diagnosis
- hazardous exposures
- the legal decision, including outcome of claim, determination of disability and any further actions taken by the BGs.
Results of the occupational disease statistics. An important function of the occupational disease statistics is to track the occurrence of occupational diseases over time. Table 3 charts the notifications of suspected occupational disease, the number of recognized occupational disease cases overall and the payment of pensions, as well as the number of fatal cases between 1980 and 1993. It should be cautioned that these data are not easy to interpret, since definitions and criteria differ widely. Furthermore, during this time period the number of officially designated occupational diseases rose from 55 to 64. Also, the figures from 1991 encompass the new borders of reunited Germany, whereas the earlier ones cover the Federal Republic of Germany alone.
Table 3. Occurrences of occupational disease, Germany, 1980-93
|
Year |
Notifications |
Recognized occupational disease cases |
Of those with |
Occupational disease fatalities |
|
1980 |
40,866 |
12,046 |
5,613 |
1,932 |
|
1981 |
38,303 |
12,187 |
5,460 |
1,788 |
|
1982 |
33,137 |
11,522 |
4,951 |
1,783 |
|
1983 |
30,716 |
9,934 |
4,229 |
1,557 |
|
1984 |
31,235 |
8,195 |
3,805 |
1,558 |
|
1985 |
32,844 |
6,869 |
3,439 |
1,299 |
|
1986 |
39,706 |
7,317 |
3,317 |
1,548 |
|
1987 |
42,625 |
7,275 |
3,321 |
1,455 |
|
1988 |
46,280 |
7,367 |
3,660 |
1,363 |
|
1989 |
48,975 |
9,051 |
3,941 |
1,281 |
|
1990 |
51,105 |
9,363 |
4,008 |
1,391 |
|
1991 |
61,156 |
10,479 |
4,570 |
1,317 |
|
1992 |
73,568 |
12,227 |
5,201 |
1,570 |
|
1993 |
92,058 |
17,833 |
5,668 |
2,040 |
Source: Central Federation of Berufsgenossenschaften (HVBG), Germany.
Example: infectious diseases. Table 4 shows the decline in the number of recognized cases of infectious diseases during the period 1980 to 1993. It specifically singles out viral hepatitis, for which one can clearly see that a strongly declining trend developed from approximately the mid-1980s in Germany, when employees at risk in the health service were given preventive inoculations. Thus occupational disease statistics can serve not only to find high rates of illnesses, but can also document the successes of protective measures. Declines in disease rates may of course have other explanations. In Germany, for example, the reduction in the number of cases of silicosis during the past two decades is chiefly a result of the decline in the number of jobs in mining.
Table 4. Infectious diseases recognized as occupational diseases, Germany, 1980-93
|
Year |
Total recognized cases |
Of those: hepatitis viral |
|
1980 |
1173 |
857 |
|
1981 |
883 |
736 |
|
1982 |
786 |
663 |
|
1983 |
891 |
717 |
|
1984 |
678 |
519 |
|
1985 |
417 |
320 |
|
1986 |
376 |
281 |
|
1987 |
224 |
152 |
|
1988 |
319 |
173 |
|
1989 |
303 |
185 |
|
1990 |
269 |
126 |
|
1991 |
224 |
121 |
|
1992 |
282 |
128 |
|
1993 |
319 |
149 |
Source: Central Federation of Berufsgenossenschaften (HVBG), Germany.
Sources of Information
The HVBG, as umbrella organization for the BGs, centralizes the common statistics and produces analyses and brochures. Furthermore, the HVBG sees statistical information as an aspect of the overall information that must be available to carry out the broad range of mandated responsibilities of the accident insurance system. For this reason, the Central Information System of the BGs (ZIGUV) was formed in 1978. It prepares relevant literature and makes it available to the BGs.
Workplace safety as an interdisciplinary, comprehensive approach requires optimum access to information. The BGs in Germany have resolutely taken this path and thereby made a considerable contribution to the efficient workplace safety system in Germany.
Case study: Wismut - A Uranium Exposure Revisited
Historical Development
The Erz mountains have been mined since the twelfth century, and beginning in 1470 silver mining brought the area to prominence. Around the year 1500 the first reports of a specific disease among miners appeared in Agricola’s writings. In 1879 this disease was recognized by Haerting and Hesse as lung cancer, but at that time what caused it was not clear. In 1925 “Schneeberg lung cancer” was added to the list of occupational diseases.
The material from which Marie Curie isolated the elements radium and polonium came from the slag heap of the Joachimstal (Jachymov) in Bohemia. In 1936 Rajewsky’s radon measurements near Schneeberg confirmed the already assumed connection between radon in the mining shafts and lung cancer.
In 1945 the Soviet Union intensified its atomic weapons research programme. The search for uranium was extended to the Erz Mountains, as the conditions for mining were better there than in the Soviet deposits. After initial inquiries, the whole area was placed under Soviet military administration and declared a restricted zone.
From 1946 to 1990 the Soviet Wismut Company (SAG), later the Soviet-German Wismut Company (SDAG), carried out uranium mining in Thuringia and Saxony (figure 1). At the time the Soviet Union was under pressure to obtain sufficient quantities of uranium to construct the first Soviet atomic bomb. Appropriate equipment was not available, so achieving the necessary level of uranium production was possible only by disregarding safety measures. Working conditions were especially bad in the years 1946 to 1954. According to an SAG Wismut health report, 1,281 miners had fatal accidents and 20,000 suffered injuries or other detrimental effects to their health just in the second half of 1949.
Figure 1. Mining areas of SDAG Wismut in East Germany
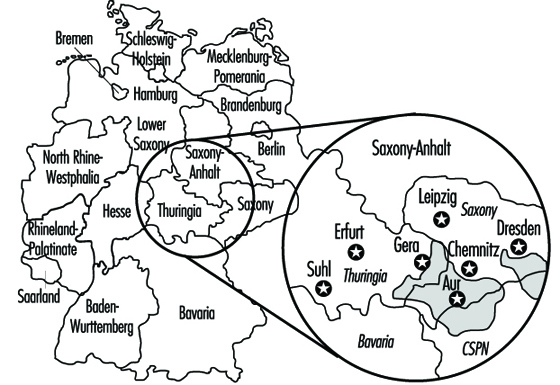
In post-war Germany, the Soviet Union considered uranium mining a form of reparations. Prisoners, conscripts and “volunteers” were mobilized, but at first there were hardly any skilled personnel. In all, Wismut employed between 400,000 and 500,000 people (figure 2).
Figure 2. Wismut employees 1946-90
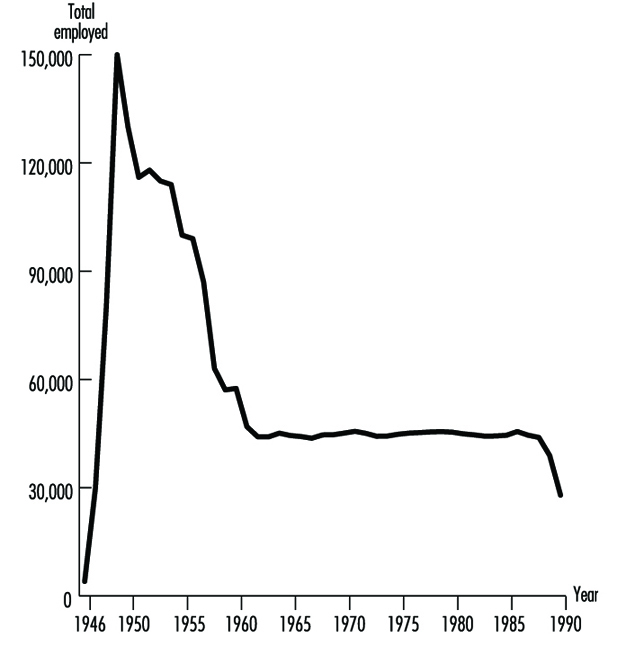
Bad working conditions, the lack of suitable technology and intense work pressure led to extremely high numbers of accidents and illnesses. The working conditions gradually improved beginning in 1953, when German participation in the Soviet company began.
Dry-drilling, which produced high levels of dust, was employed from 1946 to 1955. No artificial ventilation was available, resulting in high radon concentrations. In addition, the workers’ health was adversely affected by the extremely heavy labour due to the lack of equipment, the lack of safety gear and long work shifts (200 hours per month).
Figure 3. Exposure records of former SDAG Wismut

The exposure level varied over time and from shaft to shaft. The systematic measurement of the exposure also ensued in different phases, as is shown in figure 3. The exposures to ionizing radiation (shown in Working Level Months (WLM)) can be given only very roughly (table 1). Today, comparisons with radiation-exposure situations in other countries, measurements made under experimental conditions and assessments of written records permit a more precise statement of the exposure level.
Table 1. Estimates of radiation exposure (Working Level Months/Year) in the Wismut mines
|
Year |
WLM/Year |
|
1946–1955 |
30–300 |
|
1956–1960 |
10–100 |
|
1961–1965 |
5–50 |
|
1966–1970 |
3–25 |
|
1971–1975 |
2–10 |
|
1976–1989 |
1–4 |
In addition to intensive exposure to rock dust, other factors relevant to illnesses were present, such as uranium dust, arsenic, asbestos and emissions from explosives. There were physical effects from noise, hand-arm vibrations and whole-body vibrations. Under these conditions, silicoses and radiation-related bronchial carcinomas dominate the record of occupational diseases from 1952 to 1990 (table 2).
Table 2. Comprehensive overview of known occupational diseases in Wismut uranium mines 1952-90
|
List No. BKVO 1 |
Absolute number |
% |
|
|
Diseases due to quartz |
40 |
14,733 |
47.8 |
|
Malignant tumours or pretumours from ionizing radiation |
92 |
5,276 |
17.1 |
|
Diseases due to partial body vibration |
54 |
— |
— |
|
Diseases of tendons and extremity joints |
71–72 |
4,950 |
16.0 |
|
Impaired hearing due to noise |
50 |
4,664 |
15.1 |
|
Skin diseases |
80 |
601 |
1.9 |
|
Other |
— |
628 |
2.1 |
|
Total |
30,852 |
100 |
1 Occupational disease classification of the former GDR.
Source: Wismut Health System Annual Reports.
Although over time the health services of SAG/SDAG Wismut provided increasing levels of comprehensive care for the miners, including annual medical examinations, the effects on health of extracting the ore were not systematically analysed. Production and working conditions were kept strictly secret; the Wismut companies were autonomous and organizationally were a “state within a state”.
The full magnitude of the events became known only in 1989-90 with the end of the German Democratic Republic (GDR). In December 1990 uranium mining was discontinued in Germany. Since 1991 the Berufsgenossenschaften (preventing, recording and compensating industrial and trade associations), as the statutory accident insurance carrier have been responsible for recording and compensating all accidents and occupational diseases related to the former Wismut operation. This means that the associations are responsible for providing affected individuals with the best possible medical care and for collecting all relevant occupational health and safety information.
In 1990, approximately 600 claims for bronchial carcinoma were still pending with the Wismut social insurance system; some 1,700 cases of lung cancer had been turned down in earlier years. Since 1991 these claims have been pursued or reopened by the responsible Berufsgenossenschaften. On the basis of scientific projections (Jacobi, Henrichs and Barclay 1992; Wichmann, Brüske-Hohlfeld and Mohner 1995), it is estimated that in the next ten years between 200 and 300 cases of bronchial carcinomas per year will be recognized as resulting from working at Wismut.
The Present: After the Change
The production and working conditions at SDAG Wismut left their mark on both the employees and the environment in Thuringia and Saxony. In accordance with the law of the Federal Republic of Germany, the federal government took over responsibility for cleaning up the environment in the affected region. The costs of these activities for the period 1991-2005 have been estimated at DM 13 billion.
After the GDR joined the Federal Republic of Germany in 1990, the Berufsgenossenschaften, as statutory accident insurance carriers, became responsible for managing occupational diseases in the former GDR. In light of the particular conditions at Wismut, the Berufsgenossenschaften decided to form a special unit to handle occupational safety and health for the Wismut complex. To the extent possible, while respecting legal regulations protecting the privacy of personal data, the Berufsgenossenschaften secured records on former working conditions. Thus when the company was dissolved for economic reasons all evidence that could possibly serve to substantiate the claims of employees in case of illness would not be lost. The “Wismut Central Care Office” (ZeBWis) was established by the Federation on 1 January 1992 and bears responsibility for occupational medical treatment, early detection and rehabilitation.
From ZeBWis’s goal of providing appropriate occupational medical care to former uranium mining employees, four essential health surveillance tasks emerged:
- organizing mass screening examinations for early diagnosis and treatment of diseases
- documenting the screening findings and linking them with data from the occupational disease detection procedures
- scientifically analysing the data
- support of research on early detection and treatment of disease.
Screening is provided to the exposed workers in order to assure early diagnosis whenever possible. Ethical, scientific and economic aspects of such screening procedures require a thorough discussion which is beyond the scope of this article.
A programme of occupational medicine was developed, based on the well-founded trade association principles for special occupational medical examinations. Integrated into this were examination methods known from mining and radiation protection. The component parts of the programme follow from the main agents of exposure: dust, radiation and other hazardous materials.
The ongoing medical surveillance of former Wismut employees is aimed primarily at early detection and treatment of bronchial carcinomas resulting from exposure to radiation or other carcinogenic materials. Whereas the connections between ionizing radiation and lung cancers are proven with adequate certainty, the effects on health of long-term, low-dosage radiation exposure have been less researched. Current knowledge is based on extrapolations of data from survivors of the atomic bombings of Hiroshima and Nagasaki, as well as data obtained from other international studies of uranium miners.
The situation in Thuringia and Saxony is exceptional in that significantly more people underwent a much broader range of exposures. Therefore, a wealth of scientific knowledge can be gained from this experience. To what degree radiation works synergistically with exposure to carcinogens like arsenic, asbestos or diesel motor emissions in causing lung cancer should be scientifically examined using newly obtained data. The early detection of bronchial carcinomas through the introduction of state-of-the-art examination techniques should be an important part of the prospective scientific research.
Available Data from the Wismut Health System
In response to the extreme accident and health problems it faced, Wismut established its own health service, which provided, among other things, annual medical screening examinations, including chest x rays. In later years additional occupational disease examination units were set up. Since the Wismut health service took over not only occupational medicine, but also full medical care for employees and their dependents, by 1990 SDAG Wismut had collected comprehensive health information on many former and current Wismut employees. In addition to complete information on the occupational medical examinations, and a complete archive of occupational diseases, a comprehensive x-ray archive exists with over 792,000 x rays.
In Stollberg the Wismut health system had a central pathology department in which comprehensive histological and pathological material was collected from the miners, as well as from the inhabitants of the area. In 1994 this material was given to the German Cancer Research Center (DKFZ) in Heidelberg for safekeeping and research purposes. A portion of the records of the former health system was first taken over by the statutory accident insurance system. For this purpose, ZeBWis established a temporary archive at Shaft 371 in Hartenstein (Saxony).
These records are used for processing insurance claims, for preparing and administering occupational medical care and for scientific study. In addition to being used by the Berufsgenossenschaften, the records are available to experts and to authorized physicians in the context of their clinical work with and management of each former employee.
The core of these archives consists of the complete files of occupational diseases (45,000) which were taken over, together with the corresponding occupational disease tracing files (28,000), the tracing files for monitoring dust-endangered persons (200,000), as well as targeted documentary records with the results of the occupational medical fitness and monitoring examinations. In addition, the autopsy records of Stollberg Pathology are kept in this ZeBWis archive.
These last-mentioned records, as well as the occupational disease tracing files, have in the meantime been prepared for data processing. Both these forms of documentation will be used for extracting data for a 60,000-person comprehensive epidemiological study by the federal ministry for the environment.
In addition to the data on exposure to radon and radon by-products, the records on the exposure of former employees to other agents are of special interest to the Berufsgenossenschaften. Thus the present-day Wismut GmbH has measurement results available for viewing, in list form, from the early 1970s to the present for silicogenic dusts, asbestos dusts, heavy metal dusts, wood dusts, explosives dusts, toxic vapours, welding fumes, diesel motor emissions, noise, partial- and whole-body vibrations and heavy physical labour. For the years 1987 to 1990 the individual measurements are archived in electronic media.
This is important information for retrospective analysis of the exposures in Wismut’s uranium mining operations. It also constitutes the basis for constructing a job-exposure matrix which assigns exposures to tasks for research purposes.
To round out the picture, further records are stored in the department that safeguards health data at Wismut GmbH, including: patient files of former out-patients, accident reports by the former company and by occupational safety inspections, clinical occupational medical records, biological exposure tests, occupational medical rehabilitation and neoplastic disease reports.
However, not all Wismut archives—primarily paper files—were designed for centralized evaluation. Thus, with the dissolution of SDAG Wismut on 31 December 1990, and the dissolution of the Wismut company health system, the question was posed of what to do with these unique records.
Digression: Incorporating the Holdings
The first task for ZeBWis was to define the people who worked underground or in the preparation plants and to determine their current location. The holdings comprise some 300,000 people. Few of the company’s records were in a form that could be used in data processing. Thus it was necessary to tread the wearisome path of viewing one card at a time. The card files from nearly 20 locations had to be collected.
The next step was to collect the vital statistics and addresses of these people. Information from old personnel and wage records was not useful for this. Old addresses were often no longer valid, in part because a blanket renaming of streets, squares and roads took place after the unification treaty was signed. The Central Inhabitant Registry of the former GDR was also not useful, as by this time the information was no longer complete.
Finding these people was eventually made possible with the assistance of the Association of German Pension Insurance Carriers, through which addresses for nearly 150,000 people were collected to communicate the offer of free occupational medical care.
To give the examining doctor an impression of the hazards and exposure that the patient was subject to from the so-called occupational or work case history a job-exposure matrix was constructed.
Occupational Medical Care
Approximately 125 specially trained occupational physicians with experience in diagnosing dust- and radiation-caused diseases were recruited for the examinations. They work under the direction of ZeBWis and are spread throughout the Federal Republic to ensure that the affected individuals can obtain the indicated examination near their current place of residence. Due to intensive training of the participating physicians, standard high-quality examinations are performed at all examination locations. By distributing uniform documentation forms ahead of time, it is ensured that all relevant information is collected according to set standards and is entered into ZeBWis’s data centres. By optimizing the number of files, every examining doctor carries out an adequate number of exams every year and thereby remains practised and experienced in the examination programme. Through regular exchange of information and continuing education, the physicians always have access to current information. All examining physicians are experienced in assessing chest x rays in accordance with the 1980 ILO guidelines (International Labour Organization 1980).
The data pool, which is growing as a result of the ongoing examinations, is geared to acquaint physicians and risk assessment experts in the occupational disease detection programme with relevant preliminary findings. It furthermore provides a basis for addressing specific symptoms or diseases that appear under defined risk situations.
The Future
Comparing the number of people who worked for Wismut underground and/or in preparation plants with the number who were employed in uranium mining in the Western world, it is evident that, even with big gaps, the data on hand present an extraordinary basis for gaining new scientific understanding. Whereas the 1994 overview by Lubin et al. (1994) on the risk of lung cancer covered approximately 60,000 affected individuals and about 2,700 cases of lung cancer in 11 studies, the data from some 300,000 former Wismut employees are now available. At least 6,500 have died to date from radiation-caused lung cancer. Furthermore, Wismut never collected the exposure information on a great number of persons exposed either to ionizing radiation or other agents.
As precise information as possible on exposure is necessary for optimal occupational disease diagnosis as well as for scientific research. This is taken into account in two research projects that are being sponsored or carried out by the Berufsgenossenschaften. A job-exposure matrix was prepared by consolidating available site measurements, analysing geological data, using information on production figures and, in some cases, reconstructing working conditions in the early years of Wismut. Data of this type are a prerequisite for developing a better understanding, through cohort studies or case-control studies, of the nature and extent of illnesses that result from uranium mining. Understanding the effect of long-term, low-level radiation doses and the cumulative effects of radiation, dust and other carcinogenic materials might also be improved in this manner. Studies of this are now beginning or are being planned. With the help of biological specimens that were collected in Wismut’s former pathology laboratories, scientific knowledge can also be obtained about the type of lung cancer and also about the interactive effects between silicogenic dusts and radiation, as well as other carcinogenic hazardous materials that are inhaled or ingested. Such plans are being pursued at this time by the DKFZ. Collaboration on this issue is now underway between the German research facilities and other research groups such as the US NIOSH and the National Cancer Institute (NCI). Corresponding work groups in countries like the Czech Republic, France and Canada are also cooperating in studying the exposure data.
To what extent malignancies other than lung cancer may develop from radiation exposure during uranium ore mining is poorly understood. At the request of the trade associations, a model of this was developed (Jacobi and Roth 1995) to establish under what conditions cancers of the mouth and throat, liver, kidneys, skin or bones can be caused by working conditions such as those at Wismut.
Measurement Strategies and Techniques for Occupational Exposure Assessment in Epidemiology
Other articles in this chapter present general principles of medical surveillance of occupational illnesses and exposure surveillance. This article outlines some principles of epidemiological methods that may be used to fulfil surveillance needs. Application of these methods must take into account basic principles of physical measurement as well as standard epidemiological data-gathering practice.
Epidemiology can quantify the association between occupational and non-occupational exposure to chemico-physical stressors or behaviour and disease outcomes, and can thus provide information to develop interventions and prevention programmes (Coenen 1981; Coenen and Engels 1993). Availability of data and access to workplace and personnel records usually dictate the design of such studies. Under the most favourable circumstances, exposures can be determined through industrial hygiene measurements that are carried out in an operating shop or factory, and direct medical examinations of workers are used to ascertain possible health effects. Such evaluations can be done prospectively for a period of months or years to estimate risks of diseases such as cancer. However, it is more often the case that past exposures must be reconstructed historically, projecting backwards from current levels or using measurements recorded in the past, which may not completely meet informational needs. This article presents some guidelines and limitations for measurement strategies and documentation that affect epidemiological assessment of workplace health hazards.
Measurements
Measurements should be quantitative wherever possible, rather than qualitative, because quantitative data are subject to more powerful statistical techniques. Observable data are commonly classified as nominal, ordinal, interval and ratio. Nominal level data are qualitative descriptors which differentiate only types, such as different departments within a factory or different industries. Ordinal variables may be arranged from “low” to “high” without conveying further quantitative relationships. An example is “exposed” vs. “unexposed”, or classifying smoking history as non-smoker (= 0), light smoker (= 1), medium smoker (= 2) and heavy smoker (= 3). The higher the numerical value, the stronger the smoking intensity. Most measurement values are expressed as ratio or interval scales, in which a concentration of 30 mg/m3 is double the concentration of 15 mg/m3. Ratio variables possess an absolute zero (like age) while interval variables (like IQ) do not.
Measurement strategy
Measurement strategy takes into account information about the measurement site, the surrounding conditions (e.g., humidity, air pressure) during the measurement, the duration of the measurement and the measurement technique (Hansen and Whitehead 1988; Ott 1993).
Legal requirements often dictate measurement of eight-hour time-weighted averages (TWAs) of levels of hazardous substances. However, not all individuals work eight-hour shifts all the time, and levels of exposures may fluctuate during the shift. A value measured for one person’s job might be considered representative of an eight-hour shift value if the exposure duration is longer than six hours during the shift. As a practical criterion, a sampling duration of at least two hours should be sought. With time intervals that are too short, the sampling in one time period can show higher or lower concentrations, thereby over- or underestimating the concentration during the shift (Rappaport 1991). Therefore, it can be useful to combine several measurements or measurements over several shifts into a single time-weighted average, or to use repeated measurements with shorter sampling durations.
Measurement validity
Surveillance data must satisfy well-established criteria. The measurement technique should not influence the results during the measurement process (reactivity). Furthermore, the measurement should be objective, reliable and valid. The results should not be influenced either by the measurement technique used (execution objectivity) or by the reading or documentation by the measurement technician (assessment objectivity). The same measurement values should be obtained under the same conditions (reliability); the intended thing should be measured (validity) and interactions with other substances or exposures should not unduly influence the results.
Quality of Exposure Data
Data sources. A basic principle of epidemiology is that measurements made at the individual level are preferable to those made at the group level. Thus, the quality of epidemiolological surveillance data decreases in the following order:
- direct measurements taken of persons; information on exposure levels and time progression
- direct measurements taken of groups; information on current exposure levels for specific groups of workers (sometimes expressed as job-exposure matrices) and their variation over time
- measurements abstracted or reconstructed for individuals; estimation of exposure from company records, purchasing lists, descriptions of product lines, interviews with employees
- measurements abstracted or reconstructed for groups; historical estimation of group-based exposure indexes.
In principle, the most precise determination of the exposure, using documented measurement values over time, should always be sought. Unfortunately, indirectly measured or historically reconstructed exposures are often the only data available for estimating exposure-outcome relationships, even though considerable deviations exist between measured exposures and exposure values reconstructed from company records and interviews (Ahrens et al. 1994; Burdorf 1995). The quality of the data declines in the order exposure measurement, activity-related exposure index, company information, employee interviews.
Exposure scales. The need for quantitative monitoring data in surveillance and epidemiology goes considerably beyond the narrow legal requirements of threshold values. The goal of an epidemiological investigation is to ascertain dose-effect relation-ships, taking into account potentially confounding variables. The most precise information possible, which in general can be expressed only with a high scale level (e.g., ratio scale level), should be used. Separation into larger or smaller threshold values, or coding in fractions of threshold values (e.g., 1/10, 1/4, 1/2 threshold value) as is sometimes done, essentially relies on data measured on a statistically weaker ordinal scale.
Documentation requirements. In addition to information on the concentrations and the material and time of measurement, external measurement conditions should be documented. This should include a description of the equipment used, measurement technique, reason for the measurement and other relevant technical details. The purpose of such documentation is to ensure uniformity of measurements over time and from one study to another, and to permit comparisons between studies.
Exposure and health outcome data gathered for individuals are usually subject to privacy laws that vary from one country to another. Documentation of exposure and health conditions must adhere to such laws.
Epidemiological Requirements
Epidemiological studies strive to establish a causal link between exposure and disease. Some aspects of surveillance measurements that affect this epidemiological assessment of risk are considered in this section.
Type of disease. A common starting point for epidemiological studies is the clinical observation of a surge in a particular disease in a company or area of activity. Hypotheses on potential biological, chemical or physical causal factors ensue. Depending on the availability of data, these factors (exposures) are studied using a retrospective or prospective design. The time between the beginning of the exposure and the onset of the disease (latency) also affects study design. The range of latency can be considerable. Infections from certain enteroviruses have latency/incubation times of 2 to 3 hours, whereas for cancers latencies of 20 to 30 years are typical. Therefore, exposure data for a cancer study must cover a considerably longer period of time than for an infectious disease outbreak. Exposures which began in the distant past can continue up to the onset of disease. Other diseases associated with age, such as cardiovascular disease and stroke, can appear in the exposed group after the study begins and must be treated as competing causes. It is also possible that people classified as “not sick” are merely people who have not yet manifested clinical illness. Thus, continued medical surveillance of exposed populations must be maintained.
Statistical power. As previously stated, measurements should be expressed on as high a data level (ratio scale level) as possible in order to optimize the statistical power to produce statistically significant results. Power in turn is affected by the size of the total study population, the prevalence of exposure in that population, the background rate of illness and the magnitude of risk of the disease that is caused by the exposure under study.
Mandated disease classification. Several systems are available for codifying medical diagnoses. The most common are ICD-9 (International Classification of Diseases) and SNOMED (Systematic Nomenclature of Medicine). ICD-O (oncology) is a particularization of the ICD for codifying cancers. ICD coding documentation is legally mandated in many health systems throughout the world, especially in Western countries. However, SNOMED codification can also codify possible causal factors and external conditions. Many countries have developed specialized coding systems to classify injuries and illnesses that also include the circumstances of the accident or exposure. (See the articles “Case study: Worker protection and statistics on accidents and occupational diseases—HVBG, Germany” and “Development and application of an occupational injury and illness classification system”, elsewhere in this chapter.)
Measurements that are made for scientific purposes are not bound by the legal requirements that apply to mandated surveillance activities, such as determination of whether threshold limits have been exceeded in a given workplace. It is useful to examine exposure measurements and records in such a way as to check for possible excursions. (See, for example, the article “Occupational hazard surveillance” in this chapter.)
Treatment of mixed exposures. Diseases often have several causes. Therefore it is necessary to record as completely as possible the suspected causal factors (exposures/confounding factors) in order to be able to distinguish the effects of suspected hazardous agents from one another and from the effects of other contributory or confounding factors, such as cigarette smoking. Occupational exposures are often mixed (e.g., solvent mixtures; welding fumes such as nickel and cadmium; and in mining, fine dust, quartz and radon). Additional risk factors for cancers include smoking, excess alcohol consumption, poor nutrition and age. Besides chemical exposures, exposures to physical stressors (vibration, noise, electromagnetic fields) are possible triggers for diseases and must be considered as potential causal factors in epidemiological studies.
Exposures to multiple agents or stressors may produce interaction effects, in which the effect of one exposure is magnified or reduced by another that occurs contemporaneously. A typical example is the link between asbestos and lung cancer, which is many times more pronounced among smokers. An example of the mixture of chemical and physical exposures is progressive systemic scleroderma (PSS), which is probably caused by a combined exposure to vibration, solvent mixtures and quartz dust.
Consideration of bias. Bias is a systematic error in classifying persons in the “exposed/not exposed” or “diseased/not diseased” groups. Two types of bias should be distinguished: observation (information) bias and selection bias. With observation (information) bias, different criteria may be used to classify subjects into the diseased/not diseased groups. It is sometimes created when the target of a study includes persons employed in occupations known to be hazardous, and who may already be under increased medical surveillance relative to a comparison population.
In selection bias two possibilities should be distinguished. Case-control studies begin by separating persons with the disease of interest from those without that disease, then examine differences in exposure between these two groups; cohort studies determine disease rates in groups with different exposures. In either type of study, selection bias exists when information on the exposure affects classification of subjects as sick or not sick, or when information on disease status affects classification of subjects as exposed or not exposed. A common example of selection bias in cohort studies is the “healthy worker effect”, which is encountered when disease rates in exposed workers are compared with those in the general population. This can result in underestimation of disease risk because working populations are often selected from the general population on the basis of continued good health, frequently based upon medical examination, whereas the general population contains the ill and infirm.
Confounders. Confounding is the phenomenon whereby a third variable (the confounder) alters the estimate of an association between a presumed antecedent factor and a disease. It can occur when the selection of subjects (cases and controls in a case-control study or exposed and unexposed in a cohort study) depends in some way upon the third variable, possibly in a manner unknown to the investigator. Variables associated only with exposure or disease are not confounders. To be a confounder a variable must meet three conditions:
- It must be a risk factor for the disease.
- It must be associated with the exposure in the study population.
- It must not be in the causal pathway from exposure to disease.
Before any data are collected for a study it is sometimes impossible to predict whether or not a variable is a likely confounder. A variable which has been treated as a confounder in a previous study might not be associated with exposure in a new study within a different population, and would therefore not be a confounder in the new study. For instance, if all subjects are alike with respect to a variable (e.g., sex), then that variable cannot be a confounder in that particular study. Confounding by a particular variable can be accounted for (“controlled”) only if the variable is measured along with exposure and illness outcomes. Statistical control of confounding may be done crudely using stratification by the con-founding variable, or more precisely using regression or other multivariate techniques.
Summary
The requirements of measuring strategy, measuring technology and documentation for industrial workplaces are sometimes statutorily defined in terms of threshold limit value surveillance. Data protection regulations also apply to the protection of company secrets and person-related data. These requirements call for the comparable measuring results and measurement conditions and for an objective, valid and reliable measuring technology. Additional requirements put forward by epidemiology refer to the representativeness of measurements and to the possibility of establishing links between exposures for individuals and subsequent health outcomes. Measurements may be representative for certain tasks, i.e. they may reflect typical exposure during certain activities or in specific branches or typical exposure of defined groups of persons. It would be desirable to have measurement data directly attributed to the study subjects. This would make it necessary to include with measurement documentation information about persons working at the concerned workplace during the measurement or to set up a registry allowing such direct attribution. Epidemiological data collected at the individual level are usually preferable to those obtained at the group level.
Case Study: Occupational Health Surveys in China
To understand the magnitude of occupational health problems in China, the Ministry of Public Health (MOPH) has organized a number of nationwide surveys, including the following:
- a survey on occupational exposures to benzene, lead, mercury, TNT and organophosphates (1979-81)
- a retrospective epidemiological investigation on occupational cancers in workers exposed to eight chemicals (1983-85)
- an epidemiological survey on pneumoconioses (1952-86)
- a survey on occupational health problems of small-scale industries and the relevant intervention strategies (1984-85, 1990-92).
The results of these surveys have served as a very important foundation for formulating national policies and regulations. At the same time, a national occupational health reporting system has been established by MOPH. The Annual Report of the National Occupational Health Situation has been published since 1983. The data are compiled and analysed by the National Center of Occupational Health Reporting (NCOHR) and then reported to the MOPH. There are local reporting offices in Occupational Health Institutes (OHIs) or Health Epidemic Prevention Stations (HEPS) at all levels from county to province. The reporting follows a “bottom-up” procedure annually, but, if an acute poisoning accident happened which involved three or more cases of poisoning or one death, it must be reported to the local OHI and also directly to the MOPH within 24 hours by the primary-contact medical institutions. The information required to be reported every year includes the following: registered new cases of compensable occupational diseases, the results of health examinations of workers and the monitoring of working environments (MOPH 1991). China is currently promoting the computerization of the reporting system and its computer network. It currently extends from the national centre to the provincial offices.
" DISCLAIMER: The ILO does not take responsibility for content presented on this web portal that is presented in any language other than English, which is the language used for the initial production and peer-review of original content. Certain statistics have not been updated since the production of the 4th edition of the Encyclopaedia (1998)."