Anatomy of the Eye
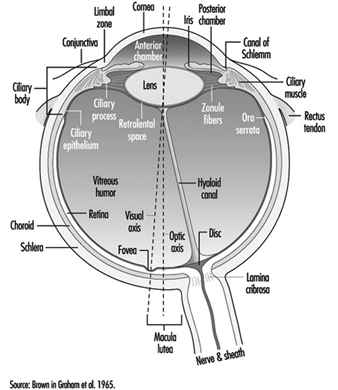
The eye is a sphere (Graham et al. 1965; Adler 1992), approximately 20 mm in diameter, that is set in the body orbit with the six extrinsic (ocular) muscles that move the eye attached to the sclera, its external wall (figure 1). In front, the sclera is replaced by the cornea, which is transparent. Behind the cornea in the interior chamber is the iris, which regulates the diameter of the pupil, the space through which the optic axis passes. The back of the anterior chamber is formed by the biconvex crystalline lens, whose curvature is determined by the ciliary muscles attached at the front to the sclera and behind to the choroidal membrane, which lines the posterior chamber. The posterior chamber is filled with the vitreous humour—a clear, gelatinous liquid. The choroid, the inner surface of the posterior chamber, is black to prevent interference with visual acuity by internal light reflections.
Figure 1. Schematic representation of the eye.
 The eyelids help to maintain a film of tears, produced by the lacrymal glands, which protects the anterior surface of the eye. Blinking facilitates the spread of tears and their emptying into the lacrymal canal, which empties in the nasal cavity. The frequency of blinking, which is used as a test in ergonomics, varies greatly depending on the activity being undertaken (for example, it is slower during reading) and also on the lighting conditions (the rate of blinking is lowered by an increase of illumination).
The anterior chamber contains two muscles: the sphincter of the iris, which contracts the pupil, and the dilator, which widens it. When a bright light is directed toward a normal eye, the pupil contracts (pupillary reflex). It also contracts when viewing a nearby object.
The retina has several inner layers of nerve cells and an outer layer containing two types of photoreceptor cells, the rods and cones. Thus, light passes through the nerve cells to the rods and cones where, in a manner not yet understood, it generates impulses in the nerve cells which pass along the optic nerve to the brain. The cones, numbering four to five millions, are responsible for the perception of bright images and colour. They are concentrated in the inner portion of the retina, most densely at the fovea, a small depression at the centre of the retina where there are no rods and where vision is most acute. With the help of spectrophotometry, three types of cones have been identified, whose absorption peaks are yellow, green and blue zones accounting for the sense of colour. The 80 to 100 million rods become more and more numerous toward the periphery of the retina and are sensitive to dim light (night vision). They also play a major role in black-white vision and in the detection of motion.
The nerve fibres, along with the blood vessels which nourish the retina, traverse the choroid, the middle of the three layers forming the wall of the posterior chamber, and leave the eye as the optic nerve at a point somewhat off-centre, which, because there are no photoreceptors there, is known as the “blind spot.”
The retinal vessels, the only arteries and veins that can be viewed directly, can be visualized by directing a light through the pupil and using an ophthalmoscope to focus on their image (the images can also be photographed). Such retinoscopic examinations, part of the routine medical examination, are important in evaluating the vascular components of such diseases as arteriosclerosis, hypertension and diabetes, which may cause retinal haemorrhages and/or exudates that may cause defects in the field of vision.
Properties of the Eye that Are Important for Work
Mechanism of accommodation
In the emmetropic (normal) eye, as light rays pass through the cornea, the pupil and the lens, they are focused on the retina, producing an inverted image which is reversed by the visual centres in the brain.
When a distant object is viewed, the lens is flattened. When viewing nearby objects, the lens accommodates (i.e., increases its power) by a squeezing of the ciliary muscles into a more oval, convex shape. At the same time, the iris constricts the pupil, which improves the quality of the image by reducing the spherical and chromatic aberrations of the system and increasing the depth of field.
In binocular vision, accommodation is necessarily accompanied by proportional convergence of both eyes.
The visual field and the field of fixation
The visual field (the space covered by the eyes at rest) is limited by anatomical obstacles in the horizontal plane (more reduced on the side towards the nose) and in the vertical plane (limited by the upper edge of the orbit). In binocular vision, the horizontal field is about 180 degrees and the vertical field 120 to 130 degrees. In daytime vision, most visual functions are weakened at the periphery of the visual field; on the contrary, perception of movement is improved. In night vision there is a considerable loss of acuity at the centre of the visual field, where, as noted above, the rods are less numerous.
The field of fixation extends beyond the visual field thanks to the mobility of the eyes, head and body; in work activities it is the field of fixation that matters. The causes of reduction of the visual field, whether anatomical or physiological, are very numerous: narrowing of the pupil; opacity of the lens; pathological conditions of the retina, visual pathways or visual centres; the brightness of the target to be perceived; the frames of spectacles for correction or protection; the movement and speed of the target to be perceived; and others.
Visual acuity
“Visual acuity (VA) is the capacity to discriminate the fine details of objects in the field of view. It is specified in terms of the minimum dimension of some critical aspects of a test object that a subject can correctly identify” (Riggs, in Graham et al. 1965). A good visual acuity is the ability to distinguish fine details. Visual acuity defines the limit of spatial discrimination.
The retinal size of an object depends not only on its physical size but also on its distance from the eye; it is therefore expressed in terms of the visual angle (usually in minutes of arc). Visual acuity is the reciprocal of this angle.
Riggs (1965) describes several types of “acuity task”. In clinical and occupational practice, the recognition task, in which the subject is required to name the test object and locate some details of it, is the most commonly applied. For convenience, in ophthalmology, visual acuity is measured relative to a value called “normal” using charts presenting a series of objects of different sizes; they have to be viewed at a standard distance.
In clinical practice Snellen charts are the most widely used tests for distant visual acuity; a series of test objects are used in which the size and broad shape of characters are designed to subtend an angle of 1 minute at a standard distance which varies from country to country (in the United States, 20 feet between the chart and the tested individual; in most European countries, 6 metres). The normal Snellen score is thus 20/20. Larger test objects which form an angle of 1 minute of arc at greater distances are also provided.
The visual acuity of an individual is given by the relation VA = D¢/D, where D¢ is the standard viewing distance and D the distance at which the smallest test object correctly identified by the individual subtends an angle of 1 minute of arc. For example, a person’s VA is 20/30 if, at a viewing distance of 20 ft, he or she can just identify an object which subtends an angle of 1 minute at 30 feet.
In optometric practice, the objects are often letters of the alphabet (or familiar shapes, for illiterates or children). However, when the test is repeated, charts should present unlearnable characters for which the recognition of differences involve no educational and cultural features. This is one reason why it is nowadays internationally recommended to use Landolt rings, at least in scientific studies. Landolt rings are circles with a gap, the directional position of which has to be identified by the subject.
Except in ageing people or in those individuals with accommodative defects (presbyopia), the far and the near visual acuity parallel each other. Most jobs require both a good far (without accommodation) and a good near vision. Snellen charts of different kinds are also available for near vision (figures 2 and 3). This particular Snellen chart should be held at 16 inches from the eye (40 cm); in Europe, similar charts exist for a reading distance of 30 cm (the appropriate distance for reading a newspaper).
Figure 2. Example of a Snellen chart: Landolt rings (acuity in decimal values (reading distance not specified)).
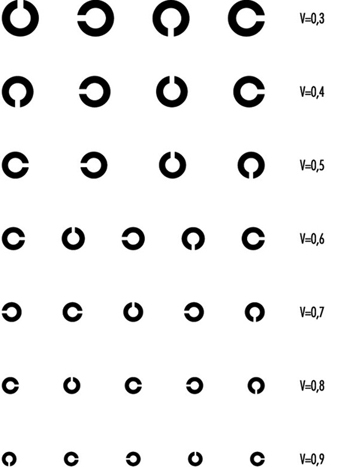
Figure 3. Example of a Snellen chart: Sloan letters for measuring near vision (40 cm)(acuity in decimal values and in distance equivalents).

With the broad use of visual display units, VDUs, however, there is an increased interest in occupational health to test operators at a longer distance (60 to 70 cm, according to Krueger (1992), in order to correct VDU operators properly.
Vision testers and visual screening
For occupational practice, several types of visual testers are available on the market which have similar features; they are named Orthorater, Visiotest, Ergovision, Titmus Optimal C Tester, C45 Glare Tester, Mesoptometer, Nyctometer and so on.
They are small; they are independent of the lighting of the testing room, having their own internal lighting; they provide several tests, such as far and near binocular and monocular visual acuity (most of the time with unlearnable characters), but also depth perception, rough colour discrimination, muscular balance and so on. Near visual acuity can be measured, sometimes for short and intermediate distance of the test object. The most recent of these devices makes extensive use of electronics to provide automatically written scores for different tests. Moreover, these instruments can be handled by non-medical personnel after some training.
Vision testers are designed for the purpose of pre-recruitment screening of workers, or sometimes later testing, taking into account the visual requirements of their workplace. Table 1 indicates the level of visual acuity needed to fulfil unskilled to highly skilled activities, when using one particular testing device (Fox, in Verriest and Hermans 1976).
Table 1. Visual requirements for different activities when using Titmus Optimal C Tester, with correction
Category 1: Office work
Far visual acuity 20/30 in each eye (20/25 for binocular vision)
Near VA 20/25 in each eye (20/20 for binocular vision)
Category 2: Inspection and other activities in fine mechanics
Far VA 20/35 in each eye (20/30 for binocular vision)
Near VA 20/25 in each eye (20/20 for binocular vision)
Category 3: Operators of mobile machinery
Far VA 20/25 in each eye (20/20 for binocular vision)
Near VA 20/35 in each eye (20/30 for binocular vision)
Category 4 : Machine tools operations
Far and near VA 20/30 in each eye (20/25 for binocular vision)
Category 5 : Unskilled workers
Far VA 20/30 in each eye (20/25 for binocular vision)
Near VA 20/35 in each eye (20/30 for binocular vision)
Category 6 : Foremen
Far VA 20/30 in each eye (20/25 for binocular vision)
Near VA 20/25 in each eye (20/20 for binocular vision)
Source: According to Fox in Verriest and Hermans 1975.
It is recommended by manufacturers that employees are measured when wearing their corrective glasses. Fox (1965), however, stresses that such a procedure may lead to wrong results—for example, workers are tested with glasses which are too old in comparison with the time of the present measurement; or lenses may be worn out by exposure to dust or other noxious agents. It is also very often the case that people come to the testing room with the wrong glasses. Fox (1976) suggests therefore that, if “the corrected vision is not improved to 20/20 level for distance and near, referral should be made to an ophthalmologist for a proper evaluation and refraction for the current need of the employee on his job”. Other deficiencies of vision testers are referred to later in this article.
Factors influencing visual acuity
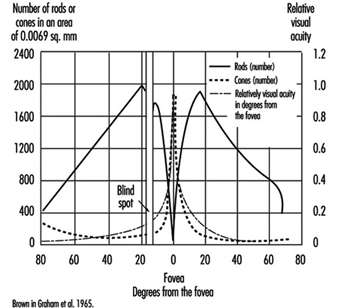
VA meets its first limitation in the structure of the retina. In daytime vision, it may exceed 10/10ths at the fovea and may rapidly decline as one moves a few degrees away from the centre of the retina. In night vision, acuity is very poor or nil at the centre but may reach one tenth at the periphery, because of the distribution of cones and rods (figure 4).
Figure 4. Density of cones and rods in the retina as compared with the relative visual acuity in the corresponding visual field.
The diameter of the pupil acts on visual performance in a complex manner. When dilated, the pupil allows more light to enter into the eye and stimulate the retina; the blur due to the diffraction of the light is minimized. A narrower pupil, however, reduces the negative effects of the aberrations of the lens mentioned above. In general, a pupil diameter of 3 to 6 mm favours clear vision.
Thanks to the process of adaptation it is possible for the human being to see as well by moonlight as by full sunshine, even though there is a difference in illumination of 1 to 10,000,000. Visual sensitivity is so wide that luminous intensity is plotted on a logarithmic scale.
On entering a dark room we are at first completely blind; then the objects around us become perceptible. As the light level is increased, we pass from rod-dominated vision to cone-dominated vision. The accompanying change in sensitivity is known as the Purkinje shift. The dark-adapted retina is mainly sensitive to low luminosity, but is characterized by the absence of colour vision and poor spatial resolution (low VA); the light-adapted retina is not very sensitive to low luminosity (objects have to be well illuminated in order to be perceived), but is characterized by a high degree of spatial and temporal resolution and by colour vision. After the desensitization induced by intense light stimulation, the eye recovers its sensitivity according to a typical progression: at first a rapid change involving cones and daylight or photopic adaptation, followed by a slower phase involving rods and night or scotopic adaptation; the intermediate zone involves dim light or mesopic adaptation.
In the work environment, night adaptation is hardly relevant except for activities in a dark room and for night driving (although the reflection on the road from headlights always brings some light). Simple daylight adaptation is the most common in industrial or office activities, provided either by natural or by artificial lighting. However, nowadays with emphasis on VDU work, many workers like to operate in dim light.
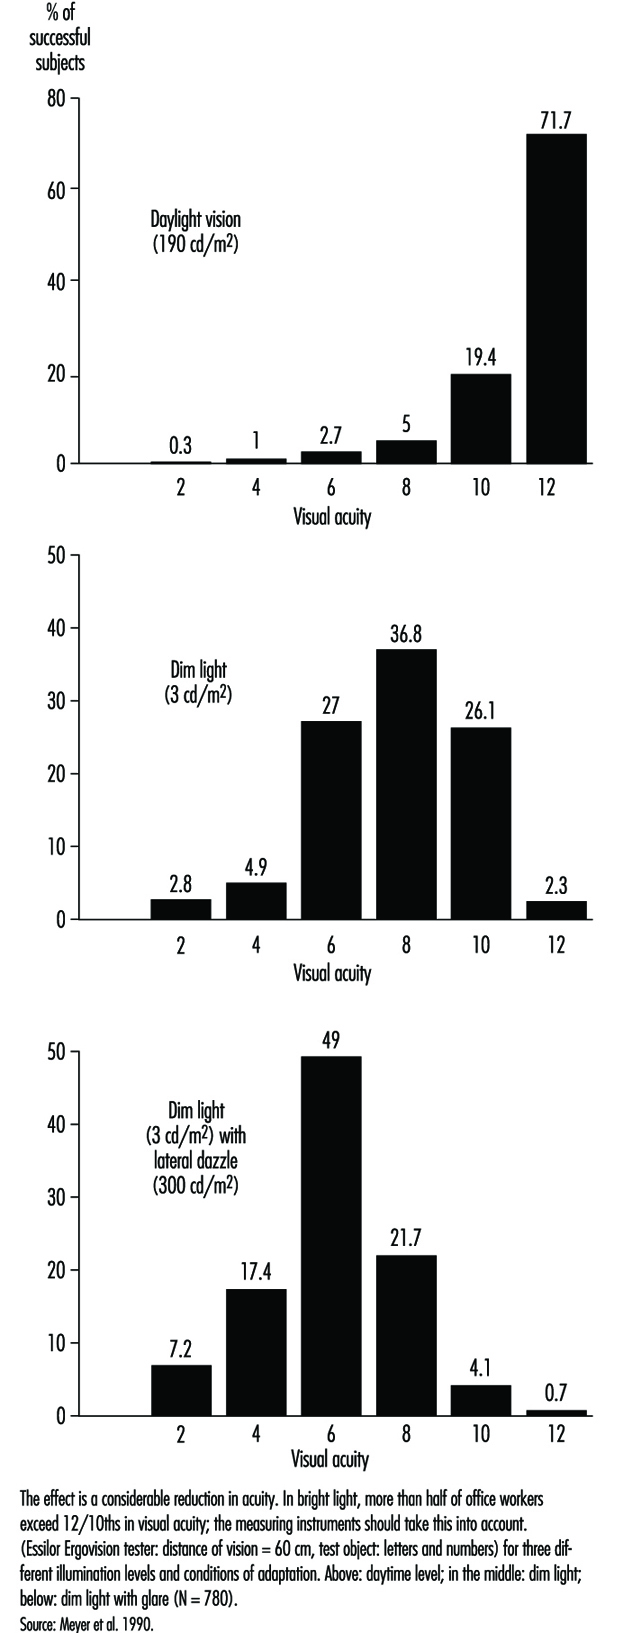
In occupational practice, the behaviour of groups of people is particularly important (in comparison with individual evaluation) when selecting the most appropriate design of workplaces. The results of a study of 780 office workers in Geneva (Meyer et al. 1990) show the shift in percentage distribution of acuity levels when lighting conditions are changed. It may be seen that, once adapted to daylight, most of the tested workers (with eye correction) reach a quite high visual acuity; as soon as the surrounding illumination level is reduced, the mean VA decreases, but also the results are more spread, with some people having very poor performance; this tendency is aggravated when dim light is accompanied by some disturbing glare source (figure 5). In other words, it is very hard to predict the behaviour of a subject in dim light from his or her score in optimal daylight conditions.
Figure 5. Percentage distribution of tested office workers’ visual acuity.
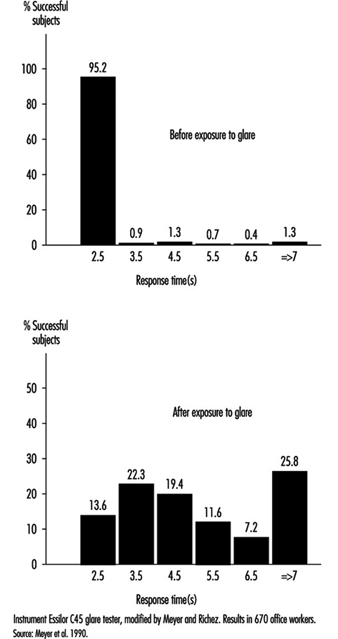
Glare. When the eyes are directed from a dark area to a lighted area and back again, or when the subject looks for a moment at a lamp or window (illuminance varying from 1,000 to 12,000 cd/m2), changes in adaptation concern a limited area of the visual field (local adaptation). Recovery time after disabling glare may last several seconds, depending on illumination level and contrast (Meyer et al. 1986) (figure 6).
Figure 6. Response time before and after exposure to glare for perceiving the gap of a Landolt ring: Adaption to dim light.
Afterimages. Local disadaptation is usually accompanied by the continued image of a bright spot, coloured or not, which produces a veil or masking effect (this is the consecutive image). Afterimages have been studied very extensively to better understand certain visual phenomena (Brown in Graham et al. 1965). After visual stimulation has ceased, the effect remains for some time; this persistence explains, for example, why perception of continuous light may be present when facing a flickering light (see below). If the frequency of flicker is high enough, or when looking at cars at night, we see a line of light. These afterimages are produced in the dark when viewing an enlighted spot; they are also produced by coloured areas, leaving coloured images. It is the reason why VDU operators may be exposed to sharp afterimages after looking for a prolonged time at the screen and then moving their eyes towards another area in the room.
Afterimages are very complicated. For example, one experiment on afterimages found that a blue spot appears white during the first seconds of observation, then pink after 30 seconds, and then bright red after a minute or two. Another experiment showed that an orange-red field appeared momentarily pink, then within 10 to 15 seconds passed through orange and yellow to a bright green appearance which remained throughout the whole observation. When the point of fixation moves, usually the afterimage moves too (Brown in Graham et al. 1965). Such effects could be very disturbing to someone working with a VDU.
Diffused light emitted by glare sources also has the effect of reducing the object/background contrast (veiling effect) and thus reducing visual acuity (disability glare). Ergophthalmologists also describe discomfort glare, which does not reduce visual acuity but causes uncomfortable or even painful sensation (IESNA 1993).
The level of illumination at the workplace must be adapted to the level required by the task. If all that is required is to perceive shapes in an environment of stable luminosity, weak illumination may be adequate; but as soon as it is a question of seeing fine details that require increased acuity, or if the work involves colour discrimination, retinal illumination must be markedly increased.
Table 2 gives recommended illuminance values for the lighting design of a few workstations in different industries (IESNA 1993).
Table 2. Recommended illuminance values for the lighting design of a few workstations
| Cleaning and pressing industry | |
| Dry and wet cleaning and steaming | 500-1,000 lux or 50-100 footcandles |
| Inspection and spotting | 2,000-5,000 lux or 200-500 footcandles |
| Repair and alteration | 1,000-2,000 lux or 100-200 footcandles |
| Dairy products, fluid milk industry | |
| Bottle storage | 200-500 lux or 20-50 footcandles |
| Bottle washers | 200-500 lux or 20-50 footcandles |
| Filling, inspection | 500-1,000 lux or 50-100 footcandles |
| Laboratories | 500-1,000 lux or 50-100 footcandles |
| Electrical equipment, manufacturing | |
| Impregnating | 200-500 lux or 20-50 footcandles |
| Insulating coil winding | 500-1,000 lux or 50-100 footcandles |
| Electricity-generating stations | |
| Air-conditioning equipment, air preheater | 50-100 lux or 50-10 footcandles |
| Auxiliaries, pumps, tanks, compressors | 100-200 lux or 10-20 footcandles |
| Clothing industry | |
| Examining (perching) | 10,000-20,000 lux or 1,000-2,000 footcandles |
| Cutting | 2,000-5,000 lux or 200-500 footcandles |
| Pressing | 1,000-2,000 lux or 100-200 footcandles |
| Sewing | 2,000-5,000 lux or 200-500 footcandles |
| Piling up and marking | 500-1,000 lux or 50-100 footcandles |
| Sponging, decating, winding | 200-500 lux or 20-50 footcandles |
| Banks | |
| General | 100-200 lux or 10-20 footcandles |
| Writing area | 200-500 lux or 20-50 footcandles |
| Tellers’ stations | 500-1,000 lux or 50-100 footcandles |
| Dairy farms | |
| Haymow area | 20-50 lux or 2-5 footcandles |
| Washing area | 500-1,000 lux or 50-100 footcandles |
| Feeding area | 100-200 lux or 10-20 footcandles |
| Foundries | |
| Core-making: fine | 1,000-2,000 lux or 100-200 footcandles |
| Core-making: medium | 500-1,000 lux or 50-100 footcandles |
| Moulding: medium | 1,000-2,000 lux or 100-200 footcandles |
| Moulding: large | 500-1,000 lux or 50-100 footcandles |
| Inspection: fine | 1,000-2,000 lux or 100-200 footcandles |
| Inspection: medium | 500-1,000 lux or 50-100 footcandles |
Source: IESNA 1993.
Brightness contrast and spatial distribution of luminances at the workplace. From the point of view of ergonomics, the ratio between luminances of the test object, its immediate background and the surrounding area has been widely studied, and recommendations on this subject are available for different requirements of the task (see Verriest and Hermans 1975; Grandjean 1987).
The object-background contrast is currently defined by the formula (Lf – Lo)/Lf, where Lo is the luminance of the object and Lf the luminance of the background. It thus varies from 0 to 1.
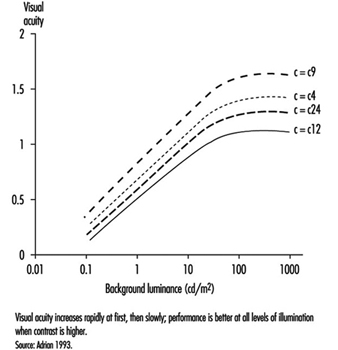
As shown by figure 7, visual acuity increases with the level of illumination (as previously said) and with the increase of object-background contrast (Adrian 1993). This effect is particularly marked in young people. A large light background and a dark object thus provides the best efficiency. However, in real life, contrast will never reach unity. For example, when a black letter is printed on a white sheet of paper, the object-background contrast reaches a value of only around 90%.
Figure 7. Relationship between visual acuity of a dark object perceived on a background receiving increasing illumination for four contrast values.
In the most favourable situation—that is, in positive presentation (dark letters on a light background)—acuity and contrast are linked, so that visibility can be improved by affecting either one or the other factor—for example, increasing the size of letters or their darkness, as in Fortuin’s table (in Verriest and Hermans 1975). When video display units appeared on the market, letters or symbols were presented on the screen as light spots on a dark background. Later on, new screens were developed which displayed dark letters on a light background. Many studies were conducted in order to verify whether this presentation improved vision. The results of most experiments stress without any doubt that visual acuity is enhanced when reading dark letters on a light background; of course a dark screen favours reflections of glare sources.
The functional visual field is defined by the relationship between the luminosity of the surfaces actually perceived by the eye at the workpost and those of the surrounding areas. Care must be taken not to create too great differences of luminosity in the visual field; according to the size of the surfaces involved, changes in general or local adaptation occur which cause discomfort in the execution of the task. Moreover, it is recognized that in order to achieve good performance, the contrasts in the field must be such that the task area is more illuminated than its immediate surroundings, and that the far areas are darker.
Time of presentation of the object. The capacity to detect an object depends directly on the quantity of light entering the eye, and this is linked with the luminous intensity of the object, its surface qualities and the time during which it appears (this is known in tests of tachystocopic presentation). A reduction in acuity occurs when the duration of presentation is less than 100 to 500 ms.
Movements of the eye or of the target. Loss of performance occurs particularly when the eye jerks; nevertheless, total stability of the image is not required in order to attain maximum resolution. But it has been shown that vibrations such as those of construction site machines or tractors can adversely affect visual acuity.
Diplopia. Visual acuity is higher in binocular than in monocular vision. Binocular vision requires optical axes that both meet at the object being looked at, so that the image falls into corresponding areas of the retina in each eye. This is made possible by the activity of the external muscles. If the coordination of the external muscles is failing, more or less transitory images may appear, such as in excessive visual fatigue, and may cause annoying sensations (Grandjean 1987).
In short, the discriminating power of the eye depends on the type of object to be perceived and the luminous environment in which it is measured; in the medical consulting room, conditions are optimal: high object-background contrast, direct daylight adaptation, characters with sharp edges, presentation of the object without a time limit, and certain redundancy of signals (e.g., several letters of the same size on a Snellen chart). Moreover, visual acuity determined for diagnosis purposes is a maximal and unique operation in the absence of accommodative fatigue. Clinical acuity is thus a poor reference for the visual performance attained on the job. What is more, good clinical acuity does not necessarily mean the absence of discomfort at work, where conditions of individual visual comfort are rarely attained. At most workplaces, as stressed by Krueger (1992), objects to be perceived are blurred and of low contrast, background luminances are unequally scattered with many glare sources producing veiling and local adaptation effects and so on. According to our own calculations, clinical results do not carry much predictive value of the amount and nature of visual fatigue encountered, for example, in VDU work. A more realistic laboratory set-up in which conditions of measurement were closer to task requirements did somewhat better (Rey and Bousquet 1990; Meyer et al. 1990).
Krueger (1992) is right when claiming that ophthalmological examination is not really appropriate in occupational health and ergonomics, that new testing procedures should be developed or extended, and that existing laboratory set-ups should be made available to the occupational practitioner.
Relief Vision, Stereoscopic Vision
Binocular vision allows a single image to be obtained by means of synthesis of the images received by the two eyes. Analogies between these images give rise to the active cooperation that constitutes the essential mechanism of the sense of depth and relief. Binocular vision has the additional property of enlarging the field, improving visual performance generally, relieving fatigue and increasing resistance to glare and dazzle.
When the fusion of both eyes is not sufficient, ocular fatigue may appear earlier.
Without achieving the efficiency of binocular vision in appreciating the relief of relatively near objects, the sensation of relief and the perception of depth are nevertheless possible with monocular vision by means of phenomena that do not require binocular disparity. We know that the size of objects does not change; that is why apparent size plays a part in our appreciation of distance; thus retinal images of small size will give the impression of distant objects, and vice versa (apparent size). Near objects tend to hide more distant objects (this is called interposition). The brighter one of two objects, or the one with a more saturated colour, seems to be nearer. The surroundings also play a part: more distant objects are lost in mist. Two parallel lines seem to meet at infinity (this is the perspective effect). Finally, if two targets are moving at the same speed, the one whose speed of retinal displacement is slower will appear farther from the eye.
In fact, monocular vision does not constitute a major obstacle in the majority of work situations. The subject needs to get accustomed to the narrowing of the visual field and also to the rather exceptional possibility that the image of the object may fall on the blind spot. (In binocular vision the same image never falls on the blind spot of both eyes at the same time.) It should also be noted that good binocular vision is not necessarily accompanied by relief (stereoscopic) vision, since this also depends on complex nervous system processes.
For all these reasons, regulations for the need of stereoscopic vision at work should be abandoned and replaced by a thorough examination of individuals by an eye doctor. Such regulations or recommendations exist nevertheless and stereoscopic vision is supposed to be necessary for such tasks as crane driving, jewellery work and cutting-out work. However, we should keep in mind that new technologies may modify deeply the content of the task; for example, modern computerized machine-tools are probably less demanding in stereoscopic vision than previously believed.
As far as driving is concerned, regulations are not necessarily similar from country to country. In table 3 (overleaf), French requirements for driving either light or heavy vehicles are mentioned. The American Medical Association guidelines are the appropriate reference for American readers. Fox (1973) mentions that, for the US Department of Transportation in 1972, drivers of commercial motor vehicles should have a distant VA of at least 20/40, with or without corrective glasses; a field of vision of at least 70 degrees is needed in each eye. Ability to recognize the colours of the traffic lights was also required at that time, but today in most countries traffic lights can be distinguished not only by colour but also by shape.
Table 3. Visual requirements for a driving licence in France
| Visual acuity (with eyeglasses) | |
| For light vehicles | At least 6/10th for both eyes with at least 2/10th in the worse eye |
| For heavy vehicles | VA with both eyes of 10/10th with at least 6/10th in the worse eye |
| Visual field | |
| For light vehicles | No licence if peripheral reduction in candidates with one eye or with the second eye having a visual acuity of less than 2/10th |
| For heavy vehicles | Complete integrity of both visual fields (no peripheral reduction, no scotoma) |
| Nystagmus (spontaneous eye movements) | |
| For light vehicles | No licence if binocular visual acuity of less than 8/10th |
| Heavy vehicles | No defects of night vision are acceptable |
Eye Movements
Several types of eye movements are described whose objective is to allow the eye to take advantage of all the information contained in the images. The system of fixation allows us to maintain the object in place at the level of the foveolar receptors where it can be examined in the retinal region with the highest power of resolution. Nevertheless, the eyes are constantly subject to micromovements (tremor). Saccades (particularly studied during reading) are intentionally induced rapid movements the aim of which is to displace the gaze from one detail to another of the motionless object; the brain perceives this unanticipated motion as the movement of an image across the retina. This illusion of movement is met in pathological conditions of the central nervous system or the vestibular organ. Search movements are partially voluntary when they involve the tracking of relatively small objects, but become rather irrepressible when very large objects are concerned. Several mechanisms for suppressing images (including jerks) allow the retina to prepare to receive new information.
Illusions of movements (autokinetic movements) of a luminous point or a motionless object, such as the movement of a bridge over a watercourse, are explained by retinal persistence and conditions of vision that are not integrated in our central system of reference. The consecutive effect may be merely a simple error of interpretation of a luminous message (sometimes harmful in the working environment) or result in serious neurovegetative disturbances. The illusions caused by static figures are well known. Movements in reading are discussed elsewhere in this chapter.
Flicker Fusion and de Lange Curve
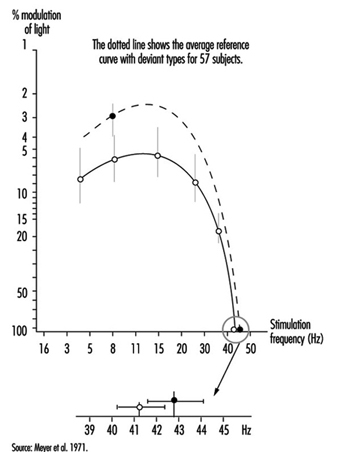
When the eye is exposed to a succession of short stimuli, it first experiences flicker and then, with an increase in frequency, has the impression of stable luminosity: this is the critical fusion frequency. If the stimulating light fluctuates in a sinusoidal manner, the subject may experience fusion for all frequencies below the critical frequency insofar as the level of modulation of this light is reduced. All these thresholds can then be joined by a curve which was first described by de Lange and which can be altered when changing the nature of the stimulation: the curve will be depressed when the luminance of the flickering area is reduced or if the contrast between the flickering spot at its surrounding decreases; similar changes of the curve can be observed in retinal pathologies or in post-effects of cranial trauma (Meyer et al. 1971) (Figure 8).
Figure 8. Flicker-fusion curves connecting the frequency of intermittent luminous stimulation and its amplitude of modulation at threshold (de Lange’s curves), average and standard deviation, in 43 patients suffering from cranial trauma and 57 controls (dotted line).
Therefore one must be cautious when claiming to interpret a fall in critical flicker fusion in terms of work-induced visual fatigue.
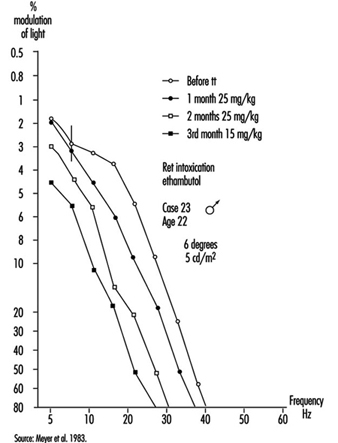
Occupational practice should make a better use of flickering light to detect small retinal damage or dysfunctioning (e.g., an enhancement of the curve can be observed when dealing with slight intoxication, followed by a drop when intoxication becomes greater); this testing procedure, which does not alter retinal adaptation and which does not require eye correction, is also very useful for the follow-up of functional recovery during and after a treatment (Meyer et al. 1983) (figure 9).
Figure 9. De Lange’s curve in a young man absorbing ethambutol; the effect of treatment can de deduced from comparing the flicker sensitivity of the subject before and after treatment.
Colour Vision
The sensation of colour is connected with the activity of the cones and therefore exists only in the case of daylight (photopic range of light) or mesopic (middle range of light) adaptation. In order for the system of colour analysis to function satisfactorily, the illuminance of the perceived objects must be at least 10 cd/m2. Generally speaking, three colour sources, the so-called primary colours—red, green and blue—suffice to reproduce a whole spectrum of colour sensations. In addition, a phenomenon is observed of induction of colour contrast between two colours which mutually reinforce each other: the green-red pair and the yellow-blue pair.
The two theories of colour sensation, the trichromatic and the dichromatic, are not exclusive; the first appears to apply at the level of the cones and the second one at more central levels of the visual system.
To understand the perception of coloured objects against a luminous background, other concepts need to be used. The same colour may in fact be produced by different types of radiation. To reproduce a given colour faithfully, it is therefore necessary to know the spectral composition of the light sources and the spectrum of the reflectance of the pigments. The index of colour reproduction used by lighting specialists allows the selection of fluorescent tubes appropriate to the requirements. Our eyes have developed the faculty of detecting very slight changes in the tonality of a surface obtained by changing its spectral distribution; the spectral colours (the eye can distinguish more than 200) recreated by mixtures of monochromatic light represent only a small proportion of the possible colour sensation.
The importance of the anomalies of colour vision in the work environment should thus not be exaggerated except in activities such as inspecting the appearance of products, and e.g., for decorators and similar, where colours must be correctly identified. Moreover, even in electricians’ work, size and shape or other markers may replace colour.
Anomalies of colour vision may be congenital or acquired (degenerations). In abnormal trichromates, the change may affect the basic red sensation (Dalton type), or the green or the blue (the rarest anomaly). In dichromates, the system of three basic colours is reduced to two. In deuteranopia, it is the basic green that is lacking. In protanopia, it is the disappearance of the basic red; although less frequent, this anomaly, as it is accompanied by a loss of luminosity in the range of reds, deserves attention in the work environment, in particular by avoiding the deployment of red notices especially if they are not very well lighted. It should also be noted that these colour vision defects can be found in various degrees in the so-called normal subject; hence the need for caution in using too many colours. It should be kept in mind also that only broad colour defects are detectable with vision testers.
Refractive Errors
The near point (Weymouth 1966) is the shortest distance at which an object can be brought into sharp focus; the farthest away is the far point. For the normal (emmetropic) eye, the far point is situated at infinity. For the myopic eye, the far point is situated in front of the retina, at a finite distance; this excess of strength is corrected by means of concave lenses. For the hyperopic (hypermetropic) eye, the far point is situated behind the retina; this lack of strength is corrected by means of convex lenses (figure 10). In a case of light hyperopia, the defect is spontaneously compensated with accommodation and may be ignored by the individual. In myopics who are not wearing their spectacles the loss of accommodation can be compensated for by the fact that the far point is nearer.
Figure 10. Schematic representation of refractive errors and their correction.
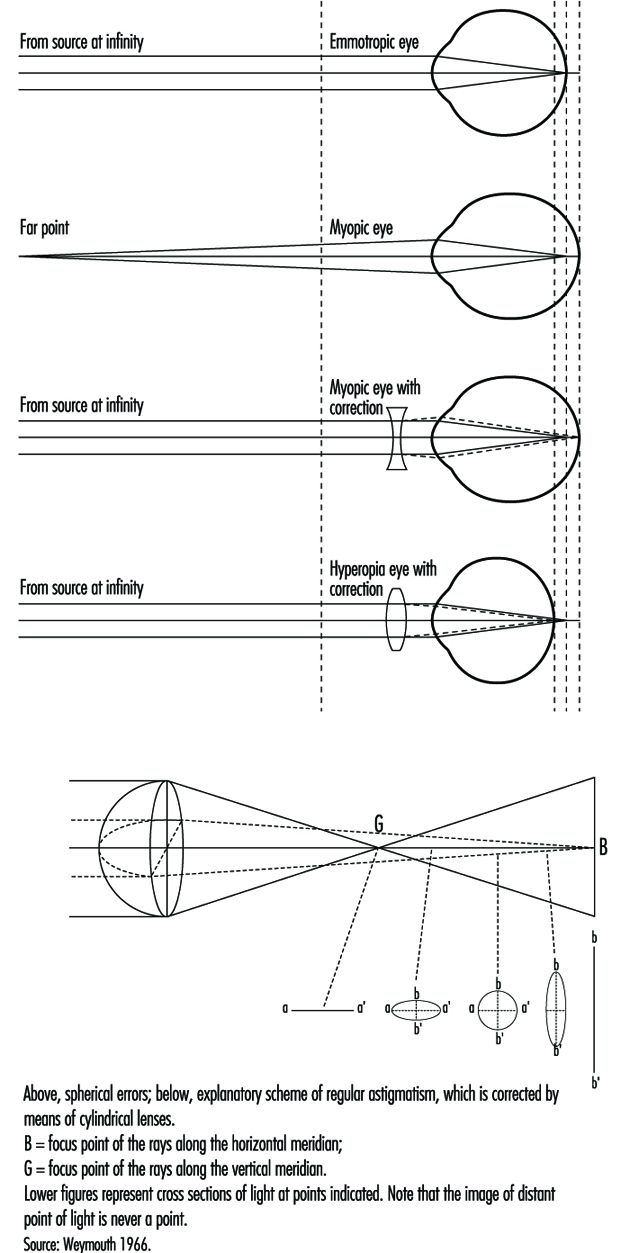
In the ideal eye, the surface of the cornea should be perfectly spherical; however, our eyes show differences in curvature in different axes (this is called astigmatism); refraction is stronger when the curvature is more accentuated, and the result is that rays emerging from a luminous point do not form a precise image on the retina. These defects, when pronounced, are corrected by means of cylindrical lenses (see lowest diagram in figure 10, overleaf); in irregular astigmatism, contact lenses are recommended. Astigmatism becomes particularly troublesome during night driving or in work on a screen, that is, in conditions where light signals stand out on a dark background or when using a binocular microscope.
Contact lenses should not be used at workstations where air is too dry or in case of dusts and so on (Verriest and Hermans 1975).
In presbyopia, which is due to loss of elasticity of the lens with age, it is the amplitude of accommodation that is reduced—that is, the distance between the far and near points; the latter (from about 10 cm at the age of 10 years) moves further away the older one gets; the correction is made by means of unifocal or multifocal convergent lenses; the latter correct for ever nearer distances of the object (usually up to 30 cm) by taking into account that nearer objects are generally perceived in the lower part of the visual field, while the upper part of the spectacles is reserved for distance vision. New lenses are now proposed for work at VDUs which are different from the usual type. The lenses, known as progressive, almost blur the limits between the correction zones. Progressive lenses require the user to be more accustomed to them than do the other types of lenses, because their field of vision is narrow (see Krueger 1992).
When the visual task requires alternative far and near vision, bifocal, trifocal or even progressive lenses are recommended. However, it should be kept in mind that the use of multifocal lenses can create important modifications to the posture of an operator. For example, VDU operators with presbyopia corrected by the means of bifocal lenses tend to extend the neck and may suffer cervical and shoulder pain. Spectacles manufacturers will then propose progressive lenses of different kinds. Another cue is the ergonomic improvement of VDU workplaces, to avoid placing the screen too high.
Demonstrating refractive errors (which are very common in the working population) is not independent of the type of measurement. Snellen charts fixed on a wall will not necessarily give the same results as various kinds of apparatus in which the image of the object is projected on a near background. In fact, in a vision tester (see above), it is difficult for the subject to relax the accommodation, particularly as the axis of vision is lower; this is known as “instrumental myopia”.
Effects of Age
With age, as already explained, the lens loses its elasticity, with the result that the near point moves farther away and the power of accommodation is reduced. Although the loss of accommodation with age can be compensated for by means of spectacles, presbyopia is a real public health problem. Kauffman (in Adler 1992) estimates its cost, in terms of means of correction and loss of productivity, to be of the order of tens of billions of dollars annually for the United States alone. In developing countries we have seen workers obliged to give up work (in particular the making of silk saris) because they are unable to buy spectacles. Moreover, when protective glasses need to be used, it is very expensive to offer both correction and protection. It should be remembered that the amplitude of accommodation declines even in the second ten years of life (and perhaps even earlier) and that it disappears completely by the age of 50 to 55 years (Meyer et al. 1990) (figure 11).
Figure 11. Near point measured with the rule of Clement and Clark, percentage distribution of 367 office workers aged 18-35 years (below) and 414 office workers aged 36-65 years (above).

Other phenomena due to age also play a part: the sinking of the eye into the orbit, which occurs in very old age and varies more or less according to individuals, reduces the size of the visual field (because of the eyelid). Dilation of the pupil is at its maximum in adolescence and then declines; in older people, the pupil dilates less and the reaction of the pupil to light slows down. Loss of transparency of the media of the eye reduces visual acuity (some media have a tendency to become yellow, which modifies colour vision) (see Verriest and Hermans 1976). Enlargement of the blind spot results in the reduction of the functional visual field.
With age and illness, changes are observed in the retinal vessels, with consequent functional loss. Even the movements of the eye are modified; there is a slowing down and reduction in amplitude of the exploratory movements.
Older workers are at a double disadvantage in conditions of weak contrast and weak luminosity of the environment; first, they need more light to see an object, but at the same time they benefit less from increased luminosity because they are dazzled more quickly by glare sources. This handicap is due to changes in the transparent media which allow less light to pass and increase its diffusion (the veil effect described above). Their visual discomfort is aggravated by too sudden changes between strongly and weakly lighted areas (slowed pupil reaction, more difficult local adaptation). All these defects have a particular impact in VDU work, and it is very difficult, indeed, to provide good illumination of workplaces for both young and older operators; it can be observed, for example, that older operators will reduce by all possible means the luminosity of the surrounding light, although dim light tends to decrease their visual acuity.
Risks to the Eye at Work
These risks may be expressed in different ways (Rey and Meyer 1981; Rey 1991): by the nature of the causal agent (physical agent, chemical agents, etc.), by the route of penetration (cornea, sclera, etc.), by the nature of the lesions (burns, bruises, etc.), by the seriousness of the condition (limited to the outer layers, affecting the retina, etc.) and by the circumstances of the accident (as for any physical injury); these descriptive elements are useful in devising preventive measures. Only the eye lesions and circumstances most frequently encountered in the insurance statistics are mentioned here. Let us stress that workers’ compensation can be claimed for most eye injuries.
Eye conditions caused by foreign bodies
These conditions are seen particularly among turners, polishers, foundry workers, boilermakers, masons and quarrymen. The foreign bodies may be inert substances such as sand, irritant metals such as iron or lead, or animal or vegetable organic materials (dusts). This is why, in addition to the eye lesions, complications such as infections and intoxications may occur if the amount of substance introduced into the organism is sufficiently large. Lesions produced by foreign bodies will of course be more or less disabling, depending on whether they remain in the outer layers of the eye or penetrate deeply into the bulb; treatment will thus be quite different and sometimes requires the immediate transfer of the victim to the eye clinic.
Burns of the eye
Burns are caused by various agents: flashes or flames (during a gas explosion); molten metal (the seriousness of the lesion depends on the melting point, with metals melting at higher temperature causing more serious damage); and chemical burns due, for example, to strong acids and bases. Burns due to boiling water, electrical burns and many others also occur.
Injuries due to compressed air
These are very common. Two phenomena play a part: the force of the jet itself (and the foreign bodies accelerated by the air flow); and the shape of the jet, a less concentrated jet being less harmful.
Eye conditions caused by radiation
Ultraviolet (UV) radiation
The source of the rays may be the sun or certain lamps. The degree of penetration into the eye (and consequently the danger of the exposure) depends on the wavelength. Three zones have been defined by the International Lighting Commission: UVC (280 to 100 nm) rays are absorbed at the level of the cornea and conjunctiva; UVB (315 to 280 nm) are more penetrating and reach the anterior segment of the eye; UVA (400 to 315 nm) penetrate still further.
For welders the characteristic effects of exposure have been described, such as acute keratoconjunctivitis, chronic photo-ophthalmia with decreased vision, and so on. The welder is subjected to a considerable amount of visible light, and it is essential that the eyes be protected with adequate filters. Snowblindness, a very painful condition for workers in mountains, needs to be avoided by wearing appropriate sunglasses.
Infrared radiation
Infrared rays are situated between the visible rays and the shortest radio-electric waves. They begin, according to the International Lighting Commission, at 750 nm. Their penetration into the eye depends on their wavelength; the longest infrared rays can reach the lens and even the retina. Their effect on the eye is due to their calorigenicity. The characteristic condition is found in those who blow glass opposite the oven. Other workers, such as blast furnace workers, suffer from thermal irradiation with various clinical effects (such as keratoconjunctivitis, or membranous thickening of the conjunctiva).
LASER (Light amplification by stimulated emission of radiation)
The wavelength of the emission depends on the type of laser—visible light, ultraviolet and infrared radiation. It is principally the quantity of energy projected that determines the level of the danger incurred.
Ultraviolet rays cause inflammatory lesions; infrared rays can cause caloric lesions; but the greatest risk is destruction of retinal tissue by the beam itself, with loss of vision in the affected area.
Radiation from cathode screens
The emissions coming from the cathode screens commonly used in offices (x rays, ultraviolet, infrared and radio rays) are all situated below the international standards. There is no evidence of any relationship between video terminal work and the onset of cataract (Rubino 1990).
Harmful substances
Certain solvents, such as the esters and aldehydes (formaldehyde being very widely used), are irritating to the eyes. The inorganic acids, whose corrosive action is well known, cause tissue destruction and chemical burns by contact. The organic acids are also dangerous. Alcohols are irritants. Caustic soda, an extremely strong base, is a powerful corrosive that attacks the eyes and the skin. Also included in the list of harmful substances are certain plastic materials (Grant 1979) as well as allergenic dusts or other substances such as exotic woods, feathers and so on.
Finally, infectious occupational diseases can be accompanied by effects on the eyes.
Protective glasses
Since the wearing of individual protection (glasses and masks) can obstruct vision (reduction of visual acuity owing to loss of transparency of the glasses on account of the projection of foreign bodies, and obstacles in the visual field such as the sidepieces of glasses), workplace hygiene also tends towards using other means such as the extraction of dust and dangerous particles from the air through general ventilation.
The occupational physician is frequently called upon to advise on the quality of glasses adapted to the risk; national and international directives will guide this choice. Moreover, better goggles are now available, which include improvements in efficacy, comfort and even aesthetics.
In the United States, for example, reference can be made to ANSI standards (particularly ANSI Z87.1-1979) that have the force of law under the federal Occupational Safety and Health Act (Fox 1973). ISO Standard No. 4007-1977 refers also to protective devices. In France, recommendations and protective material are available from the INRS in Nancy. In Switzerland, the national insurance company CNA provides rules and procedures for extraction of foreign bodies at the workplace. For serious damage, it is preferable to send the injured worker to the eye doctor or the eye clinic.
Finally, people with eye pathologies may be more at risk than others; to discuss such a controversial problem goes beyond the scope of this article. As previously said, their eye doctor should be aware of the dangers that they may encounter at their workplace and survey them carefully.
Conclusion
At the workplace, most information and signals are visual in nature, although acoustic signals may play a role; nor should we forget the importance of tactile signals in manual work, as well as in office work (for example, the speed of a keyboard).
Our knowledge of the eye and vision comes mostly from two sources: medical and scientific. For the purpose of diagnosis of eye defects and diseases, techniques have been developed which measure visual functions; these procedures may not be the most effective for occupational testing purposes. Conditions of medical examination are indeed very far from those which are encountered at the workplace; for example, to determine visual acuity the eye doctor will make use of charts or instruments where contrast between test object and background is the highest possible, where the edges of test objects are sharp, where no disturbing glare sources are perceptible and so on. In real life, lighting conditions are often poor and visual performance is under stress for several hours.
This emphasizes the need to utilize laboratory apparatus and instrumentation which display a higher predictive power for visual strain and fatigue at the workplace.
Many of the scientific experiments reported in textbooks were performed for a better theoretical understanding of the visual system, which is very complex. References in this article have been limited to that knowledge which is immediately useful in occupational health.
While pathological conditions may impede some people in fulfilling the visual requirements of a job, it seems safer and fairer—apart from highly demanding jobs with their own regulations (aviation, for example)—to give the eye doctor the power of decision, rather than refer to general rules; and it is in this way that most countries operate. Guidelines are available for more information.
On the other hand, hazards exist for the eye when exposed at the workplace to various noxious agents, whether physical or chemical. Hazards for the eye in industry are briefly enumerated. From scientific knowledge, no danger of developing cataracts may be expected from working on a VDU.