Hazard Surveillance and Survey Methods
Occupational surveillance involves active programmes to anticipate, observe, measure, evaluate and control exposures to potential health hazards in the workplace. Surveillance often involves a team of people that includes an occupational hygienist, occupational physician, occupational health nurse, safety officer, toxicologist and engineer. Depending upon the occupational environment and problem, three surveillance methods can be employed: medical, environmental and biological. Medical surveillance is used to detect the presence or absence of adverse health effects for an individual from occupational exposure to contaminants, by performing medical examinations and appropriate biological tests. Environmental surveillance is used to document potential exposure to contaminants for a group of employees, by measuring the concentration of contaminants in the air, in bulk samples of materials, and on surfaces. Biological surveillance is used to document the absorption of contaminants into the body and correlate with environmental contaminant levels, by measuring the concentration of hazardous substances or their metabolites in the blood, urine or exhaled breath of workers.
Medical Surveillance
Medical surveillance is performed because diseases can be caused or exacerbated by exposure to hazardous substances. It requires an active programme with professionals who are knowledgeable about occupational diseases, diagnoses and treatment. Medical surveillance programmes provide steps to protect, educate, monitor and, in some cases, compensate the employee. It can include pre-employment screening programmes, periodic medical examinations, specialized tests to detect early changes and impairment caused by hazardous substances, medical treatment and extensive record keeping. Pre-employment screening involves the evaluation of occupational and medical history questionnaires and results of physical examinations. Questionnaires provide information concerning past illnesses and chronic diseases (especially asthma, skin, lung and heart diseases) and past occupational exposures. There are ethical and legal implications of pre-employment screening programmes if they are used to determine employment eligibility. However, they are fundamentally important when used to (1) provide a record of previous employment and associated exposures, (2) establish a baseline of health for an employee and (3) test for hypersusceptibility. Medical examinations can include audiometric tests for hearing loss, vision tests, tests of organ function, evaluation of fitness for wearing respiratory protection equipment, and baseline urine and blood tests. Periodic medical examinations are essential for evaluating and detecting trends in the onset of adverse health effects and may include biological monitoring for specific contaminants and the use of other biomarkers.
Environmental and Biological Surveillance
Environmental and biological surveillance starts with an occupational hygiene survey of the work environment to identify potential hazards and contaminant sources, and determine the need for monitoring. For chemical agents, monitoring could involve air, bulk, surface and biological sampling. For physical agents, monitoring could include noise, temperature and radiation measurements. If monitoring is indicated, the occupational hygienist must develop a sampling strategy that includes which employees, processes, equipment or areas to sample, the number of samples, how long to sample, how often to sample, and the sampling method. Industrial hygiene surveys vary in complexity and focus depending upon the purpose of the investigation, type and size of establishment, and nature of the problem.
There are no rigid formulas for performing surveys; however, thorough preparation prior to the on-site inspection significantly increases effectiveness and efficiency. Investigations that are motivated by employee complaints and illnesses have an additional focus of identifying the cause of the health problems. Indoor air quality surveys focus on indoor as well as outdoor sources of contamination. Regardless of the occupational hazard, the overall approach to surveying and sampling workplaces is similar; therefore, this chapter will use chemical agents as a model for the methodology.
Routes of Exposure
The mere presence of occupational stresses in the workplace does not automatically imply that there is a significant potential for exposure; the agent must reach the worker. For chemicals, the liquid or vapour form of the agent must make contact with and/or be absorbed into the body to induce an adverse health effect. If the agent is isolated in an enclosure or captured by a local exhaust ventilation system, the exposure potential will be low, regardless of the chemical’s inherent toxicity.
The route of exposure can impact the type of monitoring performed as well as the hazard potential. For chemical and biological agents, workers are exposed through inhalation, skin contact, ingestion and injection; the most common routes of absorption in the occupational environment are through the respiratory tract and the skin. To assess inhalation, the occupational hygienist observes the potential for chemicals to become airborne as gases, vapours, dusts, fumes or mists.
Skin absorption of chemicals is important primarily when there is direct contact with the skin through splashing, spraying, wetting or immersion with fat-soluble hydrocarbons and other organic solvents. Immersion includes body contact with contaminated clothing, hand contact with contaminated gloves, and hand and arm contact with bulk liquids. For some substances, such as amines and phenols, skin absorption can be as rapid as absorption through the lungs for substances that are inhaled. For some contaminants such as pesticides and benzidine dyes, skin absorption is the primary route of absorption, and inhalation is a secondary route. Such chemicals can readily enter the body through the skin, increase body burden and cause systemic damage. When allergic reactions or repeated washing dries and cracks the skin, there is a dramatic increase in the number and type of chemicals that can be absorbed into the body. Ingestion, an uncommon route of absorption for gases and vapours, can be important for particulates, such as lead. Ingestion can occur from eating contaminated food, eating or smoking with contaminated hands, and coughing and then swallowing previously inhaled particulates.
Injection of materials directly into the bloodstream can occur from hypodermic needles inadvertently puncturing the skin of health care workers in hospitals, and from high-velocity projectiles released from high-pressure sources and directly contacting the skin. Airless paint sprayers and hydraulic systems have pressures high enough to puncture the skin and introduce substances directly into the body.
The Walk-Through Inspection
The purpose of the initial survey, called the walk-through inspection, is to systematically gather information to judge whether a potentially hazardous situation exists and whether monitoring is indicated. An occupational hygienist begins the walk-through survey with an opening meeting that can include representatives of management, employees, supervisors, occupational health nurses and union representatives. The occupational hygienist can powerfully impact the success of the survey and any subsequent monitoring initiatives by creating a team of people who communicate openly and honestly with one another and understand the goals and scope of the inspection. Workers must be involved and informed from the beginning to ensure that cooperation, not fear, dominates the investigation.
During the meeting, requests are made for process flow diagrams, plant layout drawings, past environmental inspection reports, production schedules, equipment maintenance schedules, documentation of personal protection programmes, and statistics concerning the number of employees, shifts and health complaints. All hazardous materials used and produced by an operation are identified and quantified. A chemical inventory of products, by-products, intermediates and impurities is assembled and all associated Material Safety Data Sheets are obtained. Equipment maintenance schedules, age and condition are documented because the use of older equipment may result in higher exposures due to the lack of controls.
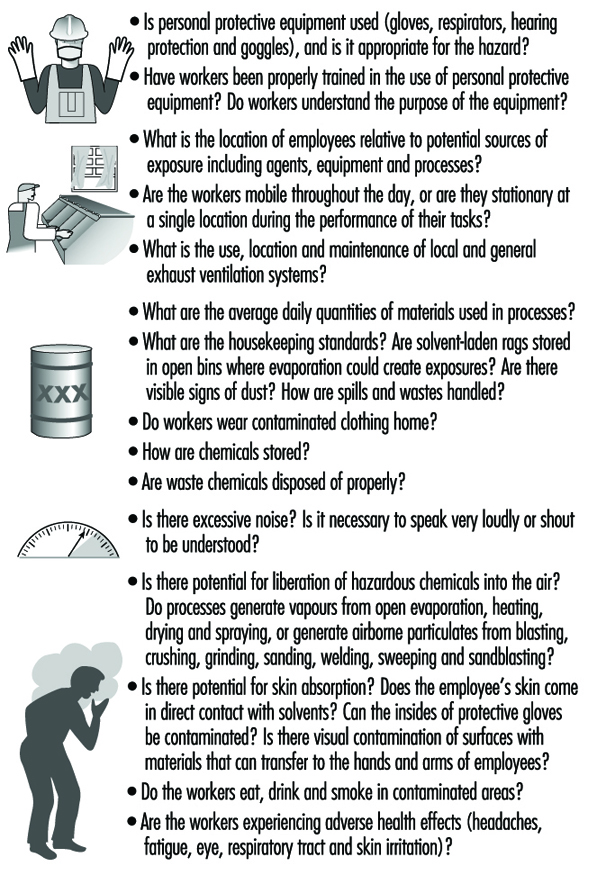
After the meeting, the occupational hygienist performs a visual walk-through survey of the workplace, scrutinizing the operations and work practices, with the goal of identifying potential occupational stresses, ranking the potential for exposure, identifying the route of exposure and estimating the duration and frequency of exposure. Examples of occupational stresses are given in figure 1. The occupational hygienist uses the walk-through inspection to observe the workplace and have questions answered. Examples of observations and questions are given in figure 2.
Figure 1. Occupational stresses.
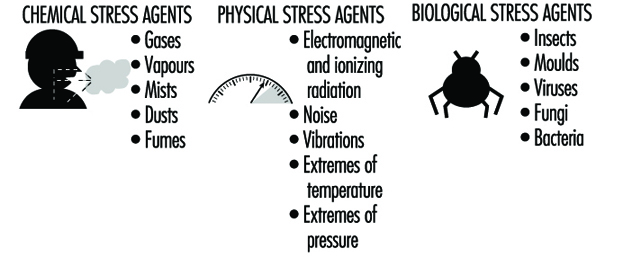
Figure 2. Observations and questions to ask on a walk-through survey.
In addition to the questions shown in figure 5, questions should be asked that uncover what is not immediately obvious. Questions could address:
- non-routine tasks and schedules for maintenance and cleaning activities
- recent process changes and chemical substitutions
- recent physical changes in the work environment
- changes in job functions
- recent renovations and repairs.
Non-routine tasks can result in significant peak exposures to chemicals that are difficult to predict and measure during a typical workday. Process changes and chemical substitutions may alter the release of substances into the air and affect subsequent exposure. Changes in the physical layout of a work area can alter the effectiveness of an existing ventilation system. Changes in job functions can result in tasks performed by inexperienced workers and increased exposures. Renovations and repairs may introduce new materials and chemicals into the work environment which off-gas volatile organic chemicals or are irritants.
Indoor Air Quality Surveys
Indoor air quality surveys are distinct from traditional occupational hygiene surveys because they are typically encountered in non-industrial workplaces and may involve exposures to mixtures of trace quantities of chemicals, none of which alone appears capable of causing illness (Ness 1991). The goal of indoor air quality surveys is similar to occupational hygiene surveys in terms of identifying sources of contamination and determining the need for monitoring. However, indoor air quality surveys are always motivated by employee health complaints. In many cases, the employees have a variety of symptoms including headaches, throat irritation, lethargy, coughing, itching, nausea and non-specific hypersensitivity reactions that disappear when they go home. When health complaints do not disappear after the employees leave work, non-occupational exposures should be considered as well. Non-occupational exposures include hobbies, other jobs, urban air pollution, passive smoking and indoor exposures in the home. Indoor air quality surveys frequently use questionnaires to document employee symptoms and complaints and link them to job location or job function within the building. The areas with the highest incidence of symptoms are then targeted for further inspection.
Sources of indoor air contaminants that have been documented in indoor air quality surveys include:
- inadequate ventilation (52%)
- contamination from inside of the building (17%)
- contamination from outside of the building (11%)
- microbial contamination (5%)
- contamination from the building materials (3%)
- unknown causes (12%).
For indoor air quality investigations, the walk-through inspection is essentially a building and environmental inspection to determine potential sources of contamination both inside and outside of the building. Inside building sources include:
- building construction materials such as insulation, particleboard, adhesives and paints
- human occupants that can release chemicals from metabolic activities
- human activities such as smoking
- equipment such as copy machines
- ventilation systems that can be contaminated with micro-organisms.
Observations and questions that can be asked during the survey are listed in figure 3.
Figure 3. Observations and questions for an indoor air quality walk-through survey.

Sampling and Measurement Strategies
Occupational exposure limits
After the walk-through inspection is completed, the occupational hygienist must determine whether sampling is necessary; sampling should be performed only if the purpose is clear. The occupational hygienist must ask, “What will be made of the sampling results and what questions will the results answer?” It is relatively easy to sample and obtain numbers; it is far more difficult to interpret them.
Air and biological sampling data are usually compared to recommended or mandated occupational exposure limits (OELs). Occupational exposure limits have been developed in many countries for inhalation and biological exposure to chemical and physical agents. To date, out of a universe of over 60,000 commercially used chemicals, approximately 600 have been evaluated by a variety of organizations and countries. The philosophical bases for the limits are determined by the organizations that have developed them. The most widely used limits, called threshold limit values (TLVs), are those issued in the United States by the American Conference of Governmental Industrial Hygienists (ACGIH). Most of the OELs used by the Occupational Safety and Health Administration (OSHA) in the United States are based upon the TLVs. However, the National Institute for Occupational Safety and Health (NIOSH) of the US Department of Health and Human Services has suggested their own limits, called recommended exposure limits (RELs).
For airborne exposures, there are three types of TLVs: an eight-hour time-weighted-average exposure, TLV-TWA, to protect against chronic health effects; a fifteen-minute average short-term exposure limit, TLV-STEL, to protect against acute health effects; and an instantaneous ceiling value, TLV-C, to protect against asphyxiants or chemicals that are immediately irritating. Guidelines for biological exposure levels are called biological exposure indices (BEIs). These guidelines represent the concentration of chemicals in the body that would correspond to inhalation exposure of a healthy worker at a specific concentration in air. Outside of the United States as many as 50 countries or groups have established OELs, many of which are identical to the TLVs. In Britain, the limits are called the Health and Safety Executive Occupational Exposure Standards (OES), and in Germany OELs are called Maximum Workplace Concentrations (MAKs).
OELs have been set for airborne exposures to gases, vapours and particulates; they do not exist for airborne exposures to biological agents. Therefore, most investigations of bioaerosol exposure compare indoor with outdoor concentrations. If the indoor/outdoor profile and concentration of organisms is different, an exposure problem may exist. There are no OELs for skin and surface sampling, and each case must be evaluated separately. In the case of surface sampling, concentrations are usually compared with acceptable background concentrations that were measured in other studies or were determined in the current study. For skin sampling, acceptable concentrations are calculated based upon toxicity, rate of absorption, amount absorbed and total dose. In addition, biological monitoring of a worker may be used to investigate skin absorption.
Sampling strategy
An environmental and biological sampling strategy is an approach to obtaining exposure measurements that fulfils a purpose. A carefully designed and effective strategy is scientifically defensible, optimizes the number of samples obtained, is cost-effective and prioritizes needs. The goal of the sampling strategy guides decisions concerning what to sample (selection of chemical agents), where to sample (personal, area or source sample), whom to sample (which worker or group of workers), sample duration (real-time or integrated), how often to sample (how many days), how many samples, and how to sample (analytical method). Traditionally, sampling performed for regulatory purposes involves brief campaigns (one or two days) that concentrate on worst-case exposures. While this strategy requires a minimum expenditure of resources and time, it often captures the least amount of information and has little applicability to evaluating long-term occupational exposures. To evaluate chronic exposures so that they are useful for occupational physicians and epidemiological studies, sampling strategies must involve repeated sampling over time for large numbers of workers.
Purpose
The goal of environmental and biological sampling strategies is either to evaluate individual employee exposures or to evaluate contaminant sources. Employee monitoring may be performed to:
- evaluate individual exposures to chronic or acute toxicants
- respond to employee complaints about health and odours
- create a baseline of exposures for a long-term monitoring programme
- determine whether exposures comply with governmental regulations
- evaluate the effectiveness of engineering or process controls
- evaluate acute exposures for emergency response
- evaluate exposures at hazardous waste sites
- evaluate the impact of work practices on exposure
- evaluate exposures for individual job tasks
- investigate chronic illnesses such as lead and mercury poisoning
- investigate the relationship between occupational exposure and disease
- carry out an epidemiological study.
Source and ambient air monitoring may be performed to:
- establish a need for engineering controls such as local exhaust ventilation systems and enclosures
- evaluate the impact of equipment or process modifications
- evaluate the effectiveness of engineering or process controls
- evaluate emissions from equipment or processes
- evaluate compliance after remediation activities such as asbestos and lead removal
- respond to indoor air, community illness and odour complaints
- evaluate emissions from hazardous waste sites
- investigate an emergency response
- carry out an epidemiological study.
When monitoring employees, air sampling provides surrogate measures of dose resulting from inhalation exposure. Biological monitoring can provide the actual dose of a chemical resulting from all absorption routes including inhalation, ingestion, injection and skin. Thus, biological monitoring can more accurately reflect an individual’s total body burden and dose than air monitoring. When the relationship between airborne exposure and internal dose is known, biological monitoring can be used to evaluate past and present chronic exposures.
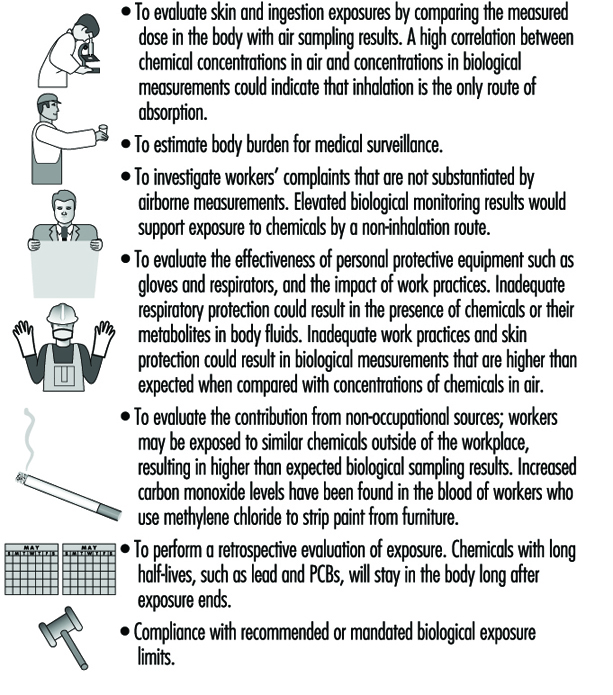
Goals of biological monitoring are listed in figure 4.
Figure 4. Goals of biological monitoring.
Biological monitoring has its limitations and should be performed only if it accomplishes goals that cannot be accomplished with air monitoring alone (Fiserova-Bergova 1987). It is invasive, requiring samples to be taken directly from workers. Blood samples generally provide the most useful biological medium to monitor; however, blood is taken only if non-invasive tests such as urine or exhaled breath are not applicable. For most industrial chemicals, data concerning the fate of chemicals absorbed by the body are incomplete or non-existent; therefore, only a limited number of analytical measurement methods are available, and many are not sensitive or specific.
Biological monitoring results may be highly variable between individuals exposed to the same airborne concentrations of chemicals; age, health, weight, nutritional status, drugs, smoking, alcohol consumption, medication and pregnancy can impact uptake, absorption, distribution, metabolism and elimination of chemicals.
What to sample
Most occupational environments have exposures to multiple contaminants. Chemical agents are evaluated both individually and as multiple simultaneous assaults on workers. Chemical agents can act independently within the body or interact in a way that increases the toxic effect. The question of what to measure and how to interpret the results depends upon the biological mechanism of action of the agents when they are within the body. Agents can be evaluated separately if they act independently on altogether different organ systems, such as an eye irritant and a neurotoxin. If they act on the same organ system, such as two respiratory irritants, their combined effect is important. If the toxic effect of the mixture is the sum of the separate effects of the individual components, it is termed additive. If the toxic effect of the mixture is greater than the sum of the effects of the separate agents, their combined effect is termed synergistic. Exposure to cigarette smoking and inhalation of asbestos fibres gives rise to a much greater risk of lung cancer than a simple additive effect.Sampling all the chemical agents in a workplace would be both expensive and not necessarily defensible. The occupational hygienist must prioritize the laundry list of potential agents by hazard or risk to determine which agents receive the focus.
Factors involved in ranking chemicals include:
- whether the agents interact independently, additively or synergistically
- inherent toxicity of the chemical agent
- quantities used and generated
- number of people potentially exposed
- anticipated duration and concentration of the exposure
- confidence in the engineering controls
- anticipated changes in the processes or controls
- occupational exposure limits and guidelines.
To provide the best estimate of employee exposure, air samples are taken in the breathing zone of the worker (within a 30 cm radius of the head), and are called personal samples. To obtain breathing zone samples, the sampling device is placed directly on the worker for the duration of the sampling. If air samples are taken near the worker, outside of the breathing zone, they are called area samples. Area samples tend to underestimate personal exposures and do not provide good estimates of inhalation exposure. However, area samples are useful for evaluating contaminant sources and measuring ambient levels of contaminants. Area samples can be taken while walking through the workplace with a portable instrument, or with fixed sampling stations. Area sampling is routinely used at asbestos abatement sites for clearance sampling and for indoor air investigations.
Whom to sample
Ideally, to evaluate occupational exposure, each worker would be individually sampled for multiple days over the course of weeks or months. However, unless the workplace is small (<10 employees), it is usually not feasible to sample all the workers. To minimize the sampling burden in terms of equipment and cost, and increase the effectiveness of the sampling programme, a subset of employees from the workplace is sampled, and their monitoring results are used to represent exposures for the larger work force.
To select employees who are representative of the larger work force, one approach is to classify employees into groups with similar expected exposures, called homogeneous exposure groups (HEGs) (Corn 1985). After the HEGs are formed, a subset of workers is randomly selected from each group for sampling. Methods for determining the appropriate sample sizes assume a lognormal distribution of exposures, an estimated mean exposure, and a geometric standard deviation of 2.2 to 2.5. Prior sampling data might allow a smaller geometric standard deviation to be used. To classify employees into distinct HEGs, most occupational hygienists observe workers at their jobs and qualitatively predict exposures.
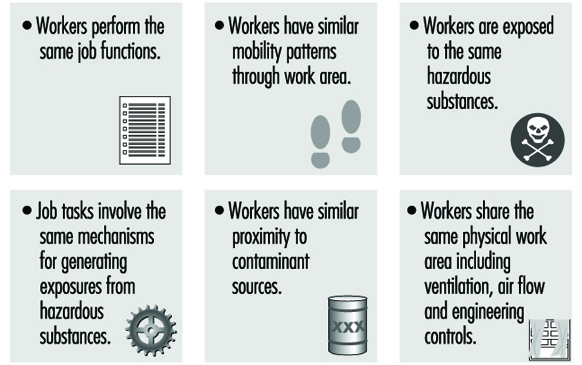
There are many approaches to forming HEGs; generally, workers may be classified by job task similarity or work area similarity. When both job and work area similarity are used, the method of classification is called zoning (see figure 5). Once airborne, chemical and biological agents can have complex and unpredictable spatial and temporal concentration patterns throughout the work environment. Therefore, proximity of the source relative to the employee may not be the best indicator of exposure similarity. Exposure measurements made on workers initially expected to have similar exposures may show that there is more variation between workers than predicted. In these cases, the exposure groups should be reconstructed into smaller sets of workers, and sampling should continue to verify that workers within each group actually have similar exposures (Rappaport 1995).
Figure 5. Factors involved in creating HEGs using zoning.
Exposures can be estimated for all the employees, regardless of job title or risk, or it can be estimated only for employees who are assumed to have the highest exposures; this is called worst-case sampling. The selection of worst-case sampling employees may be based upon production, proximity to the source, past sampling data, inventory and chemical toxicity. The worst-case method is used for regulatory purposes and does not provide a measure of long-term mean exposure and day-to-day variability. Task-related sampling involves selecting workers with jobs that have similar tasks that occur on a less than daily basis.
There are many factors that enter into exposure and can affect the success of HEG classification, including the following:
- Employees rarely perform the same work even when they have the same job description, and rarely have the same exposures.
- Employee work practices can significantly alter exposure.
- Workers who are mobile throughout the work area may be unpredictably exposed to several contaminant sources throughout the day.
- Air movement in a workplace can unpredictably increase the exposures of workers who are located a considerable distance from a source.
- Exposures may be determined not by the job tasks but by the work environment.
Sample duration
The concentrations of chemical agents in air samples are either measured directly in the field, obtaining immediate results (real-time or grab), or are collected over time in the field on sampling media or in sampling bags and are measured in a laboratory (integrated) (Lynch 1995). The advantage of real-time sampling is that results are obtained quickly onsite, and can capture measurements of short-term acute exposures. However, real-time methods are limited because they are not available for all contaminants of concern and they may not be analytically sensitive or accurate enough to quantify the targeted contaminants. Real-time sampling may not be applicable when the occupational hygienist is interested in chronic exposures and requires time-weighted-average measurements to compare with OELs.Real-time sampling is used for emergency evaluations, obtaining crude estimates of concentration, leak detection, ambient air and source monitoring, evaluating engineering controls, monitoring short-term exposures that are less than 15 minutes, monitoring episodic exposures, monitoring highly toxic chemicals (carbon monoxide), explosive mixtures and process monitoring. Real-time sampling methods can capture changing concentrations over time and provide immediate qualitative and quantitative information. Integrated air sampling is usually performed for personal monitoring, area sampling and for comparing concentrations to time-weighted-average OELs. The advantages of integrated sampling are that methods are available for a wide variety of contaminants; it can be used to identify unknowns; accuracy and specificity is high and limits of detection are usually very low. Integrated samples that are analysed in a laboratory must contain enough contaminant to meet minimum detectable analytical requirements; therefore, samples are collected over a predetermined time period.
In addition to analytical requirements of a sampling method, sample duration should be matched to the sampling purpose. For source sampling, duration is based upon the process or cycle time, or when there are anticipated peaks of concentrations. For peak sampling, samples should be collected at regular intervals throughout the day to minimize bias and identify unpredictable peaks. The sampling period should be short enough to identify peaks while also providing a reflection of the actual exposure period.
For personal sampling, duration is matched to the occupational exposure limit, task duration or anticipated biological effect. Real-time sampling methods are used for assessing acute exposures to irritants, asphyxiants, sensitizers and allergenic agents. Chlorine, carbon monoxide and hydrogen sulphide are examples of chemicals that can exert their effects quickly and at relatively low concentrations.
Chronic disease agents such as lead and mercury are usually sampled for a full shift (seven hours or more per sample), using integrated sampling methods. To evaluate full shift exposures, the occupational hygienist uses either a single sample or a series of consecutive samples that cover the entire shift. The sampling duration for exposures that occur for less than a full shift are usually associated with particular tasks or processes. Construction workers, indoor maintenance personnel and maintenance road crews are examples of jobs with exposures that are tied to tasks.
How many samples and how often to sample?
Concentrations of contaminants can vary minute to minute, day to day and season to season, and variability can occur between individuals and within an individual. Exposure variability affects both the number of samples and the accuracy of the results. Variations in exposure can arise from different work practices, changes in pollutant emissions, the volume of chemicals used, production quotas, ventilation, temperature changes, worker mobility and task assignments. Most sampling campaigns are performed for a couple of days in a year; therefore, the measurements obtained are not representative of exposure. The period over which samples are collected is very short compared with the unsampled period; the occupational hygienist must extrapolate from the sampled to the unsampled period. For long-term exposure monitoring, each worker selected from a HEG should be sampled multiple times over the course of weeks or months, and exposures should be characterized for all shifts. While the day shift may be the busiest, the night shift may have the least supervision and there may be lapses in work practices.
Measurement Techniques
Active and passive sampling
Contaminants are collected on sampling media either by actively pulling an air sample through the media, or by passively allowing the air to reach the media. Active sampling uses a battery-powered pump, and passive sampling uses diffusion or gravity to bring the contaminants to the sampling media. Gases, vapours, particulates and bioaerosols are all collected by active sampling methods; gases and vapours can also be collected by passive diffusion sampling.
For gases, vapours and most particulates, once the sample is collected the mass of the contaminant is measured, and concentration is calculated by dividing the mass by the volume of sampled air. For gases and vapours, concentration is expressed as parts per million (ppm) or mg/m3, and for particulates concentration is expressed as mg/m3 (Dinardi 1995).
In integrated sampling, air sampling pumps are critical components of the sampling system because concentration estimates require knowledge of the volume of sampled air. Pumps are selected based upon desired flowrate, ease of servicing and calibration, size, cost and suitability for hazardous environments. The primary selection criterion is flowrate: low-flow pumps (0.5 to 500 ml/min) are used for sampling gases and vapours; high-flow pumps (500 to 4,500 ml/min) are used for sampling particulates, bioaerosols and gases and vapours. To insure accurate sample volumes, pumps must be accurately calibrated. Calibration is performed using primary standards such as manual or electronic soap-bubble meters, which directly measure volume, or secondary methods such as wet test meters, dry gas meters and precision rotameters that are calibrated against primary methods.
Gases and vapours: sampling media
Gases and vapours are collected using porous solid sorbent tubes, impingers, passive monitors and bags. Sorbent tubes are hollow glass tubes that have been filled with a granular solid that enables adsorption of chemicals unchanged on its surface. Solid sorbents are specific for groups of compounds; commonly used sorbents include charcoal, silica gel and Tenax. Charcoal sorbent, an amorphous form of carbon, is electrically nonpolar, and preferentially adsorbs organic gases and vapours. Silica gel, an amorphous form of silica, is used to collect polar organic compounds, amines and some inorganic compounds. Because of its affinity for polar compounds, it will adsorb water vapour; therefore, at elevated humidity, water can displace the less polar chemicals of interest from the silica gel. Tenax, a porous polymer, is used for sampling very low concentrations of nonpolar volatile organic compounds.
The ability to accurately capture the contaminants in air and avoid contaminant loss depends upon the sampling rate, sampling volume, and the volatility and concentration of the airborne contaminant. Collection efficiency of solid sorbents can be adversely affected by increased temperature, humidity, flowrate, concentration, sorbent particle size and number of competing chemicals. As collection efficiency decreases chemicals will be lost during sampling and concentrations will be underestimated. To detect chemical loss, or breakthrough, solid sorbent tubes have two sections of granular material separated by a foam plug. The front section is used for sample collection and the back section is used to determine breakthrough. Breakthrough has occurred when at least 20 to 25% of the contaminant is present in the back section of the tube. Analysis of contaminants from solid sorbents requires extraction of the contaminant from the medium using a solvent. For each batch of sorbent tubes and chemicals collected, the laboratory must determine the desorption efficiency, the efficiency of removal of chemicals from the sorbent by the solvent. For charcoal and silica gel, the most commonly used solvent is carbon disulphide. For Tenax, the chemicals are extracted using thermal desorption directly into a gas chromatograph.
Impingers are usually glass bottles with an inlet tube that allows air to be drawn into the bottle through a solution that collects the gases and vapours by absorption either unchanged in solution or by a chemical reaction. Impingers are used less and less in workplace monitoring, especially for personal sampling, because they can break, and the liquid media can spill onto the employee. There are a variety of types of impingers, including gas wash bottles, spiral absorbers, glass bead columns, midget impingers and fritted bubblers. All impingers can be used to collect area samples; the most commonly used impinger, the midget impinger, can be used for personal sampling as well.
Passive, or diffusion monitors are small, have no moving parts and are available for both organic and inorganic contaminants. Most organic monitors use activated charcoal as the collection medium. In theory, any compound that can be sampled by a charcoal sorbent tube and pump can be sampled using a passive monitor. Each monitor has a uniquely designed geometry to give an effective sampling rate. Sampling starts when the monitor cover is removed and ends when the cover is replaced. Most diffusion monitors are accurate for eight-hour time-weighted-average exposures and are not appropriate for short-term exposures.
Sampling bags can be used to collect integrated samples of gases and vapours. They have permeability and adsorptive properties that enable storage for a day with minimal loss. Bags are made of Teflon (polytetrafluoroethylene) and Tedlar (polyvinylfluoride).
Sampling media: particulate materials
Occupational sampling for particulate materials, or aerosols, is currently in a state of flux; traditional sampling methods will eventually be replaced by particle size selective (PSS) sampling methods. Traditional sampling methods will be discussed first, followed by PSS methods.
The most commonly used media for collecting aerosols are fibre or membrane filters; aerosol removal from the air stream occurs by collision and attachment of the particles to the surface of the filters. The choice of filter medium depends upon the physical and chemical properties of the aerosols to be sampled, the type of sampler and the type of analysis. When selecting filters, they must be evaluated for collection efficiency, pressure drop, hygroscopicity, background contamination, strength and pore size, which can range from 0.01 to 10 μm. Membrane filters are manufactured in a variety of pore sizes and are usually made from cellulose ester, polyvinylchloride or polytetrafluoroethylene. Particle collection occurs at the surface of the filter; therefore, membrane filters are usually used in applications where microscopy will be performed. Mixed cellulose ester filters can be easily dissolved with acid and are usually used for collection of metals for analysis by atomic absorption. Nucleopore filters (polycarbonate) are very strong and thermally stable, and are used for sampling and analysing asbestos fibres using transmission electron microscopy. Fibre filters are usually made of fibreglass and are used to sample aerosols such as pesticides and lead.
For occupational exposures to aerosols, a known volume of air can be sampled through the filters, the total increase in mass (gravimetric analysis) can be measured (mg/m3 air), the total number of particles can be counted (fibres/cc) or the aerosols can be identified (chemical analysis). For mass calculations, the total dust that enters the sampler or only the respirable fraction can be measured. For total dust, the increase in mass represents exposure from deposition in all parts of the respiratory tract. Total dust samplers are subject to error due to high winds passing across the sampler and improper orientation of the sampler. High winds, and filters facing upright, can result in collection of extra particles and overestimation of exposure.
For respirable dust sampling, the increase in mass represents exposure from deposition in the gas exchange (alveolar) region of the respiratory tract. To collect only the respirable fraction, a preclassifier called a cyclone is used to alter the distribution of airborne dust presented to the filter. Aerosols are drawn into the cyclone, accelerated and whirled, causing the heavier particles to be thrown out to the edge of the air stream and dropped to a removal section at the bottom of the cyclone. The respirable particles that are less than 10 μm remain in the air stream and are drawn up and collected on the filter for subsequent gravimetric analysis.
Sampling errors encountered when performing total and respirable dust sampling result in measurements that do not accurately reflect exposure or relate to adverse health effects. Therefore, PSS has been proposed to redefine the relationship between particle size, adverse health impact and sampling method. In PSS sampling, the measurement of particles is related to the sizes that are associated with specific health effects. The International Organization for Standardization (ISO) and the ACGIH have proposed three particulate mass fractions: inhalable particulate mass (IPM), thoracic particulate mass (TPM) and respirable particulate mass (RPM). IPM refers to particles that can be expected to enter through the nose and mouth, and would replace the traditional total mass fraction. TPM refers to particles that can penetrate the upper respiratory system past the larynx. RPM refers to particles that are capable of depositing in the gas-exchange region of the lung, and would replace the current respirable mass fraction. The practical adoption of PSS sampling requires the development of new aerosol sampling methods and PSS-specific occupational exposure limits.
Sampling media: biological materials
There are few standardized methods for sampling biological material or bioaerosols. Although sampling methods are similar to those used for other airborne particulates, viability of most bioaerosols must be preserved to ensure laboratory culturability. Therefore, they are more difficult to collect, store and analyse. The strategy for sampling bioaerosols involves collection directly on semisolid nutrient agar or plating after collection in fluids, incubation for several days and identification and quantification of the cells that have grown. The mounds of cells that have multiplied on the agar can be counted as colony-forming units (CFU) for viable bacteria or fungi, and plaque-forming units (PFU) for active viruses. With the exception of spores, filters are not recommended for bioaerosol collection because dehydration causes cell damage.
Viable aerosolized micro-organisms are collected using all-glass impingers (AGI-30), slit samplers and inertial impactors. Impingers collect bioaerosols in liquid and the slit sampler collects bioaerosols on glass slides at high volumes and flowrates. The impactor is used with one to six stages, each containing a Petri dish, to allow for separation of particles by size.
Interpretation of sampling results must be done on a case-by-case basis because there are no occupational exposure limits. Evaluation criteria must be determined prior to sampling; for indoor air investigations, in particular, samples taken outside of the building are used as a background reference. A rule of thumb is that concentrations should be ten times background to suspect contamination. When using culture plating techniques, concentrations are probably underestimated because of losses of viability during sampling and incubation.
Skin and surface sampling
There are no standard methods for evaluating skin exposure to chemicals and predicting dose. Surface sampling is performed primarily to evaluate work practices and identify potential sources of skin absorption and ingestion. Two types of surface sampling methods are used to assess dermal and ingestion potential: direct methods, which involve sampling the skin of a worker, and indirect methods, which involve wipe sampling surfaces.
Direct skin sampling involves placing gauze pads on the skin to absorb chemicals, rinsing the skin with solvents to remove contaminants and using fluorescence to identify skin contamination. Gauze pads are placed on different parts of the body and are either left exposed or are placed under personal protective equipment. At the end of the workday the pads are removed and are analysed in the laboratory; the distribution of concentrations from different parts of the body are used to identify skin exposure areas. This method is inexpensive and easy to perform; however, the results are limited because gauze pads are not good physical models of the absorption and retention properties of skin, and measured concentrations are not necessarily representative of the entire body.
Skin rinses involve wiping the skin with solvents or placing hands in plastic bags filled with solvents to measure the concentration of chemicals on the surface. This method can underestimate dose because only the unabsorbed fraction of chemicals is collected.
Fluorescence monitoring is used to identify skin exposure for chemicals that naturally fluoresce, such as polynuclear aromatics, and to identify exposures for chemicals in which fluorescent compounds have been intentionally added. The skin is scanned with an ultraviolet light to visualize contamination. This visualization provides workers with evidence of the effect of work practices on exposure; research is underway to quantify the fluorescence intensity and relate it to dose.
Indirect wipe sampling methods involve the use of gauze, glass fibre filters or cellulose paper filters, to wipe the insides of gloves or respirators, or the tops of surfaces. Solvents may be added to increase collection efficiency. The gauze or filters are then analysed in the laboratory. To standardize the results and enable comparison between samples, a square template is used to sample a 100 cm2 area.
Biological media
Blood, urine and exhaled air samples are the most suitable specimens for routine biological monitoring, while hair, milk, saliva and nails are less frequently used. Biological monitoring is performed by collecting bulk blood and urine samples in the workplace and analysing them in the laboratory. Exhaled air samples are collected in Tedlar bags, specially designed glass pipettes or sorbent tubes, and are analysed in the field using direct-reading instruments, or in the laboratory. Blood, urine and exhaled air samples are primarily used to measure the unchanged parent compound (same chemical that is sampled in workplace air), its metabolite or a biochemical change (intermediate) that has been induced in the body. For example, the parent compound lead is measured in blood to evaluate lead exposure, the metabolite mandelic acid is measured in urine for both styrene and ethyl benzene, and carboxyhaemoglobin is the intermediate measured in blood for both carbon monoxide and methylene chloride exposure. For exposure monitoring, the concentration of an ideal determinant will be highly correlated with intensity of exposure. For medical monitoring, the concentration of an ideal determinant will be highly correlated with target organ concentration.
The timing of specimen collection can impact the usefulness of the measurements; samples should be collected at times which most accurately reflect exposure. Timing is related to the excretion biological half-life of a chemical, which reflects how quickly a chemical is eliminated from the body; this can vary from hours to years. Target organ concentrations of chemicals with short biological half-lives closely follow the environmental concentration; target organ concentrations of chemicals with long biological half-lives fluctuate very little in response to environmental exposures. For chemicals with short biological half-lives, less than three hours, a sample is taken immediately at the end of the workday, before concentrations rapidly decline, to reflect exposure on that day. Samples may be taken at any time for chemicals with long half-lives, such as polychlorinated biphenyls and lead.
Real-time monitors
Direct-reading instruments provide real-time quantification of contaminants; the sample is analysed within the equipment and does not require off-site laboratory analysis (Maslansky and Maslansky 1993). Compounds can be measured without first collecting them on separate media, then shipping, storing and analysing them. Concentration is read directly from a meter, display, strip chart recorder and data logger, or from a colour change. Direct-reading instruments are primarily used for gases and vapours; a few instruments are available for monitoring particulates. Instruments vary in cost, complexity, reliability, size, sensitivity and specificity. They include simple devices, such as colorimetric tubes, that use a colour change to indicate concentration; dedicated instruments that are specific for a chemical, such as carbon monoxide indicators, combustible gas indicators (explosimeters) and mercury vapour meters; and survey instruments, such as infrared spectrometers, that screen large groups of chemicals. Direct-reading instruments use a variety of physical and chemical methods to analyse gases and vapours, including conductivity, ionization, potentiometry, photometry, radioactive tracers and combustion.
Commonly used portable direct-reading instruments include battery-powered gas chromatographs, organic vapour analysers and infrared spectrometers. Gas chromatographs and organic vapour monitors are primarily used for environmental monitoring at hazardous waste sites and for community ambient air monitoring. Gas chromatographs with appropriate detectors are specific and sensitive, and can quantify chemicals at very low concentrations. Organic vapour analysers are usually used to measure classes of compounds. Portable infrared spectrometers are primarily used for occupational monitoring and leak detection because they are sensitive and specific for a wide range of compounds.
Small direct-reading personal monitors are available for a few common gases (chlorine, hydrogen cyanide, hydrogen sulphide, hydrazine, oxygen, phosgene, sulphur dioxide, nitrogen dioxide and carbon monoxide). They accumulate concentration measurements over the course of the day and can provide a direct readout of time-weighted-average concentration as well as provide a detailed contaminant profile for the day.
Colorimetric tubes (detector tubes) are simple to use, cheap and available for a wide variety of chemicals. They can be used to quickly identify classes of air contaminants and provide ballpark estimates of concentrations that can be used when determining pump flow rates and volumes. Colorimetric tubes are glass tubes filled with solid granular material which has been impregnated with a chemical agent that can react with a contaminant and create a colour change. After the two sealed ends of a tube are broken open, one end of the tube is placed in a hand pump. The recommended volume of contaminated air is sampled through the tube by using a specified number of pump strokes for a particular chemical. A colour change or stain is produced on the tube, usually within two minutes, and the length of the stain is proportional to concentration. Some colorimetric tubes have been adapted for long duration sampling, and are used with battery-powered pumps that can run for at least eight hours. The colour change produced represents a time-weighted-average concentration. Colorimetric tubes are good for both qualitative and quantitative analysis; however, their specificity and accuracy is limited. The accuracy of colorimetric tubes is not as high as that of laboratory methods or many other real-time instruments. There are hundreds of tubes, many of which have cross-sensitivities and can detect more than one chemical. This can result in interferences that modify the measured concentrations.
Direct-reading aerosol monitors cannot distinguish between contaminants, are usually used for counting or sizing particles, and are primarily used for screening, not to determine TWA or acute exposures. Real-time instruments use optical or electrical properties to determine total and respirable mass, particle count and particle size. Light-scattering aerosol monitors, or aerosol photometers, detect the light scattered by particles as they pass through a volume in the equipment. As the number of particles increases, the amount of scattered light increases and is proportional to mass. Light-scattering aerosol monitors cannot be used to distinguish between particle types; however, if they are used in a workplace where there are a limited number of dusts present, the mass can be attributed to a particular material. Fibrous aerosol monitors are used to measure the airborne concentration of particles such as asbestos. Fibres are aligned in an oscillating electric field and are illuminated with a helium neon laser; the resulting pulses of light are detected by a photomultiplier tube. Light-attenuating photometers measure the extinction of light by particles; the ratio of incident light to measured light is proportional to concentration.
Analytical Techniques
There are many available methods for analysing laboratory samples for contaminants. Some of the more commonly used techniques for quantifying gases and vapours in air include gas chromatography, mass spectrometry, atomic absorption, infrared and UV spectroscopy and polarography.
Gas chromatography is a technique used to separate and concentrate chemicals in mixtures for subsequent quantitative analysis. There are three main components to the system: the sample injection system, a column and a detector. A liquid or gaseous sample is injected using a syringe, into an air stream that carries the sample through a column where the components are separated. The column is packed with materials that interact differently with different chemicals, and slows down the movement of the chemicals. The differential interaction causes each chemical to travel through the column at a different rate. After separation, the chemicals go directly into a detector, such as a flame ionization detector (FID), photo-ionization detector (PID) or electron capture detector (ECD); a signal proportional to concentration is registered on a chart recorder. The FID is used for almost all organics including: aromatics, straight chain hydrocarbons, ketones and some chlorinated hydrocarbons. Concentration is measured by the increase in the number of ions produced as a volatile hydrocarbon is burned by a hydrogen flame. The PID is used for organics and some inorganics; it is especially useful for aromatic compounds such as benzene, and it can detect aliphatic, aromatic and halogenated hydrocarbons. Concentration is measured by the increase in the number of ions produced when the sample is bombarded by ultraviolet radiation. The ECD is primarily used for halogen-containing chemicals; it gives a minimal response to hydrocarbons, alcohols and ketones. Concentration is measured by the current flow between two electrodes caused by ionization of the gas by radioactivity.
The mass spectrophotometer is used to analyse complex mixtures of chemicals present in trace amounts. It is often coupled with a gas chromatograph for the separation and quantification of different contaminants.
Atomic absorption spectroscopy is primarily used for the quantification of metals such as mercury. Atomic absorption is the absorption of light of a particular wavelength by a free, ground-state atom; the quantity of light absorbed is related to concentration. The technique is highly specific, sensitive and fast, and is directly applicable to approximately 68 elements. Detection limits are in the sub-ppb to low-ppm range.
Infrared analysis is a powerful, sensitive, specific and versatile technique. It uses the absorption of infrared energy to measure many inorganic and organic chemicals; the amount of light absorbed is proportional to concentration. The absorption spectrum of a compound provides information enabling its identification and quantification.
UV absorption spectroscopy is used for analysis of aromatic hydrocarbons when interferences are known to be low. The amount of absorption of UV light is directly proportional to concentration.
Polarographic methods are based upon the electrolysis of a sample solution using an easily polarized electrode and a nonpolarizable electrode. They are used for qualitative and quantitative analysis of aldehydes, chlorinated hydrocarbons and metals.