Behaviour Modification: A Safety Management Technique
Safety management has two main tasks. It is incumbent on the safety organization (1) to maintain the company’s safety performance on the current level and (2) to implement measures and programmes which improve the safety performance. The tasks are different and require different approaches. This article describes a method for the second task which has been used in numerous companies with excellent results. The background of this method is behaviour modification, which is a technique for improving safety which has many applications in business and industry. Two independently conducted experiments of the first scientific applications of behaviour modification were published by Americans in 1978. The applications were in quite different locations. Komaki, Barwick and Scott (1978) did their study in a bakery. Sulzer-Azaroff (1978) did her study in laboratories at a university.
Consequences of Behaviour
Behaviour modification puts the focus on the consequences of a behaviour. When workers have several behaviours to opt for, they choose the one which will be expected to bring about more positive consequences. Before action, the worker has a set of attitudes, skills, equipment and facility conditions. These have an influence on the choice of action. However, it is primarily what follows the action as foreseeable consequences that determines the choice of behaviour. Because the consequences have an effect on attitudes, skills and so on, they have the predominant role in inducing a change in behaviour, according to the theorists (figure 1).
Figure 1. Behaviour modification: a safety management technique
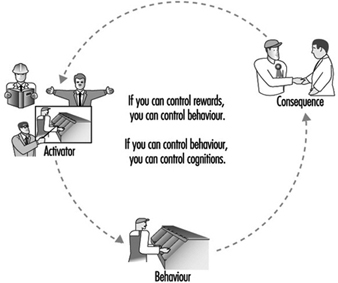
The problem in the safety area is that many unsafe behaviours lead workers to choose more positive consequences (in the sense of apparently rewarding the worker) than safe behaviours. An unsafe work method may be more rewarding if it is quicker, perhaps easier, and induces appreciation from the supervisor. The negative consequence—for instance, an injury—does not follow each unsafe behaviour, as injuries require other adverse conditions to exist before they can take place. Therefore positive consequences are overwhelming in their number and frequency.
As an example, a workshop was conducted in which the participants analysed videos of various jobs at a production plant. These participants, engineers and machine operators from the plant, noticed that a machine was operated with the guard open. “You cannot keep the guard closed”, claimed an operator. “If the automatic operation ceases, I press the limit switch and force the last part to come out of the machine”, he said. “Otherwise I have to take the unfinished part out, carry it several metres and put it back to the conveyor. The part is heavy; it is easier and faster to use the limit switch.”
This little incident illustrates well how the expected consequences affect our decisions. The operator wants to do the job fast and avoid lifting a part that is heavy and difficult to handle. Even if this is more risky, the operator rejects the safer method. The same mechanism applies to all levels in organizations. A plant manager, for example, likes to maximize the profit of the operation and be rewarded for good economic results. If top management does not pay attention to safety, the plant manager can expect more positive consequences from investments which maximize production than those which improve safety.
Positive and Negative Consequences
Governments give rules to economic decision makers through laws, and enforce the laws with penalties. The mechanism is direct: any decision maker can expect negative consequences for breach of law. The difference between the legal approach and the approach advocated here is in the type of consequences. Law enforcement uses negative consequences for unsafe behaviour, while behaviour modification techniques use positive consequences for safe behaviour. Negative consequences have their drawbacks even if they are effective. In the area of safety, the use of negative consequences has been common, extending from government penalties to supervisor’s reprimand. People try to avoid penalties. By doing it, they easily associate safety with penalties, as something less desirable.
Positive consequences reinforcing safe behaviour are more desirable, as they associate positive feelings with safety. If operators can expect more positive consequences from safe work methods, they choose this more as a likely role of behaviour. If plant managers are appraised and rewarded on the basis of safety, they will most likely give a higher value to safety aspects in their decisions.
The array of possible positive consequences is wide. They extend from social attention to various privileges and tokens. Some of the consequences can easily be attached to behaviour; some others demand administrative actions which may be overwhelming. Fortunately, just the chance of being rewarded can change performance.
Changing Unsafe Behaviour to Safe Behaviour
What was especially interesting in the original work of Komaki, Barwick and Scott (1978) and of Sulzer-Azaroff (1978) was the use of performance information as the consequence. Rather than using social consequences or tangible rewards, which may be difficult to administer, they developed a method to measure the safety performance of a group of workers, and used the performance index as the consequence. The index was constructed so that it was just a single figure that varied between 0 and 100. Being simple, it effectively communicated the message about current performance to those concerned. The original application of this technique aimed just at getting employees to change their behaviour. It did not address any other aspects of workplace improvement, such as eliminating problems by engineering, or introducing procedural changes. The programme was implemented by researchers without the active involvement of workers.
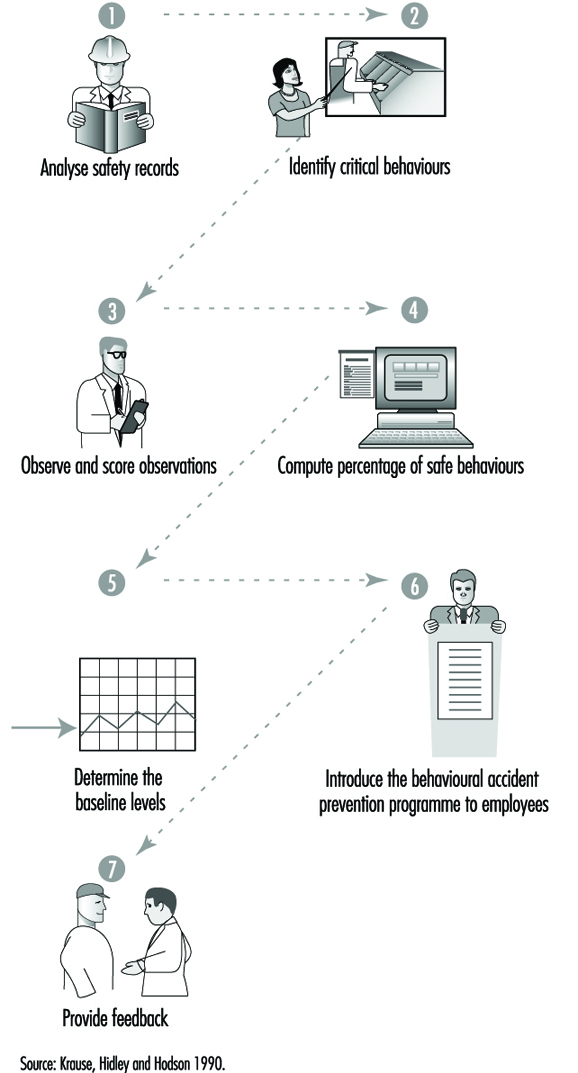
The users of the behaviour modification (BM) technique assume unsafe behaviour to be an essential factor in accident causation, and a factor which can change in isolation without subsequent effects. Therefore, the natural starting point of a BM programme is the investigation of accidents for the identification of unsafe behaviours (Sulzer-Azaroff and Fellner 1984). A typical application of safety-related behaviour modification consists of the steps given in figure 2. The safe acts have to be specified precisely, according to the developers of the technique. The first step is to define which are the correct acts in an area such as a department, a supervisory area and so on. Wearing safety glasses appropriately in certain areas would be an example of a safe act. Usually, a small number of specific safe acts—for example, ten—are defined for a behaviour modification programme.
Figure 2. Behaviour modification for safety consists of the following steps
A few other examples of typical safe behaviours are:
- In working on a ladder, it should be tied off.
- In working on a catwalk, one should not lean over the railing.
- Lockouts should be used during electrical maintenance.
- Protective equipment should be worn.
- A fork-lift should be driven up or down a ramp with the boom in its proper position (Krause, Hidley and Hodgson 1990; McSween 1995).
If a sufficient number of people, typically from 5 to 30, work in a given area, it is possible to generate an observation checklist based on unsafe behaviours. The main principle is to choose checklist items which have only two values, correct or incorrect. If wearing safety glasses is one of the specified safe acts, it would be appropriate to observe every person separately and determine whether or not they are wearing safety glasses. This way the observations provide objective and clear data about the prevalence of safe behaviour. Other specified safe behaviours provide other items for inclusion in the observation checklist. If the list consists, for example, of one hundred items, it is easy to calculate a safety performance index of the percentage of those items which are marked correct, after the observation is completed. The performance index usually varies from time to time.
When the measurement technique is ready, the users determine the baseline. Observation rounds are done at random times weekly (or for several weeks). When a sufficient number of observation rounds are done there is a reasonable picture of the variations of the baseline performance. This is necessary for the positive mechanisms to work. The baseline should be around 50 to 60% to give a positive starting point for improvement and to acknowledge previous performance. The technique has proven its effectiveness in changing safety behaviour. Sulzer-Azaroff, Harris and McCann (1994) list in their review 44 published studies showing a definite effect on behaviour. The technique seems to work almost always, with a few exceptions, as mentioned in Cooper et al. 1994.
Practical Application of Behavioural Theory
Because of several drawbacks in behaviour modification, we developed another technique which aims at rectifying some of the drawbacks. The new programme is called Tuttava, which is an acronym for the Finnish words safely productive. The major differences are shown in the table 1.
Table 1. Differences between Tuttava and other programme/techniques
|
Aspect |
Behaviour modification for safety |
Participatory workplace improvement process, Tuttava |
|
Basis |
Accidents, incidents, risk perceptions |
Work analysis, work flow |
|
Focus |
People and their behaviour |
Conditions |
|
Implementation Experts, consultants |
Joint employee-management team |
|
|
Effect |
Temporary |
Sustainable |
|
Goal |
Behavioural change |
Fundamental and cultural change |
The underlying safety theory in behavioural safety programmes is very simple. It assumes that there is a clear line between safe and unsafe. Wearing safety glasses represents safe behaviour. It does not matter that the optical quality of the glasses may be poor or that the field of vision may be reduced. More generally, the dichotomy between safe and unsafe may be a dangerous simplification.
The receptionist at a plant asked me to remove my ring for a plant tour. She committed a safe act by asking me to remove my ring, and I, by doing so. The wedding ring has, however, a high emotional value to me. Therefore I was worried about losing my ring during the tour. This took part of my perceptual and mental energy away from observing the surrounding area. I was less observant and therefore my risk of being hit by a passing fork-lift truck was higher than usual.
The “no rings” policy originated probably from a past accident. Similar to the wearing of safety glasses, it is far from clear that it itself represents safety. Accident investigations, and people concerned, are the most natural source for the identification of unsafe acts. But this may be very misleading. The investigator may not really understand how an act contributed to the injury under investigation. Therefore, an act labelled “unsafe” may not really be generally speaking unsafe. For this reason, the application developed herein (Saari and Näsänen 1989) defines the behavioural targets from a work analysis point of view. The focus is on tools and materials, because the workers handle those every day and it is easy for them to start talking about familiar objects.
Observing people by direct methods leads easily to blame. Blame leads to organizational tension and antagonism between management and labour, and it is not beneficial for continuous safety improvements. It is therefore better to focus on physical conditions rather than try to coerce behaviour directly. Targeting the application to behaviours related to handling materials and tools, will make any relevant change highly visible. The behaviour itself may last only a second, but it has to leave a visible mark. For example, putting a tool back in its designated place after use takes a very short time. The tool itself remains visible and observable, and there is no need to observe the behaviour itself.
The visible change provides two benefits: (1) it becomes obvious to everybody that improvements happen and (2) people learn to read their performance level directly from their environment. They do not need the results of observation rounds in order to know their current performance. This way, the improvements start acting as positive consequences with respect to correct behaviour, and the artificial performance index becomes unnecessary.
The researchers and external consultants are the main actors in the application described previously. The workers need not think about their work; it is enough if they change their behaviour. However, for obtaining deeper and more lasting results, it would be better if they were involved in the process. Therefore, the application should integrate both workers and management, so that the implementation team consists of representatives from both sides. It also would be nice to have an application which gives lasting results without continuous measurements. Unfortunately, the normal behaviour modification programme does not create highly visible changes, and many critical behaviours last only a second or fractions of a second.
The technique does have some drawbacks in the form described. In theory, relapse to baseline should occur when the observation rounds are terminated. The resources for developing the programme and carrying out observation may be too extensive in comparison with the temporary change gained.
Tools and materials provide a sort of window into the quality of the functions of an organization. For example, if too many components or parts clutter a workstation it may be an indication about problems in the firm’s purchasing process or in the suppliers’ procedures. The physical presence of excessive parts is a concrete way of initiating discussion about organizational functions. The workers who are especially not used to abstract discussions about organizations, can participate and bring their observations into the analysis. Tools and materials often provide an avenue to the underlying, more hidden factors contributing to accident risks. These factors are typically organizational and procedural by nature and, therefore, difficult to address without concrete and substantive informational matter.
Organizational malfunctions may also cause safety problems. For example, in a recent plant visit, workers were observed lifting products manually onto pallets weighing several tons all together. This happened because the purchasing system and the supplier’s system did not function well and, consequently, the product labels were not available at the right time. The products had to be set aside for days on pallets, obstructing an aisle. When the labels arrived, the products were lifted, again manually, to the line. All this was extra work, work which contributes to the risk of back or other injury.
Four Conditions Have to Be Satisfied in a Successful Improvement Programme
To be successful, one must possess correct theoretical and practical understanding about the problem and the mechanisms behind it. This is the foundation for setting the goals for improvement, following which (1) people have to know the new goals, (2) they have to have the technical and organizational means for acting accordingly and (3) they have to be motivated (figure 3). This scheme applies to any change programme.
Figure 3. The four steps of a successful safety programme

A safety campaign may be a good instrument for efficiently spreading information about a goal. However, it has an effect on people’s behaviour only if the other criteria are satisfied. Requiring the wearing of hard hats has no effect on a person who does not have a hard hat, or if a hard hat is terribly uncomfortable, for example, because of a cold climate. A safety campaign may also aim at increasing motivation, but it will fail if it just sends an abstract message, such as “safety first”, unless the recipients have the skills to translate the message into specific behaviours. Plant managers who are told to reduce injuries in the area by 50% are in a similar situation if they do not understand anything about accident mechanisms.
The four criteria set out in figure 3 have to be met. For example, an experiment was conducted in which people were supposed to use stand-alone screens to prevent welding light from reaching other workers’ areas. The experiment failed because it was not realized that no adequate organizational agreements were made. Who should put the screen up, the welder or the other nearby worker exposed to the light? Because both worked on a piece-rate basis and did not want to waste time, an organizational agreement about compensation should have been made before the experiment. A successful safety programme has to address all these four areas simultaneously. Otherwise, progress will be limited.
Tuttava Programme
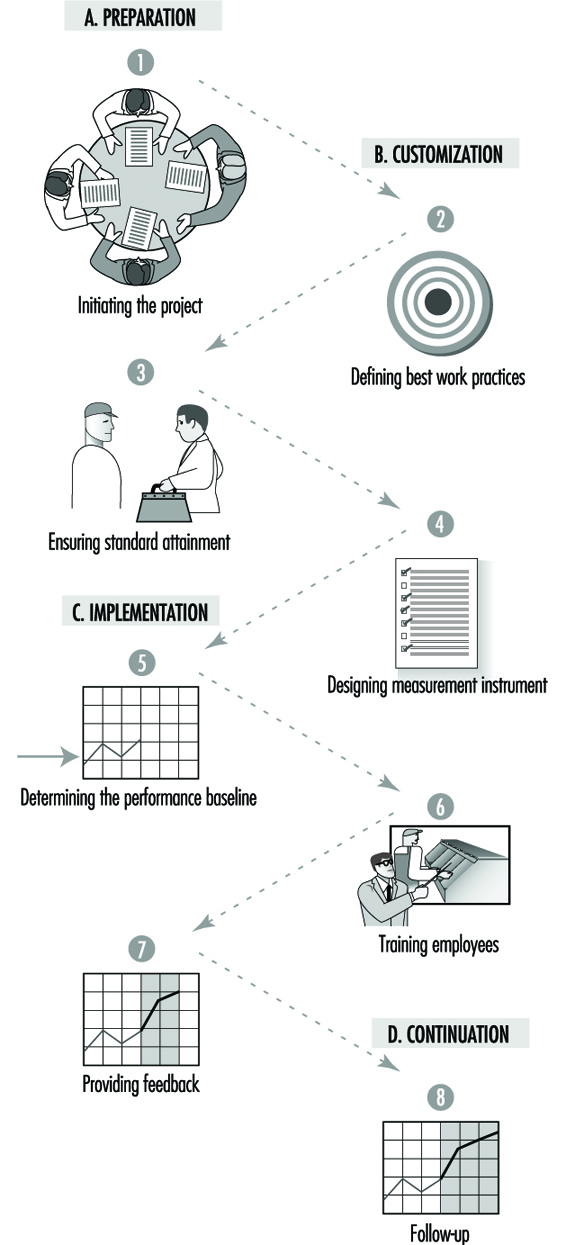
The Tuttava programme (figure 4) lasts from 4 to 6 months and covers the working area of 5 to 30 people at a time. It is done by a team consisting of the representatives of management, supervisors and workers.
Figure 4. The Tuttava programme consists of four stages and eight steps
Performance targets
The first step is to prepare a list of performance targets, or best work practices, consisting of about ten well-specified targets (table 2). The targets should be (1) positive and make work easier, (2) generally acceptable, (3) simple and briefly stated, (4) expressed at the start with action verbs to emphasize the important items to be done and (5) easy to observe and measure.
Table 2. An example of best work practices
- Keep gangways, aisles clear.
- Keep tools stored in proper places when not in use.
- Use proper containers and disposal methods for chemicals.
- Store all manuals at right place after use.
- Make sure of the right calibration on measuring instruments.
- Return trolleys, buggies, pallets at proper location after use.
- Take only right quantity of parts (bolts, nuts, etc.) from bins and return any unused items
- back in proper place.
- Remove from pockets any loose objects that may fall without notice.
The key words for specifying the targets are tools and materials. Usually the targets refer to goals such as the proper placement of materials and tools, keeping the aisles open, correcting leaks and other process disturbances right away, and keeping free access to fire extinguishers, emergency exits, electric substations, safety switches and so on. The performance targets at a printing ink factory are given in table 3.
Table 3. Performance targets at a printing ink factory
- Keep aisles open.
- Always put covers on containers when possible.
- Close bottles after use.
- Clean and return tools after use.
- Ground containers when moving flammable substances.
- Use personal protection as specified.
- Use local exhaust ventilation.
- Store in working areas only materials and substances needed immediately.
- Use only the designated fork-lift truck in the department making flexographic printing inks.
- Label all containers.
These targets are comparable to the safe behaviours defined in the behaviour modification programmes. The difference is that Tuttava behaviours leave visible marks. Closing bottles after use may be a behaviour which takes less than a minute. However, it is possible to see if this was done or not by observing the bottles not in use. There is no need to observe people, a fact which is important for avoiding fingerpointing and blame.
The targets define the behavioural change that the team expects from the employees. In this sense, they compare with the safe behaviours in behaviour modification. However, most of the targets refer to things which are not only workers’ behaviours but which have a much wider meaning. For example, the target may be to store only immediately needed materials in the work area. This requires an analysis of the work process and an understanding of it, and may reveal problems in the technical and organizational arrangements. Sometimes, the materials are not stored conveniently for daily use. Sometimes, the delivery systems work so slowly or are so vulnerable to disturbances that employees stockpile too much material in the work area.
Observation checklist
When the performance targets are sufficiently well defined, the team designs an observation checklist to measure to what extent the targets are met. About 100 measurement points are chosen from the area. For example, the number of measurement points was 126 in the printing ink factory. In each point, the team observes one or several specific items. For example, as regards a waste container, the items could be (1) is the container not too full, (2) is the right kind of waste put into it or (3) is the cover on, if needed? Each item can only be either correct or incorrect. Dichotomized observations make the measurement system objective and reliable. This allows one to calculate a performance index after an observation round covering all measurement points. The index is simply the percentage of items assessed correct. The index can, quite obviously, range from 0 to 100, and it indicates directly to what degree the standards are met. When the first draft of the observation checklist is available, the team conducts a test round. If the result is around 50 to 60%, and if each member of the team gets about the same result, the team can move on to the next phase of Tuttava. If the result of the first observation round is too low—say, 20%—then the team revises the list of performance targets. This is because the programme should be positive in every aspect. Too low a baseline would not adequately assess previous performance; it would rather merely set the blame for poor performance. A good baseline is around 50%.
Technical, organizational and procedural improvements
A very important step in the programme is ensuring the attainment of the performance targets. For example, waste may be lying on floors simply because the number of waste containers is insufficient. There may be excessive materials and parts because the supply system does not work. The system has to become better before it is correct to demand a behavioural change from the workers. By examining each of the targets for attainability, the team usually identifies many opportunities for technical, organizational and procedural improvements. In this way, the worker members bring their practical experience into the development process.
Because the workers spend the entire day at their workplace, they have much more knowledge about the work processes than management. Analysing the attainment of the performance targets, the workers get the opportunity to communicate their ideas to management. As improvements then take place, the employees are much more receptive to the request to meet the performance targets. Usually, this step leads to easily manageable corrective actions. For example, products were removed from the line for adjustments. Some of the products were good, some were bad. The production workers wanted to have designated areas marked for good and bad products so as to know which products to put back on the line and which ones to send for recycling. This step may also call for major technical modifications, such as a new ventilation system in the area where the rejected products are stored. Sometimes, the number of modifications is very high. For example, over 300 technical improvements were made in a plant producing oil-based chemicals which employs only 60 workers. It is important to manage the implementation of improvements well to avoid frustration and the overloading of the respective departments.
Baseline measurements
Baseline observations are started when the attainment of performance targets is sufficiently ensured and when the observation checklist is reliable enough. Sometimes, the targets need revisions, as improvements take a longer time. The team conducts weekly observation rounds for a few weeks to determine the prevailing standard. This phase is important, because it makes it possible to compare the performance at any later time to the initial performance. People forget easily how things were just a couple of months in the past. It is important to have the feeling of progress to reinforce continuous improvements.
Feedback
As the next step, the team trains all people in the area. It is usually done in a one-hour seminar. This is the first time when the results of the baseline measurements are made generally known. The feedback phase starts immediately after the seminar. The observation rounds continue weekly. Now, the result of the round is immediately made known to everybody by posting the index on a chart placed in a visible location. All critical remarks, blame or other negative comments are strictly forbidden. Although the team will identify individuals not behaving as specified in the targets, the team is instructed to keep the information to themselves. Sometimes, all employees are integrated into the process from the very beginning, especially if the number of people working in the area is small. This is better than having representative implementation teams. However, it may not be feasible everywhere.
Effects on performance
Change happens within a couple of weeks after the feedback starts (figure 5). People start to keep the worksite in visibly better order. The performance index jumps typically from 50 to 60% and then even to 80 or 90%. This may not sound big in absolute terms, but it is a big change on the shop floor.
Figure 5. The results from a department at a shipyard
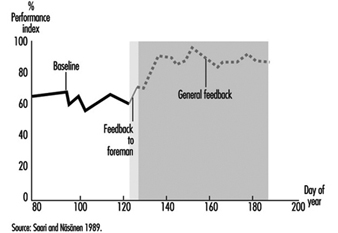
As the performance targets refer on purpose not only to safety issues, the benefits extend from better safety to productivity, saving of materials and floor footage, better physical appearance and so on. To make the improvements attractive to all, there are targets which integrate safety with other goals, such as productivity and quality. This is necessary to make safety more attractive for the management, who in this way will also provide funding more willingly for the less important safety improvements
Sustainable results
When the programme was first developed, 12 experiments were conducted to test the various components. Follow-up observations were made at a shipyard for 2 years. The new level of performance was well kept up during the 2-year follow-up. The sustainable results separate this process from normal behaviour modification. The visible changes in the location of materials, tools and so on, and the technical improvements deter the already secured improvement from fading away. When 3 years had gone by, an evaluation of the effect on accidents at the shipyard was made. The result was dramatic. Accidents had gone down by from 70 to 80%. This was much more than could be expected on the basis of the behavioural change. The number of accidents totally unrelated to performance targets went down as well.
The major effect on accidents is not attributable to the direct changes the process achieves. Rather, this is a starting point for other processes to follow. As Tuttava is very positive and as it brings noticeable improvements, the relations between management and labour get better and the teams get encouragement for other improvements.
Cultural change
A large steel mill was one of the numerous users of Tuttava, the primary purpose of which is to change safety culture. When they started in l987 there were 57 accidents per million hours worked. Prior to this, safety management relied heavily on commands from the top. Unfortunately, the president retired and everybody forgot safety, as the new management could not create a similar demand for safety culture. Among middle management, safety was considered negatively as something extra to be done because of the president’s demand. They organized ten Tuttava teams in l987, and new teams were added every year after that. Now, they have less than 35 accidents per million hours worked, and production has steadily increased during these years. The process caused the safety culture to improve as the middle managers saw in their respective departments improvements which were simultaneously good for safety and production. They became more receptive to other safety programmes and initiatives.
The practical benefits were big. For example, the maintenance service department of the steel mill, employing 300 people, reported a reduction of 400 days in the number of days lost due to occupational injuries—in other words, from 600 days to 200 days. The absenteeism rate fell also by one percentage point. The supervisors said that “it is nicer to come to a workplace which is well organized, both materially and mentally”. The investment was just a fraction of the economic benefit.
Another company employing 1,500 people reported the release of 15,000 m2 of production area, since materials, equipment and so forth, are stored in a better order. The company paid US$1.5 million less in rent. A Canadian company saves about 1 million Canadian dollars per year because of reduced material damages resulting from the implementation of Tuttava.
These are results which are possible only through a cultural change. The most important element in the new culture is shared positive experiences. A manager said, “You can buy people’s time, you can buy their physical presence at a given place, you can even buy a measured number of their skilled muscular motions per hour. But you cannot buy loyalty, you cannot buy the devotion of hearts, minds, or souls. You must earn them.” The positive approach of Tuttava helps managers to earn the loyalty and the devotion of their working teams. Thereby the programme helps involve employees in subsequent improvement projects.