- You are here:
-
Home

-
Part X. Industries Based on Biological Resources
-
Paper and Pulp Industry
- Major Sectors and Processes
Methods of Safety Decision Making
A company is a complex system where decision making takes place in many connections and under various circumstances. Safety is only one of a number of requirements managers must consider when choosing among actions. Decisions relating to safety issues vary considerably in scope and character depending on the attributes of the risk problems to be managed and the decision maker’s position in the organization.
Much research has been undertaken on how people actually make decisions, both individually and in an organizational context: see, for instance, Janis and Mann (1977); Kahnemann, Slovic and Tversky (1982); Montgomery and Svenson (1989). This article will examine selected research experience in this area as a basis for decision-making methods used in management of safety. In principle, decision making concerning safety is not much different from decision making in other areas of management. There is no simple method or set of rules for making good decisions in all situations, since the activities involved in safety management are too complex and varied in scope and character.
The main focus of this article will not be on presenting simple prescriptions or solutions but rather to provide more insight into some of the important challenges and principles for good decision making concerning safety. An overview of the scope, levels and steps in problem solving concerning safety issues will be given, mainly based on the work by Hale et al. (1994). Problem solving is a way of identifying the problem and eliciting viable remedies. This is an important first step in any decision process to be examined. In order to put the challenges of real-life decisions concerning safety into perspective, the principles of rational choice theory will be discussed. The last part of the article covers decision making in an organizational context and introduces the sociological perspective on decision making. Also included are some of the main problems and methods of decision making in the context of safety management, so as to provide more insight into the main dimensions, challenges and pitfalls of making decisions on safety issues as an important activity and challenge in management of safety.
The Context of Safety Decision Making
A general presentation of the methods of safety decision making is complicated because both safety issues and the character of the decision problems vary considerably over the lifetime of an enterprise. From concept and establishment to closure, the life cycle of a company may be divided into six main stages:
- design
- construction
- commissioning
- operation
- maintenance and modification
- decomposition and demolition.
Each of the life-cycle elements involves decisions concerning safety which are not only specific to that phase alone but which also impact on some or all of the other phases. During design, construction and commissioning, the main challenges concern the choice, development and realization of the safety standards and specifications that have been decided upon. During operation, maintenance and demolition, the main objectives of safety management will be to maintain and possibly improve the determined level of safety. The construction phase also represents a “production phase” to some extent, because at the same time that construction safety principles must be adhered to, the safety specifications for what is being built must be realized.
Safety Management Decision Levels
Decisions about safety also differ in character depending on organizational level. Hale et al. (1994) distinguish among three main decision levels of safety management in the organization:
The level of execution is the level at which the actions of those involved (workers) directly influence the occurrence and control of hazards in the workplace. This level is concerned with the recognition of the hazards and the choice and implementation of actions to eliminate, reduce and control them. The degrees of freedom present at this level are limited; therefore, feedback and correction loops are concerned essentially with correcting deviations from established procedures and returning practice to a norm. As soon as a situation is identified where the norm agreed upon is no longer thought to be appropriate, the next higher level is activated.
The level of planning, organization and procedures is concerned with devising and formalizing the actions to be taken at the execution level in respect to the entire range of expected hazards. The planning and organization level, which sets out responsibilities, procedures, reporting lines and so on, is typically found in safety manuals. It is this level which develops new procedures for hazards new to the organization, and modifies existing procedures to keep up either with new insights about hazards or with standards for solutions relating to hazards. This level involves the translation of abstract principles into concrete task allocation and implementation, and corresponds to the improvement loop required in many quality systems.
The level of structure and management is concerned with the overall principles of safety management. This level is activated when the organization considers that the current planning and organizing levels are failing in fundamental ways to achieve accepted performance. It is the level at which the “normal” functioning of the safety management system is critically monitored and through which it is continually improved or maintained in face of changes in the external environment of the organization.
Hale et al. (1994) emphasize that the three levels are abstractions corresponding to three different kinds of feedback. They should not be seen as contiguous with the hierarchical levels of shop floor, first line and higher management, as the activities specified at each abstract level can be applied in many different ways. The way task allocations are made reflects the culture and methods of working of the individual company.
Safety Decision-Making Process
Safety problems must be managed through some kind of problem-solving or decision-making process. According to Hale et al. (1994) this process, which is designated the problem-solving cycle, is common to the three levels of safety management described above. The problem-solving cycle is a model of an idealized stepwise procedure for analysing and making decisions on safety problems caused by potential or actual deviations from desired, expected or planned achievements (figure 1).
Figure 1. The problem-solving cycle
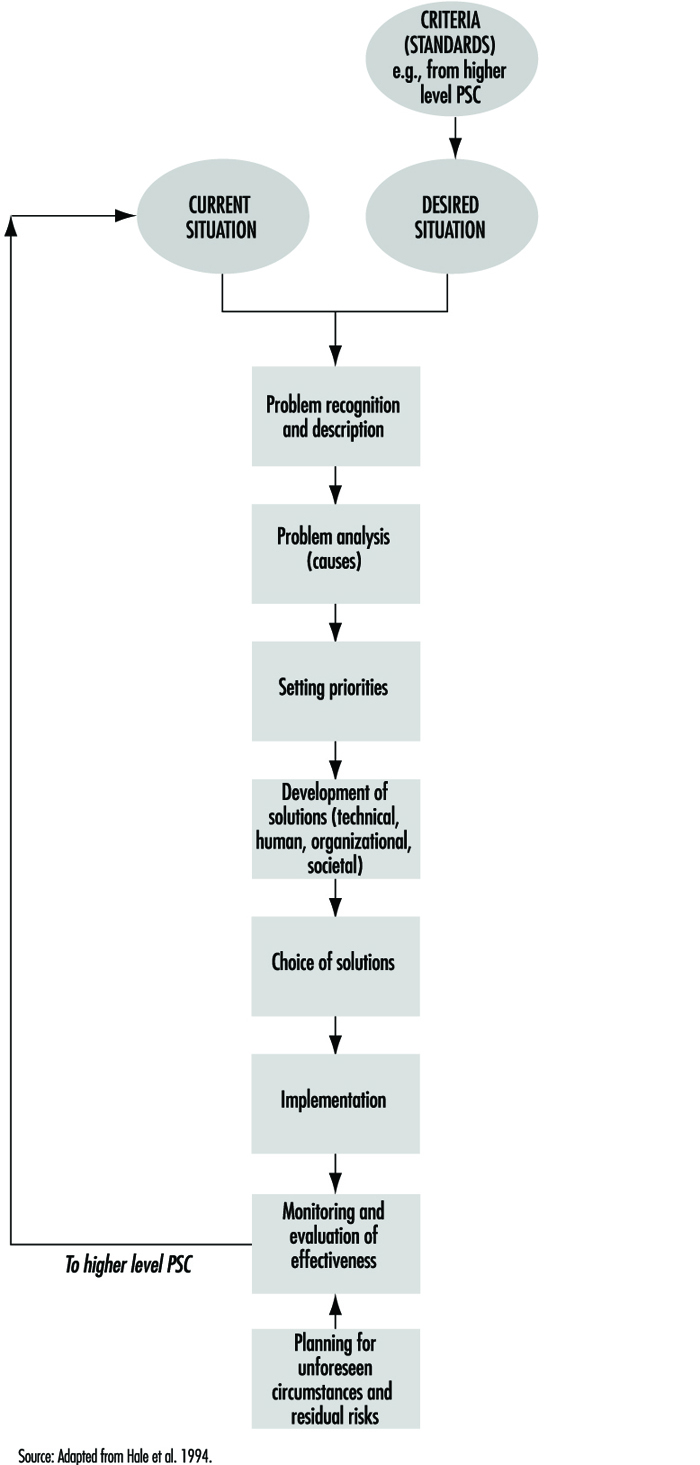
Although the steps are the same in principle at all three safety management levels, the application in practice may differ somewhat depending on the nature of problems treated. The model shows that decisions which concern safety management span many types of problems. In practice, each of the following six basic decision problems in safety management will have to be broken down into several subdecisions which will form the basis for choices on each of the main problem areas.
- What is an acceptable safety level or standard of the activity/department/company, etc.?
- What criteria shall be used to assess the safety level?
- What is the current safety level?
- What are the causes of identified deviations between acceptable and observed level of safety?
- What means should be chosen to correct the deviations and keep up the safety level?
- How should corrective actions be implemented and followed up?
Rational Choice Theory
Managers’ methods for making decisions must be based on some principle of rationality in order to gain acceptance among members of the organization. In practical situations what is rational may not always be easy to define, and the logical requirements of what may be defined as rational decisions may be difficult to fulfil. Rational choice theory (RCT), the conception of rational decision making, was originally developed to explain economic behaviour in the marketplace, and later generalized to explain not only economic behaviour but also the behaviour studied by nearly all social science disciplines, from political philosophy to psychology.
The psychological study of optimal human decision making is called subjective expected utility theory (SEU). RCT and SEU are basically the same; only the applications differ. SEU focuses on the thinking of individual decision making, while RCT has a wider application in explaining behaviour within whole organizations or institutions—see, for example, Neumann and Politser (1992). Most of the tools of modern operations research use the assumptions of SEU. They assume that what is desired is to maximize the achievement of some goal, under specific constraints, and assuming that all alternatives and consequences (or their probability distribution) are known (Simon and associates 1992). The essence of RCT and SEU can be summarized as follows (March and Simon 1993):
Decision makers, when encountering a decision-making situation, acquire and see the whole set of alternatives from which they will choose their action. This set is simply given; the theory does not tell how it is obtained.
To each alternative is attached a set of consequences—the events that will ensue if that particular alternative is chosen. Here the existing theories fall into three categories:
- Certainty theories assume the decision maker has complete and accurate knowledge of the consequences that will follow on each alternative. In the case of certainty, the choice is unambiguous.
- Risk theories assume accurate knowledge of a probability distribution of the consequences of each alternative. In the case of risk, rationality is usually defined as the choice of that alternative for which expected utility is greatest.
- Uncertainty theories assume that the consequences of each alternative belong to some subset of all possible consequences, but that the decision maker cannot assign definite probabilities to the occurrence of particular consequences. In the case of uncertainty, the definition of rationality becomes problematic.
At the outset, the decision maker makes use of a “utility function” or a “preference ordering” that ranks all sets of consequences from the most preferred to the least preferred. It should be noted that another proposal is the rule of “minimax risk”, by which one considers the “worst set of consequences” that may follow from each alternative, then selects the alternative whose worst set of consequences is preferred to the worst sets attached to other alternatives.
The decision maker elects the alternative closest to the preferred set of consequences.
One difficulty of RCT is that the term rationality is in itself problematic. What is rational depends upon the social context in which the decision takes place. As pointed out by Flanagan (1991), it is important to distinguish between the two terms rationality and logicality. Rationality is tied up with issues related to the meaning and quality of life for some individual or individuals, while logicality is not. The problem of the benefactor is precisely the issue which rational choice models fail to clarify, in that they assume value neutrality, which is seldom present in real-life decision making (Zey 1992). Although the value of RCT and SEU as explanatory theory is somewhat limited, it has been useful as a theoretical model for “rational” decision making. Evidence that behaviour often deviates from outcomes predicted by expected utility theory does not necessarily mean that the theory inappropriately prescribes how people should make decisions. As a normative model the theory has proven useful in generating research concerning how and why people make decisions which violate the optimal utility axiom.
Applying the ideas of RCT and SEU to safety decision making may provide a basis for evaluating the “rationality” of choices made with respect to safety—for instance, in the selection of preventive measures given a safety problem one wants to alleviate. Quite often it will not be possible to comply with the principles of rational choice because of lack of reliable data. Either one may not have a complete picture of available or possible actions, or else the uncertainty of the effects of different actions, for instance, implementation of different preventive measures, may be large. Thus, RCT may be helpful in pointing out some weaknesses in a decision process, but it provides little guidance in improving the quality of choices to be made. Another limitation in the applicability of rational choice models is that most decisions in organizations do not necessarily search for optimal solutions.
Problem Solving
Rational choice models describe the process of evaluating and choosing between alternatives. However, deciding on a course of action also requires what Simon and associates (1992) describe as problem solving. This is the work of choosing issues that require attention, setting goals, and finding or deciding on suitable courses of action. (While managers may know they have problems, they may not understand the situation well enough to direct their attention to any plausible course of action.) As mentioned earlier, the theory of rational choice has its roots mainly in economics, statistics and operations research, and only recently has it received attention from psychologists. The theory and methods of problem solving has a very different history. Problem solving was initially studied principally by psychologists, and more recently by researchers in artificial intelligence.
Empirical research has shown that the process of problem solving takes place more or less in the same way for a wide range of activities. First, problem solving generally proceeds by selective search through large sets of possibilities, using rules of thumb (heuristics) to guide the search. Because the possibilities in realistic problem situations are virtually endless, a trial-and-error search would simply not work. The search must be highly selective. One of the procedures often used to guide the search is described as hill climbing—using some measure of approach to the goal to determine where it is most profitable to look next. Another and more powerful common procedure is means-ends analysis. When using this method, the problem solver compares the present situation with the goal, detects differences between them, and then searches memory for actions that are likely to reduce the difference. Another thing that has been learned about problem solving, especially when the solver is an expert, is that the solver’s thought process relies on large amounts of information that is stored in memory and that is retrievable whenever the solver recognizes cues signalling its relevance.
One of the accomplishments of contemporary problem-solving theory has been to provide an explanation for the phenomena of intuition and judgement frequently seen in experts’ behaviour. The store of expert knowledge seems to be in some way indexed by the recognition cues that make it accessible. Combined with some basic inferential capabilities (perhaps in the form of means-ends analysis), this indexing function is applied by the expert to find satisfactory solutions to difficult problems.
Most of the challenges which managers of safety face will be of a kind that require some kind of problem solving—for example, detecting what the underlying causes of an accident or a safety problem really are, in order to figure out some preventive measure. The problem-solving cycle developed by Hale et al. (1994)—see figure 1—gives a good description of what is involved in the stages of safety problem solving. What seems evident is that at present it is not possible and may not even be desirable to develop a strictly logical or mathematical model for what is an ideal problem-solving process in the same manner as has been followed for rational choice theories. This view is supported by the knowledge of other difficulties in the real-life instances of problem solving and decision making which are discussed below.
Ill-Structured Problems, Agenda Setting and Framing
In real life, situations frequently occur when the problem-solving process becomes obscure because the goals themselves are complex and sometimes ill-defined. What often happens is that the very nature of the problem is successively transformed in the course of exploration. To the extent that the problem has these characteristics, it may be called ill-structured. Typical examples of problem-solving processes with such characteristics are (1) the development of new designs and (2) scientific discovery.
The solving of ill-defined problems has only recently become a subject of scientific study. When problems are ill-defined, the problem-solving process requires substantial knowledge about solution criteria as well as knowledge about the means for satisfying those criteria. Both kinds of knowledge must be evoked in the course of the process, and the evocation of the criteria and constraint continually modifies and remoulds the solution which the problem-solving process is addressing. Some research concerning problem structuring and analysis within risk and safety issues has been published, and may be profitably studied; see, for example, Rosenhead 1989 and Chicken and Haynes 1989.
Setting the agenda, which is the very first step of the problem-solving process, is also the least understood. What brings a problem to the head of the agenda is the identification of a problem and the consequent challenge to determine how it can be represented in a way that facilitates its solution; these are subjects that only recently have been focused upon in studies of decision processes. The task of setting an agenda is of utmost importance because both individual human beings and human institutions have limited capacities in dealing with many tasks simultaneously. While some problems are receiving full attention, others are neglected. When new problems emerge suddenly and unexpectedly (e.g., firefighting), they may replace orderly planning and deliberation.
The way in which problems are represented has much to do with the quality of the solutions that are found. At present the representation or framing of problems is even less well understood than agenda setting. A characteristic of many advances in science and technology is that a change in framing will bring about a whole new approach to solving a problem. One example of such change in the framing of problem definition in safety science in recent years, is the shift of focus away from the details of the work operations to the organizational decisions and conditions which create the whole work situation—see, for example, Wagenaar et al. (1994).
Decision Making in Organizations
Models of organizational decision making view the question of choice as a logical process in which decision makers try to maximize their objectives in an orderly series of steps (figure 2). This process is in principle the same for safety as for decisions on other issues that the organization has to manage.
Figure 2. The decision-making process in organizations

These models may serve as a general framework for “rational decision making” in organizations; however, such ideal models have several limitations and they leave out important aspects of processes which actually may take place. Some of the significant characteristics of organizational decision-making processes are discussed below.
Criteria applied in organizational choice
While rational choice models are preoccupied with finding the optimal alternative, other criteria may be even more relevant in organizational decisions. As observed by March and Simon (1993), organizations for various reasons search for satisfactory rather than optimal solutions.
- Optimal alternatives. An alternative can be defined as optimal if (1) there exists a set of criteria that permits all alternatives to be compared and (2) the alternative in question is preferred, by these criteria, to all other alternatives (see also the discussion of rational choice, above).
- Satisfactory alternatives. An alternative is satisfactory if (1) there exists a set of criteria that describes minimally satisfactory alternatives and (2) the alternative in question meets or exceeds these criteria.
According to March and Simon (1993) most human decision making, whether individual or organizational, is concerned with the discovery and selection of satisfactory alternatives. Only in exceptional cases is it concerned with discovery and selection of optimal alternatives. In safety management, satisfactory alternatives with respect to safety will usually suffice, so that a given solution to a safety problem must meet specified standards. The typical constraints which often apply to optimal choice safety decisions are economic considerations such as: “Good enough, but as cheap as possible”.
Programmed decision making
Exploring the parallels between human decision making and organizational decision making, March and Simon (1993) argued that organizations can never be perfectly rational, because their members have limited information-processing capabilities. It is claimed that decision makers at best can achieve only limited forms of rationality because they (1) usually have to act on the basis of incomplete information, (2) are able to explore only a limited number of alternatives relating to any given decision, and (3) are unable to attach accurate values to outcomes. March and Simon maintain that the limits on human rationality are institutionalized in the structure and modes of functioning of our organizations. In order to make the decision-making process manageable, organizations fragment, routinize and limit the decision process in several ways. Departments and work units have the effect of segmenting the organization’s environment, of compartmentalizing responsibilities, and thus of simplifying the domains of interest and decision making of managers, supervisors and workers. Organizational hierarchies perform a similar function, providing channels of problem solving in order to make life more manageable. This creates a structure of attention, interpretation and operation that exerts a crucial influence on what is appreciated as “rational” choices of the individual decision maker in the organizational context. March and Simon named these organized sets of responses performance programmes, or simply programmes. The term programme is not intended to connote complete rigidity. The content of the programme may be adaptive to a large number of characteristics that initiate it. The programme may also be conditional on data that are independent of the initiating stimuli. It is then more properly called a performance strategy.
A set of activities is regarded as routinized to the degree that choice has been simplified by the development of fixed response to defined stimuli. If searches have been eliminated, but choice remains in the form of clearly defined systematic computing routines, the activity is designated as routinized. Activities are regarded as unroutinized to the extent that they have to be preceded by programme-developing activities of a problem-solving kind. The distinction made by Hale et al. (1994) (discussed above) between the levels of execution, planning and system structure/management carry similar implications concerning the structuring of the decision-making process.
Programming influences decision making in two ways: (1) by defining how a decision process should be run, who should participate, and so on, and (2) by prescribing choices to be made based on the information and alternatives at hand. The effects of programming are on the one hand positive in the sense that they may increase the efficiency of the decision process and assure that problems are not left unresolved, but are treated in a way that is well structured. On the other hand, rigid programming may hamper the flexibility that is needed especially in the problem-solving phase of a decision process in order to generate new solutions. For example, many airlines have established fixed procedures for treatment of reported deviations, so-called flight reports or maintenance reports, which require that each case be examined by an appointed person and that a decision be made concerning preventive actions to be taken based on the incident. Sometimes the decision may be that no action shall be taken, but the procedures assure that such a decision is deliberate, and not a result of negligence, and that there is a responsible decision maker involved in the decisions.
The degree to which activities are programmed influences risk taking. Wagenaar (1990) maintained that most accidents are consequences of routine behaviour without any consideration of risk. The real problem of risk occurs at higher levels in organizations, where the unprogrammed decisions are made. But risks are most often not taken consciously. They tend to be results of decisions made on issues which are not directly related to safety, but where preconditions for safe operation were inadvertently affected. Managers and other high-level decision makers are thus more often permitting opportunities for risks than taking risks.
Decision Making, Power and Conflict of Interests
The ability to influence the outcomes of decision-making processes is a well-recognized source of power, and one that has attracted considerable attention in organization-theory literature. Since organizations are in large measure decision-making systems, an individual or group can exert major influence on the decision processes of the organization. According to Morgan (1986) the kinds of power used in decision making can be classified into the following three interrelated elements:
- The decision premises. Influence on the decision premises may be exerted in several ways. One of the most effective ways of “making” a decision is to allow it to be made by default. Hence much of the political activity within an organization depends on the control of agendas and other decision premises that influence how particular decisions will be approached, perhaps in ways that prevent certain core issues from surfacing at all. In addition, decision premises are manipulated by the unobtrusive control embedded in choice of those vocabularies, structures of communications, attitudes, beliefs, rules and procedures which are accepted without questioning. These factors shape decisions by the way we think and act. According to Morgan (1986), visions of what the problems and issues are and how they can be tackled, often act as mental straitjackets that prevent us from seeing other ways of formulating our basic concerns and the alternative courses of action that are available.
- The decision processes. Control of decision processes is usually more visible than the control of decision premises. How to treat an issue involves questions such as who should be involved, when the decision should be made, how the issue should be handled at meetings, and how it should be reported. The ground rules that are to guide decision making are important variables that organization members can manipulate in order to influence the outcome.
- The decision issues and objectives. A final way of controlling decision making is to influence the issues and objectives to be addressed and the evaluative criteria to be employed. An individual can shape the issues and objectives most directly through preparing reports and contributing to the discussion on which the decision will be based. By emphasizing the importance of particular constraints, selecting and evaluating the alternatives on which a decision will be made, and highlighting the importance of certain values or outcomes, decision makers can exert considerable influence on the decision that emerges from discussion.
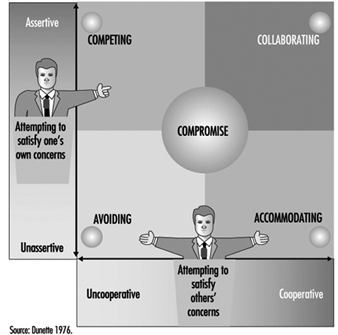
Some decision problems may carry a conflict of interest—for example, between management and employees. Disagreement may occur on the definition of what is really the problem—what Rittel and Webber (1973) characterized as “wicked” problems, to be distinguished from problems that are “tame” with respect to securing consent. In other cases, parties may agree on problem definition but not on how the problem should be solved, or what are acceptable solutions or criteria for solutions. The attitudes or strategies of conflicting parties will define not only their problem-solving behaviour, but also the prospects of reaching an acceptable solution through negotiations. Important variables are how parties attempt to satisfy their own versus the other party’s concerns (figure 3). Successful collaboration requires that both parties are assertive concerning their own needs, but are simultaneously willing to take the needs of the other party equally into consideration.
Figure 3. Five styles of negotiating behaviour
Another interesting typology based on the amount of agreement between goals and means, was developed by Thompson and Tuden (1959) (cited in Koopman and Pool 1991). The authors suggested what was a “best-fitting strategy” based on knowledge about the parties’ perceptions of the causation of the problem and about preferences of outcomes (figure 4).
Figure 4. A typology of problem-solving strategy
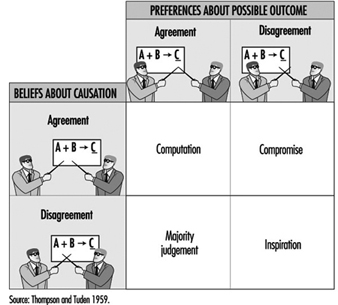
If there is agreement on goals and means, the decision can be calculated—for example, developed by some experts. If the means to the desired ends are unclear, these experts will have to reach a solution through consultation (majority judgement). If there is any conflict about the goals, consultation between the parties involved is necessary. However, if agreement is lacking both on goals and means, the organization is really endangered. Such a situation requires charismatic leadership which can “inspire” a solution acceptable to the conflicting parties.
Decision making within an organizational framework thus opens up perspectives far beyond those of rational choice or individual problem-solving models. Decision processes must be seen within the framework of organizational and management processes, where the concept of rationality may take on new and different meanings from those defined by the logicality of rational choice approaches embedded in, for example, operations research models. Decision making carried out within safety management must be regarded in light of such a perspective as will allow a full understanding of all aspects of the decision problems at hand.
Summary and Conclusions
Decision making can generally be described as a process starting with an initial situation (initial state) which decision makers perceive to be deviating from a desired goal situation (goal state), although they do not know in advance how to alter the initial state into the goal state (Huber 1989). The problem solver transforms the initial state into the goal state by applying one or more operators, or activities to alter states. Often a sequence of operators is required to bring about the desired change.
The research literature on the subject provides no simple answers to how to make decisions on safety issues; therefore, the methods of decision making must be rational and logical. Rational choice theory represents an elegant conception of how optimal decisions are made. However, within safety management, rational choice theory cannot be easily applied. The most obvious limitation is the lack of valid and reliable data on potential choices with respect to both completeness and to knowledge of consequences. Another difficulty is that the concept rational assumes a benefactor, which may differ depending on which perspective is chosen in a decision situation. However, the rational choice approach may still be helpful in pointing out some of the difficulties and shortcomings of the decisions to be made.
Often the challenge is not to make a wise choice between alternative actions, but rather to analyse a situation in order to find out what the problem really is. In analysing safety management problems, structuring is often the most important task. Understanding the problem is a prerequisite for finding an acceptable solution. The most important issue concerning problem solving is not to identify a single superior method, which probably does not exist on account of the wide range of problems within the areas of risk assessment and safety management. The main point is rather to take a structured approach and document the analysis and decisions made in such a way that the procedures and evaluations are traceable.
Organizations will manage some of their decision making through programmed actions. Programming or fixed procedures for decision-making routines may be very useful in safety management. An example is how some companies treat reported deviations and near accidents. Programming can be an efficient way to control decision-making processes in the organization, provided that the safety issues and decision rules are clear.
In real life, decisions take place within an organizational and social context where conflicts of interest sometimes emerge. The decision processes may be hindered by different perceptions of what the problems are, of criteria, or of the acceptability of proposed solutions. Being aware of the presence and possible effects of vested interests is helpful in making decisions which are acceptable to all parties involved. Safety management includes a large variety of problems depending on which life cycle, organizational level and stage of problem solving or hazard alleviation a problem concerns. In that sense, decision making concerning safety is as wide in scope and character as decision making on any other management issues.
Participatory Workplace Improvement Process
Behaviour Modification: A Safety Management Technique
Safety management has two main tasks. It is incumbent on the safety organization (1) to maintain the company’s safety performance on the current level and (2) to implement measures and programmes which improve the safety performance. The tasks are different and require different approaches. This article describes a method for the second task which has been used in numerous companies with excellent results. The background of this method is behaviour modification, which is a technique for improving safety which has many applications in business and industry. Two independently conducted experiments of the first scientific applications of behaviour modification were published by Americans in 1978. The applications were in quite different locations. Komaki, Barwick and Scott (1978) did their study in a bakery. Sulzer-Azaroff (1978) did her study in laboratories at a university.
Consequences of Behaviour
Behaviour modification puts the focus on the consequences of a behaviour. When workers have several behaviours to opt for, they choose the one which will be expected to bring about more positive consequences. Before action, the worker has a set of attitudes, skills, equipment and facility conditions. These have an influence on the choice of action. However, it is primarily what follows the action as foreseeable consequences that determines the choice of behaviour. Because the consequences have an effect on attitudes, skills and so on, they have the predominant role in inducing a change in behaviour, according to the theorists (figure 1).
Figure 1. Behaviour modification: a safety management technique
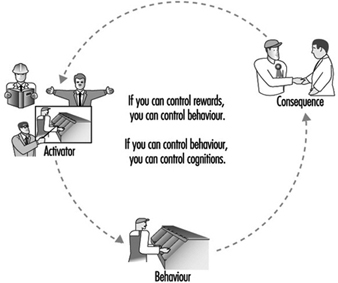
The problem in the safety area is that many unsafe behaviours lead workers to choose more positive consequences (in the sense of apparently rewarding the worker) than safe behaviours. An unsafe work method may be more rewarding if it is quicker, perhaps easier, and induces appreciation from the supervisor. The negative consequence—for instance, an injury—does not follow each unsafe behaviour, as injuries require other adverse conditions to exist before they can take place. Therefore positive consequences are overwhelming in their number and frequency.
As an example, a workshop was conducted in which the participants analysed videos of various jobs at a production plant. These participants, engineers and machine operators from the plant, noticed that a machine was operated with the guard open. “You cannot keep the guard closed”, claimed an operator. “If the automatic operation ceases, I press the limit switch and force the last part to come out of the machine”, he said. “Otherwise I have to take the unfinished part out, carry it several metres and put it back to the conveyor. The part is heavy; it is easier and faster to use the limit switch.”
This little incident illustrates well how the expected consequences affect our decisions. The operator wants to do the job fast and avoid lifting a part that is heavy and difficult to handle. Even if this is more risky, the operator rejects the safer method. The same mechanism applies to all levels in organizations. A plant manager, for example, likes to maximize the profit of the operation and be rewarded for good economic results. If top management does not pay attention to safety, the plant manager can expect more positive consequences from investments which maximize production than those which improve safety.
Positive and Negative Consequences
Governments give rules to economic decision makers through laws, and enforce the laws with penalties. The mechanism is direct: any decision maker can expect negative consequences for breach of law. The difference between the legal approach and the approach advocated here is in the type of consequences. Law enforcement uses negative consequences for unsafe behaviour, while behaviour modification techniques use positive consequences for safe behaviour. Negative consequences have their drawbacks even if they are effective. In the area of safety, the use of negative consequences has been common, extending from government penalties to supervisor’s reprimand. People try to avoid penalties. By doing it, they easily associate safety with penalties, as something less desirable.
Positive consequences reinforcing safe behaviour are more desirable, as they associate positive feelings with safety. If operators can expect more positive consequences from safe work methods, they choose this more as a likely role of behaviour. If plant managers are appraised and rewarded on the basis of safety, they will most likely give a higher value to safety aspects in their decisions.
The array of possible positive consequences is wide. They extend from social attention to various privileges and tokens. Some of the consequences can easily be attached to behaviour; some others demand administrative actions which may be overwhelming. Fortunately, just the chance of being rewarded can change performance.
Changing Unsafe Behaviour to Safe Behaviour
What was especially interesting in the original work of Komaki, Barwick and Scott (1978) and of Sulzer-Azaroff (1978) was the use of performance information as the consequence. Rather than using social consequences or tangible rewards, which may be difficult to administer, they developed a method to measure the safety performance of a group of workers, and used the performance index as the consequence. The index was constructed so that it was just a single figure that varied between 0 and 100. Being simple, it effectively communicated the message about current performance to those concerned. The original application of this technique aimed just at getting employees to change their behaviour. It did not address any other aspects of workplace improvement, such as eliminating problems by engineering, or introducing procedural changes. The programme was implemented by researchers without the active involvement of workers.
The users of the behaviour modification (BM) technique assume unsafe behaviour to be an essential factor in accident causation, and a factor which can change in isolation without subsequent effects. Therefore, the natural starting point of a BM programme is the investigation of accidents for the identification of unsafe behaviours (Sulzer-Azaroff and Fellner 1984). A typical application of safety-related behaviour modification consists of the steps given in figure 2. The safe acts have to be specified precisely, according to the developers of the technique. The first step is to define which are the correct acts in an area such as a department, a supervisory area and so on. Wearing safety glasses appropriately in certain areas would be an example of a safe act. Usually, a small number of specific safe acts—for example, ten—are defined for a behaviour modification programme.
Figure 2. Behaviour modification for safety consists of the following steps
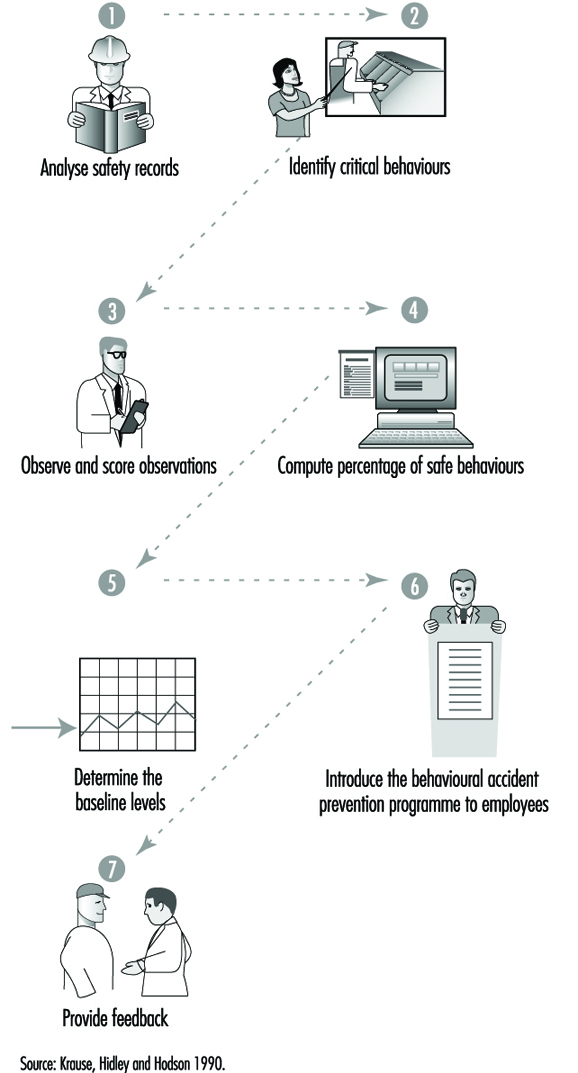
A few other examples of typical safe behaviours are:
- In working on a ladder, it should be tied off.
- In working on a catwalk, one should not lean over the railing.
- Lockouts should be used during electrical maintenance.
- Protective equipment should be worn.
- A fork-lift should be driven up or down a ramp with the boom in its proper position (Krause, Hidley and Hodgson 1990; McSween 1995).
If a sufficient number of people, typically from 5 to 30, work in a given area, it is possible to generate an observation checklist based on unsafe behaviours. The main principle is to choose checklist items which have only two values, correct or incorrect. If wearing safety glasses is one of the specified safe acts, it would be appropriate to observe every person separately and determine whether or not they are wearing safety glasses. This way the observations provide objective and clear data about the prevalence of safe behaviour. Other specified safe behaviours provide other items for inclusion in the observation checklist. If the list consists, for example, of one hundred items, it is easy to calculate a safety performance index of the percentage of those items which are marked correct, after the observation is completed. The performance index usually varies from time to time.
When the measurement technique is ready, the users determine the baseline. Observation rounds are done at random times weekly (or for several weeks). When a sufficient number of observation rounds are done there is a reasonable picture of the variations of the baseline performance. This is necessary for the positive mechanisms to work. The baseline should be around 50 to 60% to give a positive starting point for improvement and to acknowledge previous performance. The technique has proven its effectiveness in changing safety behaviour. Sulzer-Azaroff, Harris and McCann (1994) list in their review 44 published studies showing a definite effect on behaviour. The technique seems to work almost always, with a few exceptions, as mentioned in Cooper et al. 1994.
Practical Application of Behavioural Theory
Because of several drawbacks in behaviour modification, we developed another technique which aims at rectifying some of the drawbacks. The new programme is called Tuttava, which is an acronym for the Finnish words safely productive. The major differences are shown in the table 1.
Table 1. Differences between Tuttava and other programme/techniques
|
Aspect |
Behaviour modification for safety |
Participatory workplace improvement process, Tuttava |
|
Basis |
Accidents, incidents, risk perceptions |
Work analysis, work flow |
|
Focus |
People and their behaviour |
Conditions |
|
Implementation Experts, consultants |
Joint employee-management team |
|
|
Effect |
Temporary |
Sustainable |
|
Goal |
Behavioural change |
Fundamental and cultural change |
The underlying safety theory in behavioural safety programmes is very simple. It assumes that there is a clear line between safe and unsafe. Wearing safety glasses represents safe behaviour. It does not matter that the optical quality of the glasses may be poor or that the field of vision may be reduced. More generally, the dichotomy between safe and unsafe may be a dangerous simplification.
The receptionist at a plant asked me to remove my ring for a plant tour. She committed a safe act by asking me to remove my ring, and I, by doing so. The wedding ring has, however, a high emotional value to me. Therefore I was worried about losing my ring during the tour. This took part of my perceptual and mental energy away from observing the surrounding area. I was less observant and therefore my risk of being hit by a passing fork-lift truck was higher than usual.
The “no rings” policy originated probably from a past accident. Similar to the wearing of safety glasses, it is far from clear that it itself represents safety. Accident investigations, and people concerned, are the most natural source for the identification of unsafe acts. But this may be very misleading. The investigator may not really understand how an act contributed to the injury under investigation. Therefore, an act labelled “unsafe” may not really be generally speaking unsafe. For this reason, the application developed herein (Saari and Näsänen 1989) defines the behavioural targets from a work analysis point of view. The focus is on tools and materials, because the workers handle those every day and it is easy for them to start talking about familiar objects.
Observing people by direct methods leads easily to blame. Blame leads to organizational tension and antagonism between management and labour, and it is not beneficial for continuous safety improvements. It is therefore better to focus on physical conditions rather than try to coerce behaviour directly. Targeting the application to behaviours related to handling materials and tools, will make any relevant change highly visible. The behaviour itself may last only a second, but it has to leave a visible mark. For example, putting a tool back in its designated place after use takes a very short time. The tool itself remains visible and observable, and there is no need to observe the behaviour itself.
The visible change provides two benefits: (1) it becomes obvious to everybody that improvements happen and (2) people learn to read their performance level directly from their environment. They do not need the results of observation rounds in order to know their current performance. This way, the improvements start acting as positive consequences with respect to correct behaviour, and the artificial performance index becomes unnecessary.
The researchers and external consultants are the main actors in the application described previously. The workers need not think about their work; it is enough if they change their behaviour. However, for obtaining deeper and more lasting results, it would be better if they were involved in the process. Therefore, the application should integrate both workers and management, so that the implementation team consists of representatives from both sides. It also would be nice to have an application which gives lasting results without continuous measurements. Unfortunately, the normal behaviour modification programme does not create highly visible changes, and many critical behaviours last only a second or fractions of a second.
The technique does have some drawbacks in the form described. In theory, relapse to baseline should occur when the observation rounds are terminated. The resources for developing the programme and carrying out observation may be too extensive in comparison with the temporary change gained.
Tools and materials provide a sort of window into the quality of the functions of an organization. For example, if too many components or parts clutter a workstation it may be an indication about problems in the firm’s purchasing process or in the suppliers’ procedures. The physical presence of excessive parts is a concrete way of initiating discussion about organizational functions. The workers who are especially not used to abstract discussions about organizations, can participate and bring their observations into the analysis. Tools and materials often provide an avenue to the underlying, more hidden factors contributing to accident risks. These factors are typically organizational and procedural by nature and, therefore, difficult to address without concrete and substantive informational matter.
Organizational malfunctions may also cause safety problems. For example, in a recent plant visit, workers were observed lifting products manually onto pallets weighing several tons all together. This happened because the purchasing system and the supplier’s system did not function well and, consequently, the product labels were not available at the right time. The products had to be set aside for days on pallets, obstructing an aisle. When the labels arrived, the products were lifted, again manually, to the line. All this was extra work, work which contributes to the risk of back or other injury.
Four Conditions Have to Be Satisfied in a Successful Improvement Programme
To be successful, one must possess correct theoretical and practical understanding about the problem and the mechanisms behind it. This is the foundation for setting the goals for improvement, following which (1) people have to know the new goals, (2) they have to have the technical and organizational means for acting accordingly and (3) they have to be motivated (figure 3). This scheme applies to any change programme.
Figure 3. The four steps of a successful safety programme

A safety campaign may be a good instrument for efficiently spreading information about a goal. However, it has an effect on people’s behaviour only if the other criteria are satisfied. Requiring the wearing of hard hats has no effect on a person who does not have a hard hat, or if a hard hat is terribly uncomfortable, for example, because of a cold climate. A safety campaign may also aim at increasing motivation, but it will fail if it just sends an abstract message, such as “safety first”, unless the recipients have the skills to translate the message into specific behaviours. Plant managers who are told to reduce injuries in the area by 50% are in a similar situation if they do not understand anything about accident mechanisms.
The four criteria set out in figure 3 have to be met. For example, an experiment was conducted in which people were supposed to use stand-alone screens to prevent welding light from reaching other workers’ areas. The experiment failed because it was not realized that no adequate organizational agreements were made. Who should put the screen up, the welder or the other nearby worker exposed to the light? Because both worked on a piece-rate basis and did not want to waste time, an organizational agreement about compensation should have been made before the experiment. A successful safety programme has to address all these four areas simultaneously. Otherwise, progress will be limited.
Tuttava Programme
The Tuttava programme (figure 4) lasts from 4 to 6 months and covers the working area of 5 to 30 people at a time. It is done by a team consisting of the representatives of management, supervisors and workers.
Figure 4. The Tuttava programme consists of four stages and eight steps
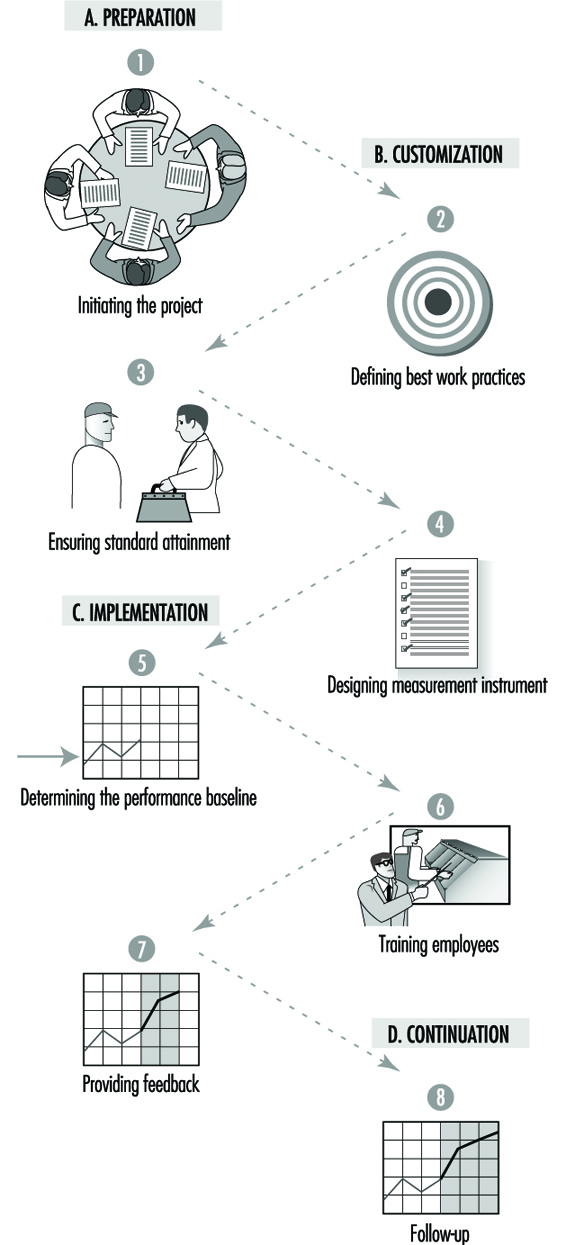
Performance targets
The first step is to prepare a list of performance targets, or best work practices, consisting of about ten well-specified targets (table 2). The targets should be (1) positive and make work easier, (2) generally acceptable, (3) simple and briefly stated, (4) expressed at the start with action verbs to emphasize the important items to be done and (5) easy to observe and measure.
Table 2. An example of best work practices
- Keep gangways, aisles clear.
- Keep tools stored in proper places when not in use.
- Use proper containers and disposal methods for chemicals.
- Store all manuals at right place after use.
- Make sure of the right calibration on measuring instruments.
- Return trolleys, buggies, pallets at proper location after use.
- Take only right quantity of parts (bolts, nuts, etc.) from bins and return any unused items
- back in proper place.
- Remove from pockets any loose objects that may fall without notice.
The key words for specifying the targets are tools and materials. Usually the targets refer to goals such as the proper placement of materials and tools, keeping the aisles open, correcting leaks and other process disturbances right away, and keeping free access to fire extinguishers, emergency exits, electric substations, safety switches and so on. The performance targets at a printing ink factory are given in table 3.
Table 3. Performance targets at a printing ink factory
- Keep aisles open.
- Always put covers on containers when possible.
- Close bottles after use.
- Clean and return tools after use.
- Ground containers when moving flammable substances.
- Use personal protection as specified.
- Use local exhaust ventilation.
- Store in working areas only materials and substances needed immediately.
- Use only the designated fork-lift truck in the department making flexographic printing inks.
- Label all containers.
These targets are comparable to the safe behaviours defined in the behaviour modification programmes. The difference is that Tuttava behaviours leave visible marks. Closing bottles after use may be a behaviour which takes less than a minute. However, it is possible to see if this was done or not by observing the bottles not in use. There is no need to observe people, a fact which is important for avoiding fingerpointing and blame.
The targets define the behavioural change that the team expects from the employees. In this sense, they compare with the safe behaviours in behaviour modification. However, most of the targets refer to things which are not only workers’ behaviours but which have a much wider meaning. For example, the target may be to store only immediately needed materials in the work area. This requires an analysis of the work process and an understanding of it, and may reveal problems in the technical and organizational arrangements. Sometimes, the materials are not stored conveniently for daily use. Sometimes, the delivery systems work so slowly or are so vulnerable to disturbances that employees stockpile too much material in the work area.
Observation checklist
When the performance targets are sufficiently well defined, the team designs an observation checklist to measure to what extent the targets are met. About 100 measurement points are chosen from the area. For example, the number of measurement points was 126 in the printing ink factory. In each point, the team observes one or several specific items. For example, as regards a waste container, the items could be (1) is the container not too full, (2) is the right kind of waste put into it or (3) is the cover on, if needed? Each item can only be either correct or incorrect. Dichotomized observations make the measurement system objective and reliable. This allows one to calculate a performance index after an observation round covering all measurement points. The index is simply the percentage of items assessed correct. The index can, quite obviously, range from 0 to 100, and it indicates directly to what degree the standards are met. When the first draft of the observation checklist is available, the team conducts a test round. If the result is around 50 to 60%, and if each member of the team gets about the same result, the team can move on to the next phase of Tuttava. If the result of the first observation round is too low—say, 20%—then the team revises the list of performance targets. This is because the programme should be positive in every aspect. Too low a baseline would not adequately assess previous performance; it would rather merely set the blame for poor performance. A good baseline is around 50%.
Technical, organizational and procedural improvements
A very important step in the programme is ensuring the attainment of the performance targets. For example, waste may be lying on floors simply because the number of waste containers is insufficient. There may be excessive materials and parts because the supply system does not work. The system has to become better before it is correct to demand a behavioural change from the workers. By examining each of the targets for attainability, the team usually identifies many opportunities for technical, organizational and procedural improvements. In this way, the worker members bring their practical experience into the development process.
Because the workers spend the entire day at their workplace, they have much more knowledge about the work processes than management. Analysing the attainment of the performance targets, the workers get the opportunity to communicate their ideas to management. As improvements then take place, the employees are much more receptive to the request to meet the performance targets. Usually, this step leads to easily manageable corrective actions. For example, products were removed from the line for adjustments. Some of the products were good, some were bad. The production workers wanted to have designated areas marked for good and bad products so as to know which products to put back on the line and which ones to send for recycling. This step may also call for major technical modifications, such as a new ventilation system in the area where the rejected products are stored. Sometimes, the number of modifications is very high. For example, over 300 technical improvements were made in a plant producing oil-based chemicals which employs only 60 workers. It is important to manage the implementation of improvements well to avoid frustration and the overloading of the respective departments.
Baseline measurements
Baseline observations are started when the attainment of performance targets is sufficiently ensured and when the observation checklist is reliable enough. Sometimes, the targets need revisions, as improvements take a longer time. The team conducts weekly observation rounds for a few weeks to determine the prevailing standard. This phase is important, because it makes it possible to compare the performance at any later time to the initial performance. People forget easily how things were just a couple of months in the past. It is important to have the feeling of progress to reinforce continuous improvements.
Feedback
As the next step, the team trains all people in the area. It is usually done in a one-hour seminar. This is the first time when the results of the baseline measurements are made generally known. The feedback phase starts immediately after the seminar. The observation rounds continue weekly. Now, the result of the round is immediately made known to everybody by posting the index on a chart placed in a visible location. All critical remarks, blame or other negative comments are strictly forbidden. Although the team will identify individuals not behaving as specified in the targets, the team is instructed to keep the information to themselves. Sometimes, all employees are integrated into the process from the very beginning, especially if the number of people working in the area is small. This is better than having representative implementation teams. However, it may not be feasible everywhere.
Effects on performance
Change happens within a couple of weeks after the feedback starts (figure 5). People start to keep the worksite in visibly better order. The performance index jumps typically from 50 to 60% and then even to 80 or 90%. This may not sound big in absolute terms, but it is a big change on the shop floor.
Figure 5. The results from a department at a shipyard
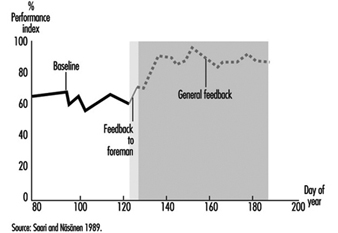
As the performance targets refer on purpose not only to safety issues, the benefits extend from better safety to productivity, saving of materials and floor footage, better physical appearance and so on. To make the improvements attractive to all, there are targets which integrate safety with other goals, such as productivity and quality. This is necessary to make safety more attractive for the management, who in this way will also provide funding more willingly for the less important safety improvements
Sustainable results
When the programme was first developed, 12 experiments were conducted to test the various components. Follow-up observations were made at a shipyard for 2 years. The new level of performance was well kept up during the 2-year follow-up. The sustainable results separate this process from normal behaviour modification. The visible changes in the location of materials, tools and so on, and the technical improvements deter the already secured improvement from fading away. When 3 years had gone by, an evaluation of the effect on accidents at the shipyard was made. The result was dramatic. Accidents had gone down by from 70 to 80%. This was much more than could be expected on the basis of the behavioural change. The number of accidents totally unrelated to performance targets went down as well.
The major effect on accidents is not attributable to the direct changes the process achieves. Rather, this is a starting point for other processes to follow. As Tuttava is very positive and as it brings noticeable improvements, the relations between management and labour get better and the teams get encouragement for other improvements.
Cultural change
A large steel mill was one of the numerous users of Tuttava, the primary purpose of which is to change safety culture. When they started in l987 there were 57 accidents per million hours worked. Prior to this, safety management relied heavily on commands from the top. Unfortunately, the president retired and everybody forgot safety, as the new management could not create a similar demand for safety culture. Among middle management, safety was considered negatively as something extra to be done because of the president’s demand. They organized ten Tuttava teams in l987, and new teams were added every year after that. Now, they have less than 35 accidents per million hours worked, and production has steadily increased during these years. The process caused the safety culture to improve as the middle managers saw in their respective departments improvements which were simultaneously good for safety and production. They became more receptive to other safety programmes and initiatives.
The practical benefits were big. For example, the maintenance service department of the steel mill, employing 300 people, reported a reduction of 400 days in the number of days lost due to occupational injuries—in other words, from 600 days to 200 days. The absenteeism rate fell also by one percentage point. The supervisors said that “it is nicer to come to a workplace which is well organized, both materially and mentally”. The investment was just a fraction of the economic benefit.
Another company employing 1,500 people reported the release of 15,000 m2 of production area, since materials, equipment and so forth, are stored in a better order. The company paid US$1.5 million less in rent. A Canadian company saves about 1 million Canadian dollars per year because of reduced material damages resulting from the implementation of Tuttava.
These are results which are possible only through a cultural change. The most important element in the new culture is shared positive experiences. A manager said, “You can buy people’s time, you can buy their physical presence at a given place, you can even buy a measured number of their skilled muscular motions per hour. But you cannot buy loyalty, you cannot buy the devotion of hearts, minds, or souls. You must earn them.” The positive approach of Tuttava helps managers to earn the loyalty and the devotion of their working teams. Thereby the programme helps involve employees in subsequent improvement projects.
Organizational Climate and Safety
We live in an era of new technology and more complex production systems, where fluctuations in global economics, customer requirements and trade agreements affect a work organization’s relationships (Moravec 1994). Industries are facing new challenges in the establishment and maintenance of a healthy and safe work environment. In several studies, management’s safety efforts, management’s commitment and involvement in safety as well as quality of management have been stressed as key elements of the safety system (Mattila, Hyttinen and Rantanen 1994; Dedobbeleer and Béland 1989; Smith 1989; Heinrich, Petersen and Roos 1980; Simonds and Shafai-Sahrai 1977; Komaki 1986; Smith et al. 1978).
According to Hansen (1993a), management’s commitment to safety is not enough if it is a passive state; only active, visible leadership which creates a climate for performance can successfully guide a corporation to a safe workplace. Rogers (1961) indicated that “if the administrator, or military or industrial leader, creates such a climate within the organization, then staff will become more self-responsive, more creative, better able to adapt to new problems, more basically cooperative.” Safety leadership is thus seen as fostering a climate where working safely is esteemed—a safety climate.
Very little research has been done on the safety climate concept (Zohar 1980; Brown and Holmes 1986; Dedobbeleer and Béland 1991; Oliver, Tomas and Melia 1993; Melia, Tomas and Oliver 1992). People in organizations encounter thousands of events, practices and procedures, and they perceive these events in related sets. What this implies is that work settings have numerous climates and that safety climate is seen as one of them. As the concept of climate is a complex and multilevel phenomenon, organizational climate research has been plagued by theoretical, conceptual and measurement problems. It thus seems crucial to examine these issues in safety climate research if safety climate is to remain a viable research topic and a worthwhile managerial tool.
Safety climate has been considered a meaningful concept which has considerable implications for understanding employee performance (Brown and Holmes 1986) and for assuring success in injury control (Matttila, Hyttinen and Rantanen 1994). If safety climate dimensions can be accurately assessed, management may use them to both recognize and evaluate potential problem areas. Moreover, research results obtained with a standardized safety climate score can yield useful comparisons across industries, independent of differences in technology and risk levels. A safety climate score may thus serve as a guideline in the establishment of a work organization’s safety policy. This article examines the safety climate concept in the context of the organizational climate literature, discusses the relationship between safety policy and safety climate and examines the implications of the safety climate concept for leadership in the development and enforcement of a safety policy in an industrial organization.
The Concept of Safety Climate in Organizational Climate Research
Organizational climate research
Organizational climate has been a popular concept for some time. Multiple reviews of organizational climate have appeared since the mid-1960s (Schneider 1975a; Jones and James 1979; Naylor, Pritchard and Ilgen 1980; Schneider and Reichers 1983; Glick 1985; Koys and DeCotiis 1991). There are several definitions of the concept. Organizational climate has been loosely used to refer to a broad class of organizational and perceptual variables that reflect individual-organizational interactions (Glick 1985; Field and Abelson 1982; Jones and James 1979). According to Schneider (1975a), it should refer to an area of research rather than a specific unit of analysis or a particular set of dimensions. The term organizational climate should be supplanted by the word climate to refer to a climate for something.
The study of climates in organizations has been difficult because it is a complex and multi-level phenomenon (Glick 1985; Koys and DeCotiis 1991). Nevertheless, progress has been made in conceptualizing the climate construct (Schneider and Reichers 1983; Koys and DeCotiis 1991). A distinction proposed by James and Jones (1974) between psychological climates and organizational climates has gained general acceptance. The differentiation is made in terms of level of analysis. The psychological climate is studied at the individual level of analysis, and the organizational climate is studied at the organizational level of analysis. When regarded as an individual attribute, the term psychological climate is recommended. When regarded as an organizational attribute, the term organizational climate is seen as appropriate. Both aspects of climate are considered to be multi-dimensional phenomena, descriptive of the nature of employees perceptions of their experiences within a work organization.
Although the distinction between psychological and organizational climate is generally accepted, it has not extricated organizational climate research from its conceptual and methodological problems (Glick 1985). One of the unresolved problems is the aggregation problem. Organizational climate is often defined as a simple aggregation of psychological climate in an organization (James 1982; Joyce and Slocum 1984). The question is: How can we aggregate individuals’ descriptions of their work setting so as to represent a larger social unit, the organization? Schneider and Reichers (1983) noted that “hard conceptual work is required prior to data collection so that (a) the clusters of events assessed sample the relevant domain of issues and (b) the survey is relatively descriptive in focus and refers to the unit (i.e., individual, subsystem, total organization) of interest for analytical purposes.” Glick (1985) added that organizational climate should be conceptualized as an organizational phenomenon, not as a simple aggregation of psychological climate. He also acknowledged the existence of multiple units of theory and analysis (i.e., individual, subunit and organizational). Organizational climate connotes an organizational unit of theory; it does not refer to the climate of an individual, workgroup, occupation, department or job. Other labels and units of theory and analysis should be used for the climate of an individual and the climate of a workgroup.
Perceptual agreement among employees in an organization has received considerable attention (Abbey and Dickson 1983; James 1982). Low perceptual agreement on psychological climate measures are attributed to both random error and substantive factors. As employees are asked to report on the organization’s climate and not their psychological or work group climate, many of the individual-level random errors and sources of bias are considered to cancel each other when the perceptual measures are aggregated to the organizational level (Glick 1985). To disentangle psychological and organizational climates and to estimate the relative contributions of organizational and psychological processes as determinants of the organizational and psychological climates, use of multi-level models appears to be crucial (Hox and Kreft 1994; Rabash and Woodhouse 1995). These models take into account psychological and organizational levels without using averaged measures of organizational climates that are usually taken on a representative sample of individuals in a number of organizations. It can be shown (Manson, Wong and Entwisle 1983) that biased estimates of organizational climate averages and of effects of organizational characteristics on climates result from aggregating at the organizational level, measurements taken at the individual level. The belief that individual-level measurement errors are cancelled out when averaged over an organization is unfounded.
Another persistent problem with the concept of climate is the specification of appropriate dimensions of organizational and/or psychological climate. Jones and James (1979) and Schneider (1975a) suggested using climate dimensions that are likely to influence or be associated with the study’s criteria of interest. Schneider and Reichers (1983) extended this idea by arguing that work organizations have different climates for specific things such as safety, service (Schneider, Parkington and Buxton 1980), in-company industrial relations (Bluen and Donald 1991), production, security and quality. Although criterion referencing provides some focus in the choice of climate dimensions, climate remains a broad generic term. The level of sophistication required to be able to identify which dimensions of practices and procedures are relevant for understanding particular criteria in specific collectivities (e.g., groups, positions, functions) has not been reached (Schneider 1975a). However, the call for criterion-oriented studies does not per se rule out the possibility that a relatively small set of dimensions may still describe multiple environments while any particular dimension may be positively related to some criteria, unrelated to others and negatively related to a third set of outcomes.
The safety climate concept
The safety climate concept has been developed in the context of the generally accepted definitions of the organizational and psychological climate. No specific definition of the concept has yet been offered to provide clear guidelines for measurement and theory building. Very few studies have measured the concept, including a stratified sample of 20 industrial organizations in Israel (Zohar 1980), 10 manufacturing and produce companies in the states of Wisconsin and Illinois (Brown and Holmes 1986), 9 construction sites in the state of Maryland (Dedobbeleer and Béland 1991), 16 construction sites in Finland (Mattila, Hyttinen and Rantanen 1994, Mattila, Rantanen and Hyttinen 1994), and among Valencia workers (Oliver, Tomas and Melia 1993; Melia, Tomas and Oliver 1992).
Climate was viewed as a summary of perceptions workers share about their work settings. Climate perceptions summarize an individual’s description of his or her organizational experiences rather than his or her affective evaluative reaction to what has been experienced (Koys and DeCotiis 1991). Following Schneider and Reichers (1983) and Dieterly and Schneider (1974), safety climate models assumed that these perceptions are developed because they are necessary as a frame of reference for gauging the appropriateness of behaviour. Based on a variety of cues present in their work environment, employees were believed to develop coherent sets of perceptions and expectations regarding behaviour-outcome contingencies, and to behave accordingly (Frederiksen, Jensen and Beaton 1972; Schneider 1975a, 1975b).
Table 1 demonstrates some diversity in the type and number of safety climate dimensions presented in validation studies on safety climate. In the general organizational climate literature, there is very little agreement on the dimensions of organizational climate. However, researchers are encouraged to use climate dimensions that are likely to influence or be associated with the study’s criteria of interest. This approach has been successfully adopted in the studies on safety climate. Zohar (1980) developed seven sets of items that were descriptive of organizational events, practices and procedures and which were found to differentiate high- from low-accident factories (Cohen 1977). Brown and Holmes (1986) used Zohar’s 40-item questionnaire, and found a three-factor model instead of the Zohar eight-factor model. Dedobbeleer and Béland used nine variables to measure the three-factor model of Brown and Holmes. The variables were chosen to represent safety concerns in the construction industry and were not all identical to those included in Zohar’s questionnaire. A two-factor model was found. We are left debating whether differences between the Brown and Holmes results and the Dedobbeleer and Béland results are attributable to the use of a more adequate statistical procedure (LISREL weighted least squares procedure with tetrachoric correlations coefficients). A replication was done by Oliver, Tomas and Melia (1993) and Melia, Tomas and Oliver (1992) with nine similar but not identical variables measuring climate perceptions among post-traumatic and pre-traumatic workers from different types of industries. Similar results to those of the Dedobbeleer and Béland study were found.
Table 1. Safety climate measures
|
Author(s) |
Dimensions |
Items |
|
Zohar (1980) |
Perceived importance of safety training |
40 |
|
Brown and Holmes (1986) |
Employee perception of how concerned management is with their well-being |
10 |
|
Dedobbeleer and Béland (1991) |
Management’s commitment and involvement in safety |
9 |
|
Melia, Tomas and Oliver (1992) |
Dedobbeleer and Béland two-factor model |
9 |
|
Oliver, Tomas and Melia (1993) |
Dedobbeleer and Béland two-factor model |
9 |
Several strategies have been used for improving the validity of safety climate measures. There are different types of validity (e.g., content, concurrent and construct) and several ways to evaluate the validity of an instrument. Content validity is the sampling adequacy of the content of a measuring instrument (Nunnally 1978). In safety climate research, the items are those shown by previous research to be meaningful measures of occupational safety. Other “competent” judges usually judge the content of the items, and then some method for pooling these independent judgements is used. There is no mention of such a procedure in the articles on safety climate.
Construct validity is the extent to which an instrument measures the theoretical construct the researcher wishes to measure. It requires a demonstration that the construct exists, that it is distinct from other constructs, and that the particular instrument measures that particular construct and no others (Nunnally 1978). Zohar’s study followed several suggestions for improving validity. Representative samples of factories were chosen. A stratified random sample of 20 production workers was taken in each plant. All questions focused on organizational climate for safety. To study the construct validity of his safety climate instrument, he used Spearman rank correlation coefficients to test the agreement between safety climate scores of factories and safety inspectors’ ranking of the selected factories in each production category according to safety practices and accident-prevention programmes. The level of safety climate was correlated with safety programme effectiveness as judged by safety inspectors. Using LISREL confirmatory factor analyses, Brown and Holmes (1986) checked the factorial validity of the Zohar measurement model with a sample of US workers. They wanted to validate Zohar’s model by the recommended replication of factor structures (Rummel 1970). The model was not supported by the data. A three-factor model provided a better fit. Results also indicated that the climate structures showed stability across different populations. They did not differ between employees who had accidents and those who had none, subsequently providing a valid and reliable climate measure across the groups. Groups were then compared on climate scores, and differences in climate perception were detected between the groups. As the model has the ability of distinguishing individuals who are known to differ, concurrent validity has been shown.
In order to test the stability of the Brown and Holmes three-factor model (1986), Dedobbeleer and Béland (1991) used two LISREL procedures (the maximum likelihood method chosen by Brown and Holmes and the weighted least squares method) with construction workers. Results revealed that a two-factor model provided an overall better fit. Construct validation was also tested by investigating the relationship between a perceptual safety climate measure and objective measures (i.e., structural and processes characteristics of the construction sites). Positive relationships were found between the two measures. Evidence was gathered from different sources (i.e., workers and superintendents) and in different ways (i.e., written questionnaire and interviews). Mattila, Rantanen and Hyttinen (1994) replicated this study by showing that similar results were obtained from the objective measurements of the work environment, resulting in a safety index, and the perceptual safety climate measures.
A systematic replication of the Dedobbeleer and Béland (1991) bifactorial structure was done in two different samples of workers in different occupations by Oliver, Tomas and Melia (1993) and Melia, Tomas and Oliver (1992). The two-factor model provided the best global fit. The climate structures did not differ between US construction workers and Spanish workers from different types of industries, subsequently providing a valid climate measure across different populations and different types of occupations.
Reliability is an important issue in the use of a measurement instrument. It refers to the accuracy (consistency and stability) of measurement by an instrument (Nunnally 1978). Zohar (1980) assessed organizational climate for safety in samples of organizations with diverse technologies. The reliability of his aggregated perceptual measures of organizational climate was estimated by Glick (1985). He calculated the aggregate level mean rater reliability by using the Spearman-Brown formula based on the intraclass correlation from a one-way analysis of variance, and found an ICC(1,k) of 0.981. Glick concluded that Zohar’s aggregated measures were consistent measures of organizational climate for safety. The LISREL confirmatory factor analyses conducted by Brown and Holmes (1986), Dedobbeleer and Béland (1991), Oliver, Tomas and Melia (1993) and Melia, Tomas and Oliver (1992) also showed evidence of the reliability of the safety climate measures. In the Brown and Holmes study, the factor structures remained the same for no accident versus accident groups. Oliver et al. and Melia et al. demonstrated the stability of the Dedobbeleer and Béland factor structures in two different samples.
Safety Policy and Safety Climate
The concept of safety climate has important implications for industrial organizations. It implies that workers have a unified set of cognitions regarding the safety aspects of their work settings. As these cognitions are seen as a necessary frame of reference for gauging the appropriateness of behaviour (Schneider 1975a), they have a direct influence on workers’ safety performance (Dedobbeleer, Béland and German 1990). There are thus basic applied implications of the safety climate concept in industrial organizations. Safety climate measurement is a practical tool that can be used by management at low cost to evaluate as well as recognize potential problem areas. It should thus be recommended to include it as one element of an organization’s safety information system. The information provided may serve as guidelines in the establishment of a safety policy.
As workers’ safety climate perceptions are largely related to management’s attitudes about safety and management’s commitment to safety, it can therefore be concluded that a change in management’s attitudes and behaviours are prerequisites for any successful attempt at improving the safety level in industrial organizations. Excellent management becomes safety policy. Zohar (1980) concluded that safety should be integrated in the production system in a manner which is closely related to the overall degree of control that management has over the production processes. This point has been stressed in the literature regarding safety policy. Management involvement is seen as critical to safety improvement (Minter 1991). Traditional approaches show limited effectiveness (Sarkis 1990). They are based on elements such as safety committees, safety meetings, safety rules, slogans, poster campaigns and safety incentives or contests. According to Hansen (1993b), these traditional strategies place safety responsibility with a staff coordinator who is detached from the line mission and whose task is almost exclusively to inspect the hazards. The main problem is that this approach fails to integrate safety into the production system, thereby limiting its ability to identify and resolve management oversights and insufficiencies that contribute to accident causation (Hansen 1993b; Cohen 1977).
Contrary to production workers in the Zohar and Brown and Holmes studies, construction workers perceived management’s safety attitudes and actions as one single dimension (Dedobbeleer and Béland 1991). Construction workers also perceived safety as a joint responsibility between individuals and management. These results have important implications for the development of safety policies. They suggest that management’s support and commitment to safety should be highly visible. Moreover, they indicate that safety policies should address the safety concerns of both management and workers. Safety meetings as the “cultural circles” of Freire (1988) can be a proper means for involving workers in the identification of safety problems and solutions to these problems. Safety climate dimensions are thus in close relationship with the partnership mentality to improve job safety, contrasting with the police enforcement mentality that was present in the construction industry (Smith 1993). In the context of expanding costs of health care and workers’ compensation, a non-adversarial labour-management approach to health and safety has emerged (Smith 1993). This partnership approach thus calls for a safety-management revolution, moving away from traditional safety programmes and safety policies.
In Canada, Sass (1989) indicated the strong resistance by management and government to extension of workers’ rights in occupational health and safety. This resistance is based upon economic considerations. Sass therefore argued for “the development of an ethics of the work environment based upon egalitarian principles, and the transformation of the primary work group into a community of workers who can shape the character of their work environment.” He also suggested that the appropriate relationship in industry to reflect a democratic work environment is “partnership”, the coming together of the primary work groups as equals. In Quebec, this progressive philosophy has been operationalized in the establishment of “parity committees” (Gouvernement du Québec 1978). According to law, each organization having more than ten employees had to create a parity committee, which includes employer’s and workers’ representatives. This committee has decisive power in the following issues related to the prevention programme: determination of a health services programme, choice of the company physician, ascertainment of imminent dangers and the development of training and information programmes. The committee is also responsible for preventive monitoring in the organization; responding to workers’ and employer’s complaints; analysing and commenting on accident reports; establishing a registry of accidents, injuries, diseases and workers’ complaints; studying statistics and reports; and communicating information on the committee’s activities.
Leadership and Safety Climate
To make things happen that enable the company to evolve toward new cultural assumptions, management has to be willing to go beyond “commitment” to participatory leadership (Hansen 1993a). The workplace thus needs leaders with vision, empowerment skills and a willingness to cause change.
Safety climate is created by the actions of leaders. This means fostering a climate where working safely is esteemed, inviting all employees to think beyond their own particular jobs, to take care of themselves and their co-workers, propagating and cultivating leadership in safety (Lark 1991). To induce this climate, leaders need perception and insight, motivation and skill to communicate dedication or commitment to the group beyond self-interest, emotional strength, ability to induce “cognition redefinition” by articulating and selling new visions and concepts, ability to create involvement and participation, and depth of vision (Schein 1989). To change any elements of the organization, leaders must be willing to “unfreeze” (Lewin 1951) their own organization.
According to Lark (1991), leadership in safety means at the executive level, creating an overall climate in which safety is a value and in which supervisors and non-supervisors conscientiously and in turn take the lead in hazard control. These executive leaders publish a safety policy in which they: affirm the value of each employee and of the group, and their own commitment to safety; relate safety to the continuance of the company and the achievement of its objectives; express their expectations that each individual will be responsible for safety and take an active part in keeping the workplace healthy and safe; appoint a safety representative in writing and empower this individual to execute corporate safety policy.
Supervisor leaders expect safe behaviour from subordinates and directly involve them in the identification of problems and their solutions. Leadership in safety for the non-supervisor means reporting deficiencies, seeing corrective actions as a challenge, and working to correct these deficiencies.
Leadership challenges and empowers people to lead in their own right. At the core of this notion of empowerment is the concept of power, defined as the ability to control the factors that determine one’s life. The new health promotion movement, however, attempts to reframe power not as “power over” but rather as “power to” or as “power with” (Robertson and Minkler 1994).
Conclusions
Only some of the conceptual and methodological problems plaguing organizational climate scientists are being addressed in safety climate research. No specific definition of the safety climate concept has yet been given. Nevertheless, some of the research results are very encouraging. Most of the research efforts have been directed toward validation of a safety climate model. Attention has been given to the specification of appropriate dimensions of safety climate. Dimensions suggested by the literature on organizational characteristics found to discriminate high versus low accident rate companies served as a useful starting point for the dimension identification process. Eight-, three- and two-factor models are proposed. As Occam’s razor demands some parsimony, the limitation of the dimensions seems pertinent. The two-factor model is thus most appropriate, in particular in a work context where short questionnaires need to be administered. The factor analytic results for the scales based on the two dimensions are very satisfactory. Moreover, a valid climate measure is provided across different populations and different occupations. Further studies should, however, be conducted if the replication and generalization rules of theory testing are to be met. The challenge is to specify a theoretically meaningful and analytically practical universe of possible climate dimensions. Future research should also focus on organizational units of analysis in assessing and improving the validity and reliability of the organizational climate for safety measures. Several studies are being conducted at this moment in different countries, and the future looks promising.
As the safety climate concept has important implications for safety policy, it becomes particularly crucial to resolve the conceptual and methodological problems. The concept clearly calls for a safety-management revolution. A process of change in management attitudes and behaviours becomes a prerequisite to attaining safety performance. “Partnership leadership” has to emerge from this period where restructuring and layoffs are a sign of the times. Leadership challenges and empowers. In this empowerment process, employers and employees will increase their capacity to work together in a participatory manner. They will also develop skills of listening and speaking up, problem analysis and consensus building. A sense of community should develop as well as self-efficacy. Employers and employees will be able to build on this knowledge and these skills.
Safety Culture and Management
Safety culture is a new concept among safety professionals and academic researchers. Safety culture may be considered to include various other concepts referring to cultural aspects of occupational safety, such as safety attitudes and behaviours as well as a workplace’s safety climate, which are more commonly referred to and are fairly well documented.
A question arises whether safety culture is just a new word used to replace old notions, or does it bring new substantive content that may enlarge our understanding of the safety dynamics in organizations? The first section of this article answers this question by defining the concept of safety culture and exploring its potential dimensions.
Another question that may be raised about safety culture concerns its relationship to the safety performance of firms. It is accepted that similar firms classified in a given risk category frequently differ as to their actual safety performance. Is safety culture a factor of safety effectiveness, and, if so, what kind of safety culture will succeed in contributing to a desirable impact? This question is addressed in the second section of the article by reviewing some relevant empirical evidence concerning the impact of safety culture on safety performance.
The third section addresses the practical question of the management of the safety culture, in order to help managers and other organizational leaders to build a safety culture that contributes to the reduction of occupational accidents.
Safety Culture: Concept and Realities
The concept of safety culture is not yet very well defined, and refers to a wide range of phenomena. Some of these have already been partially documented, such as the attitudes and the behaviours of managers or workers towards risk and safety (Andriessen 1978; Cru and Dejours 1983; Dejours 1992; Dodier 1985; Eakin 1992; Eyssen, Eakin-Hoffman and Spengler 1980; Haas 1977). These studies are important for presenting evidence about the social and organizational nature of individuals’ safety attitudes and behaviours (Simard 1988). However, by focusing on particular organizational actors like managers or workers, they do not address the larger question of the safety culture concept, which characterizes organizations.
A trend of research which is closer to the comprehensive approach emphasized by the safety culture concept is represented by studies on the safety climate that developed in the 1980s. The safety climate concept refers to the perceptions workers have of their work environment, particularly the level of management’s safety concern and activities and their own involvement in the control of risks at work (Brown and Holmes 1986; Dedobbeleer and Béland 1991; Zohar 1980). Theoretically, it is believed that workers develop and use such sets of perceptions to ascertain what they believe is expected of them within the organizational environment, and behave accordingly. Though conceptualized as an individual attribute from a psychological perspective, the perceptions which form the safety climate give a valuable assessment of the common reaction of workers to an organizational attribute that is socially and culturally constructed, in this case by the management of occupational safety in the workplace. Consequently, although the safety climate does not completely capture the safety culture, it may be viewed as a source of information about the safety culture of a workplace.
Safety culture is a concept that (1) includes the values, beliefs and principles that serve as a foundation for the safety management system and (2) also includes the set of practices and behaviours that exemplify and reinforce those basic principles. These beliefs and practices are meanings produced by organizational members in their search for strategies addressing issues such as occupational hazards, accidents and safety at work. These meanings (beliefs and practices) are not only shared to a certain extent by members of the workplace but also act as a primary source of motivated and coordinated activity regarding the question of safety at work. It can be deduced that culture should be differentiated from both concrete occupational safety structures (the presence of a safety department, of a joint safety and health committee and so on) and existent occupational safety programmes (made up of hazards identification and control activities such as workplace inspections, accident investigation, job safety analysis and so on).
Petersen (1993) argues that safety culture “is at the heart of how safety systems elements or tools... are used” by giving the following example:
Two companies had a similar policy of investigating accidents and incidents as part of their safety programmes. Similar incidents occurred in both companies and investigations were launched. In the first company, the supervisor found that the workers involved behaved unsafely, immediately warned them of the safety infraction and updated their personal safety records. The senior manager in charge acknowledged this supervisor for enforcing workplace safety. In the second company, the supervisor considered the circumstances of the incident, namely that it occurred while the operator was under severe pressure to meet production deadlines after a period of mechanical maintenance problems that had slowed production, and in a context where the attention of employees was drawn from safety practices because recent company cutbacks had workers concerned about their job security. Company officials acknowledged the preventive maintenance problem and held a meeting with all employees where they discussed the current financial situation and asked workers to maintain safety while working together to improve production in view of helping the corporation’s viability.
“Why”, asked Petersen, “did one company blame the employee, fill out the incident investigation forms and get back to work while the other company found that it must deal with fault at all levels of the organization?” The difference lies in the safety cultures, not the safety programmes themselves, although the cultural way this programme is put into practice, and the values and beliefs that give meaning to actual practices, largely determine whether the programme has sufficient real content and impact.
From this example, it appears that senior management is a key actor whose principles and actions in occupational safety largely contribute to establish the corporate safety culture. In both cases, supervisors responded according to what they perceived to be “the right way of doing things”, a perception that had been reinforced by the consequent actions of top management. Obviously, in the first case, top management favoured a “by-the-book”, or a bureaucratic and hierarchical safety control approach, while in the second case, the approach was more comprehensive and conducive to managers’ commitment to, and workers’ involvement in, safety at work. Other cultural approaches are also possible. For example, Eakin (1992) has shown that in very small businesses, it is common that the top manager completely delegates responsibility for safety to the workers.
These examples raise the important question of the dynamics of a safety culture and the processes involved in the building, the maintenance and the change of organizational culture regarding safety at work. One of these processes is the leadership demonstrated by top managers and other organizational leaders, like union officers. The organizational culture approach has contributed to renewed studies of leadership in organizations by showing the importance of the personal role of both natural and organizational leaders in demonstrating commitment to values and creating shared meanings among organizational members (Nadler and Tushman 1990; Schein 1985). Petersen’s example of the first company illustrates a situation where top management’s leadership was strictly structural, a matter merely of establishing and reinforcing compliance to the safety programme and to rules. In the second company, top managers demonstrated a broader approach to leadership, combining a structural role in deciding to allow time to perform necessary preventive maintenance with a personal role in meeting with employees to discuss safety and production in a difficult financial situation. Finally, in Eakin’s study, senior managers of some small businesses seem to play no leadership role at all.
Other organizational actors who play a very important role in the cultural dynamics of occupational safety are middle managers and supervisors. In their study of more than one thousand first-line supervisors, Simard and Marchand (1994) show that a strong majority of supervisors are involved in occupational safety, though the cultural patterns of their involvement may differ. In some workplaces, the dominant pattern is what they call “hierarchical involvement” and is more control-oriented; in other organizations the pattern is “participatory involvement”, because supervisors both encourage and allow their employees to participate in accident-prevention activities; and in a small minority of organizations, supervisors withdraw and leave safety up to the workers. It is easy to see the correspondence between these styles of supervisory safety management and what has been previously said about the patterns of upper-level managers’ leadership in occupational safety. Empirically, though, the Simard and Marchand study shows that the correlation is not a perfect one, a circumstance that lends support to Petersen’s hypothesis that a major problem of many executives is how to build a strong, people-oriented safety culture among the middle and supervisory management. Part of this problem may be due to the fact that most of the lower-level managers are still predominantly production-minded and prone to blame workers for workplace accidents and other safety mishaps (DeJoy 1987 and 1994; Taylor 1981).
This emphasis on management should not be viewed as disregarding the importance of workers in the safety culture dynamics of workplaces. Workers’ motivation and behaviours regarding safety at work are influenced by the perceptions they have of the priority given to occupational safety by their supervisors and top managers (Andriessen 1978). This top-down pattern of influence has been proven in numerous behavioural experiments, using managers’ positive feedback to reinforce compliance to formal safety rules (McAfee and Winn 1989; Näsänen and Saari 1987). Workers also spontaneously form work groups when the organization of work offers appropriate conditions that allow them to get involved in the formal or informal safety management and regulation of the workplace (Cru and Dejours 1983; Dejours 1992; Dwyer 1992). This latter pattern of workers’ behaviours, more oriented towards the safety initiatives of work groups and their capacity for self-regulation, may be used positively by management to develop workforce involvement and safety in the building of a workplace’s safety culture.
Safety Culture and Safety Performance
There is a growing body of empirical evidence concerning the impact of safety culture on safety performance. Numerous studies have investigated characteristics of companies having low accident rates, while generally comparing them with similar companies having higher-than-average accident rates. A fairly consistent result of these studies, conducted in industrialized as well as in developing countries, emphasizes the importance of senior managers’ safety commitment and leadership for safety performance (Chew 1988; Hunt and Habeck 1993; Shannon et al. 1992; Smith et al. 1978). Moreover, most studies show that in companies with lower accident rates, the personal involvement of top managers in occupational safety is at least as important as their decisions in the structuring of the safety management system (functions that would include the use of financial and professional resources and the creation of policies and programmes, etc.). According to Smith et al. (1978) active involvement of senior managers acts as a motivator for all levels of management by keeping up their interest through participation, and for employees by demonstrating management’s commitment to their well-being. Results of many studies suggest that one of the best ways of demonstrating and promoting its humanistic values and people-oriented philosophy is for senior management to participate in highly visible activities, such as workplace safety inspections and meetings with employees.
Numerous studies regarding the relationship between safety culture and safety performance pinpoint the safety behaviours of first-line supervisors by showing that supervisors’ involvement in a participative approach to safety management is generally associated with lower accident rates (Chew 1988; Mattila, Hyttinen and Rantanen 1994; Simard and Marchand 1994; Smith et al. 1978). Such a pattern of supervisors’ behaviour is exemplified by frequent formal and informal interactions and communications with workers about work and safety, paying attention to monitoring workers’ safety performance and giving positive feedback, as well as developing the involvement of workers in accident-prevention activities. Moreover, the characteristics of effective safety supervision are the same as those for generally efficient supervision of operations and production, thereby supporting the hypothesis that there is a close connection between efficient safety management and good general management.
There is evidence that a safety-oriented workforce is a positive factor for the firm’s safety performance. However, perception and conception of workers’ safety behaviours should not be reduced to just carefulness and compliance with management safety rules, though numerous behavioural experiments have shown that a higher level of workers’ conformity to safety practices reduces accident rates (Saari 1990). Indeed, workforce empowerment and active involvement are also documented as factors of successful occupational safety programmes. At the workplace level, some studies offer evidence that effectively functioning joint health and safety committees (consisting of members who are well trained in occupational safety, cooperate in the pursuit of their mandate and are supported by their constituencies) significantly contribute to the firm’s safety performance (Chew 1988; Rees 1988; Tuohy and Simard 1992). Similarly, at the shop-floor level, work groups that are encouraged by management to develop team safety and self-regulation generally have a better safety performance than work groups subject to authoritarianism and social disintegration (Dwyer 1992; Lanier 1992).
It can be concluded from the above-mentioned scientific evidence that a particular type of safety culture is more conducive to safety performance. In brief, this safety culture combines top management’s leadership and support, lower management’s commitment and employees’ involvement in occupational safety. Actually, such a safety culture is one that scores high on what could be conceptualized as the two major dimensions of the safety culture concept, namely safety mission and safety involvement, as shown in figure 1.
Figure 1. Typology of safety cultures
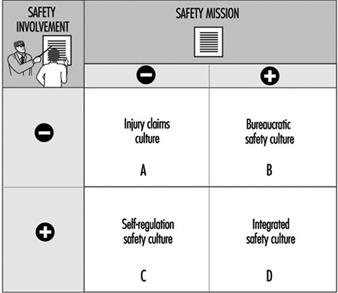
Safety mission refers to the priority given to occupational safety in the firm’s mission. Literature on organizational culture stresses the importance of an explicit and shared definition of a mission that grows out of and supports the key values of the organization (Denison 1990). Consequently, the safety mission dimension reflects the degree to which occupational safety and health are acknowledged by top management as a key value of the firm, and the degree to which upper-level managers use their leadership to promote the internalization of this value in management systems and practices. It can then be hypothesized that a strong sense of safety mission (+) impacts positively on safety performance because it motivates individual members of the workplace to adopt goal-directed behaviour regarding safety at work, and facilitates coordination by defining a common goal as well as an external criterion for orienting behaviour.
Safety involvement is where supervisors and employees join together to develop team safety at the shop-floor level. Literature on organizational culture supports the argument that high levels of involvement and participation contribute to performance because they create among organizational members a sense of ownership and responsibility leading to a greater voluntary commitment that facilitates the coordination of behaviour and reduces the necessity of explicit bureaucratic control systems (Denison 1990). Moreover, some studies show that involvement can be a managers’ strategy for effective performance as well as a workers’ strategy for a better work environment (Lawler 1986; Walton 1986).
According to figure 1, workplaces combining a high level of these two dimensions should be characterized by what we call an integrated safety culture, which means that occupational safety is integrated into the organizational culture as a key value, and into the behaviours of all organizational members, thereby reinforcing involvement from top managers down to the rank-and-file employees. The empirical evidence mentioned above supports the hypothesis that this type of safety culture should lead workplaces to the best safety performance when compared to other types of safety cultures.
The Management of an Integrated Safety Culture
Managing an integrated safety culture first requires the senior management’s will to build it into the organizational culture of the firm. This is no simple task. It goes far beyond adopting an official corporate policy emphasizing the key value and priority given to occupational safety and to the philosophy of its management, although indeed the integration of safety at work in the organization’s core values is a cornerstone in the building of an integrated safety culture. Indeed, top management should be conscious that such a policy is the starting point of a major organizational change process, since most organizations are not yet functioning according to an integrated safety culture. Of course, the details of the change strategy will vary depending on what the workplace’s existing safety culture already is (see cells A, B and C of figure 1). In any case, one of the key issues is for the top management to behave congruently with such a policy (in other words to practice what it preaches). This is part of the personal leadership top managers should demonstrate in implementing and enforcing such a policy. Another key issue is for senior management to facilitate the structuring or restructuring of various formal management systems so as to support the building of an integrated safety culture. For example, if the existing safety culture is a bureaucratic one, the role of the safety staff and joint health and safety committee should be reoriented in such a way as to support the development of supervisors’ and work teams’ safety involvement. In the same way, the performance evaluation system should be adapted so as to acknowledge lower-level managers’ accountability and the performance of work groups in occupational safety.
Lower-level managers, and particularly supervisors, also play a critical role in the management of an integrated safety culture. More specifically, they should be accountable for the safety performance of their work teams and they should encourage workers to get actively involved in occupational safety. According to Petersen (1993), most lower-level managers tend to be cynical about safety because they are confronted with the reality of upper management’s mixed messages as well as the promotion of various programmes that come and go with little lasting impact. Therefore, building an integrated safety culture often may require a change in the supervisors’ pattern of safety behaviour.
According to a recent study by Simard and Marchand (1995), a systematic approach to supervisors’ behaviour change is the most efficient strategy to effect change. Such an approach consists of coherent, active steps aimed at solving three major problems of the change process: (1) the resistance of individuals to change, (2) the adaptation of existing management formal systems so as to support the change process and (3) the shaping of the informal political and cultural dynamics of the organization. The latter two problems may be addressed by upper managers’ personal and structural leadership, as mentioned in the preceding paragraph. However, in unionized workplaces, this leadership should shape the organization’s political dynamics so as to create a consensus with union leaders regarding the development of participative safety management at the shop-floor level. As for the problem of supervisors’ resistance to change, it should not be managed by a command-and-control approach, but by a consultative approach which helps supervisors participate in the change process and develop a sense of ownership. Techniques such as the focus group and ad hoc committee, which allow supervisors and work teams to express their concerns about safety management and to engage in a problem-solving process, are frequently used, combined with appropriate training of supervisors in participative and effective supervisory management.
It is not easy to conceive a truly integrated safety culture in a workplace that has no joint health and safety committee or worker safety delegate. However, many industrialized and some developing countries now have laws and regulations that encourage or mandate workplaces to establish such committees and delegates. The risk is that these committees and delegates may become mere substitutes for real employee involvement and empowerment in occupational safety at the shop-floor level, thereby serving to reinforce a bureaucratic safety culture. In order to support the development of an integrated safety culture, joint committees and delegates should foster a decentralized and participative safety management approach, for example by (1) organizing activities that raise employees’ consciousness of workplace hazards and risk-taking behaviours, (2) designing procedures and training programmes that empower supervisors and work teams to solve many safety problems at the shop-floor level, (3) participating in the workplace’s safety performance appraisal and (4) giving reinforcing feedback to supervisors and workers.
Another powerful means of promoting an integrated safety culture among employees is to conduct a perception survey. Workers generally know where many of the safety problems are, but since no one asks them their opinion, they resist getting involved in the safety programme. An anonymous perception survey is a means to break this stalemate and promote employees’ safety involvement while providing senior management with feedback that can be used to improve the safety programme’s management. Such a survey can be done using an interview method combined with a questionnaire administered to all or to a statistically valid sample of employees (Bailey 1993; Petersen 1993). The survey follow-up is crucial for building an integrated safety culture. Once the data are available, top management should proceed with the change process by creating ad hoc work groups with participation from every echelon of the organization, including workers. This will provide for more in-depth diagnoses of problems identified in the survey and will recommend ways of improving aspects of the safety management that need it. Such a perception survey may be repeated every year or two, in order to periodically assess the improvement of their safety management system and culture.
Safety Policy, Leadership and Culture
The subjects of leadership and culture are the two most important considerations among the conditions necessary to achieve excellence in safety. Safety policy may or may not be regarded as being important, depending upon the worker’s perception as to whether management commitment to and support of the policy is in fact carried out every day. Management often writes the safety policy and then fails to ensure that it is enforced by managers and supervisors on the job, every day.
Safety Culture and Safety Results
We used to believe that there were certain “essential elements” of a “safety programme”. In the United States, regulatory agencies provide guidelines as to what those elements are (policy, procedures, training, inspections, investigations, etc.). Some provinces in Canada state that there are 20 essential elements, while some organizations in the United Kingdom suggest that 30 essential elements should be considered in safety programmes. Upon close examination of the rationale behind the different lists of essential elements, it becomes obvious that the lists of each reflect merely the opinion of some writer from the past (Heinrich, say, or Bird). Similarly, regulations on safety programming often reflect the opinion of some early writer. There is seldom any research behind these opinions, resulting in situations where the essential elements may work in one organization and not in another. When we do actually look at the research on safety system effectiveness, we begin to understand that although there are many essential elements which are applicable to safety results, it is the worker’s perception of the culture that determines whether or not any single element will be effective. There are a number of studies cited in the references which lead to the conclusion that there are no “must haves” and no “essential” elements in a safety system.
This poses some serious problems since safety regulations tend to instruct organizations simply to “have a safety programme” that consists of five, seven, or any number of elements, when it is obvious that many of the prescribed activities will not work and will waste time, effort and resources which could be used to undertake the pro-active activities that will prevent loss. It is not which elements are used that determines the safety results; rather it is the culture in which these elements are used that determines success. In a positive safety culture, almost any elements will work; in a negative culture, probably none of the elements will get results.
Building Culture
If the culture of the organization is so important, efforts in safety management ought to be aimed first and foremost at building culture in order that those safety activities which are instituted will get results. Culture can be loosely defined as “the way it is around here”. Safety culture is positive when the workers honestly believe that safety is a key value of the organization and can perceive that it is high on the list of organization priorities. This perception by the workforce can be attained only when they see management as credible; when the words of safety policy are lived on a daily basis; when management’s decisions on financial expenditures show that money is spent for people (as well as to make more money); when the measures and rewards provided by management force mid-manager and supervisory performance to satisfactory levels; when workers have a role in problem solving and decision making; when there is a high degree of confidence and trust between management and the workers; when there is openness of communications; and when workers receive positive recognition for their work.
In a positive safety culture like that described above, almost any element of the safety system will be effective. In fact, with the right culture, an organization hardly even needs a “safety programme”, for safety is dealt with as a normal part of the management process. To achieve a positive safety culture, certain criteria must be met
1. A system must be in place that ensures regular daily pro-active supervisory (or team) activities.
2. The system must actively ensure that middle-management tasks and activities are carried out in these areas:
- ensuring subordinate (supervisory or team) regular performance
- ensuring the quality of that performance
- engaging in certain well-defined activities to show that safety is so important that even upper managers are doing something about it.
3. Top management must visibly demonstrate and support that safety has a high priority in the organization.
4. Any worker who chooses to should be able to be actively engaged in meaningful safety-related activities.
5. The safety system must be flexible, allowing choices to be made at all levels.
6. The safety effort must be seen as positive by the workforce.
These six criteria can be met regardless of the style of management of the organization, whether authoritarian or participative, and with completely different approaches to safety.
Culture and Safety Policy
Having a policy on safety seldom achieves anything unless it is followed up with systems that make the policy live. For example, if the policy states that supervisors are responsible for safety, it means nothing unless the following is in place:
- Management has a system where there is a clear definition of role and of what activities must be carried out to satisfy the safety responsibility.
- The supervisors know how to fulfil that role, are supported by management, believe the tasks are achievable and carry out their tasks as a result of proper planning and training.
- They are regularly measured to ensure they have completed the defined tasks (but not measured by an accident record) and to obtain feedback to determine whether or not tasks should be changed.
- There is a reward contingent upon task completion in the performance appraisal system or in whatever is the driving mechanism of the organization.
These criteria are true at each level of the organization; tasks must be defined, there must be a valid measure of performance (task completion) and a reward contingent upon performance. Thus, safety policy does not drive performance of safety; accountability does. Accountability is the key to building culture. It is only when the workers see supervisors and management fulfilling their safety tasks on a daily basis that they believe that management is credible and that top management really meant it when they signed the safety policy documents.
Leadership and Safety
It is obvious from the above that leadership is crucial to safety results, as leadership forms the culture that determines what will and will not work in the organization’s safety efforts. A good leader makes it clear what is wanted in terms of results, and also makes it clear exactly what will be done in the organization to achieve the results. Leadership is infinitely more important than policy, for leaders, through their actions and decisions, send clear messages throughout the organization as to which policies are important and which are not. Organizations sometimes state via policy that health and safety are key values, and then construct measures and reward structures that promote the opposite.
Leadership, through its actions, systems, measures and rewards, clearly determines whether or not safety will be achieved in the organization. This has never been more apparent to every worker in industry than during the 1990s. There has never been more stated allegiance to health and safety than in the last ten years. At the same time, there has never been more down-sizing or “right-sizing” and more pressure for production increases and cost reduction, creating more stress, more forced overtime, more work for fewer workers, more fear for the future and less job security than ever before. Right-sizing has decimated middle managers and supervisors and put more work on fewer workers (the key persons in safety). There is a general perception of overload at all levels of the organization. Overload causes more accidents, more physical fatigue, more psychological fatigue, more stress claims, more repetitive motion conditions and more cumulative trauma disorder. There has also been deterioration in many organizations of the relationship between the company and the worker, where there used to be mutual feelings of trust and security. In the former environment, a worker may have continued to “work hurt”. However, when workers fear for their jobs and they see that management ranks are so thin, they are non-supervised, they begin to feel as though the organization does not care for them any more, with the resultant deterioration in safety culture.
Gap Analysis
Many organizations are going through a simple process known as gap analysis consisting of three steps: (1) determining where you want to be; (2) determining where you are now and (3) determining how to get from where you are to where you want to be, or how to “bridge the gap”.
Determining where you want to be. What do you want your organization’s safety system to look like? Six criteria have been suggested against which to assess an organization’s safety system. If these are rejected, you must measure your organization’s safety system against some other criteria. For example, you might want to look at the seven climate variables of organizational effectiveness as established by Dr. Rensis Likert (1967), who showed that the better an organization is in certain things, the more likely it will be successful in economic success, and thus in safety. These climate variables are as follows:
- increasing the amount of worker confidence and managers’ general interest in the understanding of safety problems
- giving training and help where and as needed
- offering needed teaching as to how to solve problems
- providing the available required trust, enabling information sharing between management and their subordinates
- soliciting the ideas and opinions of the worker
- providing for approachability of top management
- recognizing the worker for doing a good job rather than for merely giving answers.
There are other criteria against which to assess oneself such as the criterion established to determine the likelihood of catastrophic events suggested by Zembroski (1991).
Determining where you are now. This is perhaps the most difficult. It was originally thought that safety system effectiveness could be determined by measuring the number of injuries or some subset of injuries (recordable injuries, lost time injuries, frequency rates, etc.). Due to the low numbers of these data, they usually have little or no statistical validity. Recognizing this in the 1950s and 1960s, investigators tended away from incident measures and attempted to judge safety system effectiveness through audits. The attempt was made to predetermine what must be done in an organization to get results, and then to determine by measurement whether or not those things were done.
For years it was assumed that audit scores predicted safety results; the better the audit score this year, the lower the accident record next year. We now know (from a variety of research) that audit scores do not correlate very well (if at all) with the safety record. The research suggests that most audits (external and sometimes internally constructed) tend to correlate much better with regulatory compliance than they do with the safety record. This is documented in a number of studies and publications.
A number of studies correlating audit scores and the injury record in large companies over periods of time (seeking to determine whether the injury record does have statistical validity) have found a zero correlation, and in some cases a negative correlation, between audit results and the injury record. Audits in these studies do tend to correlate positively with regulatory compliance.
Bridging the Gap
There appear to be only a few measures of safety performance that are valid (that is, they truly correlate with the actual accident record in large companies over long periods of time) which can be used to “bridge the gap”:
- behaviour sampling
- in-depth worker interviews
- perception surveys.
Perhaps the most important measure to look at is the perception survey, which is used to assess the current status of any organization’s safety culture. Critical safety issues are identified and any differences in management and employee views on the effectiveness of company safety programmes are clearly demonstrated.
The survey begins with a short set of demographic questions which can be used to organize graphs and tables to show the results (see figure 1). Typically participants are asked about their employee level, their general work location, and perhaps their trade group. At no point are the employees asked questions which would enable them to be identified by the people who are scoring the results.
Figure 1. Example of perception survey results
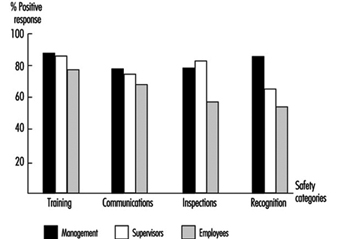
The second part of the survey consists of a number of questions. The questions are designed to uncover employee perceptions about various safety categories. Each question may affect the score of more than one category. A cumulative per cent positive response is computed for each category. The percentages for the categories are graphed (see figure 1) to display the results in descending order of positive perception by the line workers. Those categories on the right-hand side of the graph are the ones that are perceived by employees as being the least positive and are therefore the most in need of improvement.
Summary
Much has been learned about what determines the effectiveness of a safety system in recent years. It is recognized that culture is the key. The employees’ perception of the culture of the organization dictates their behaviour, and thus the culture determines whether or not any element of the safety programme will be effective.
Culture is established not by written policy, but rather by leadership; by day-to-day actions and decisions; and by the systems in place that ensure whether safety activities (performance) of managers, supervisors and work teams are carried out. Culture can be built positively through accountability systems that ensure performance and through systems that allow, encourage and get worker involvement. Moreover, culture can be validly assessed through perception surveys, and improved once the organization determines where it is they would like to be.
Principles of Prevention: Materials Handling and Internal Traffic
Materials handling and internal traffic are contributing factors in a major portion of accidents in many industries. Depending on the type of industry, the share of work accidents attributed to materials handling varies from 20 to 50%. The control of materials-handling risks is the foremost safety problem in dock work, the construction industry, warehousing, sawmills, shipbuilding and other similar heavy industries. In many process-type industries, such as the chemical products industry, the pulp and paper industry and the steel and foundry industries, many accidents still tend to occur during the handling of final products either manually or by fork-lift trucks and cranes.
This high accident potential in materials-handling activities is due to at least three basic characteristics:
- High amounts of potential and kinetic energies, which have the propensity for causing injury and damage, are found in transport and handling.
- The number of people required at transport and handling workplaces is still relatively high, and they are often exposed to the risks associated with such sites.
- Whenever several dynamic operations have to be carried out simultaneously and require cooperation in varying environments, there is an especially urgent need of clear and timely communication and information. The consequently high liability of many types of human errors and omissions may create hazardous situations.
Materials-Handling Accidents
Every time people or machines move loads, an accident risk is present. The magnitude of risk is determined by the technological and organizational characteristics of the system, the environment and the accident prevention measures implemented. For safety purposes, it is useful to depict materials handling as a system in which the various elements are interrelated (figure 1). When changes are introduced in any element of the system—equipment, goods, procedures, environment, people, management and organization—the risk of injuries is likely to change as well.
Figure 1. A materials-handling system
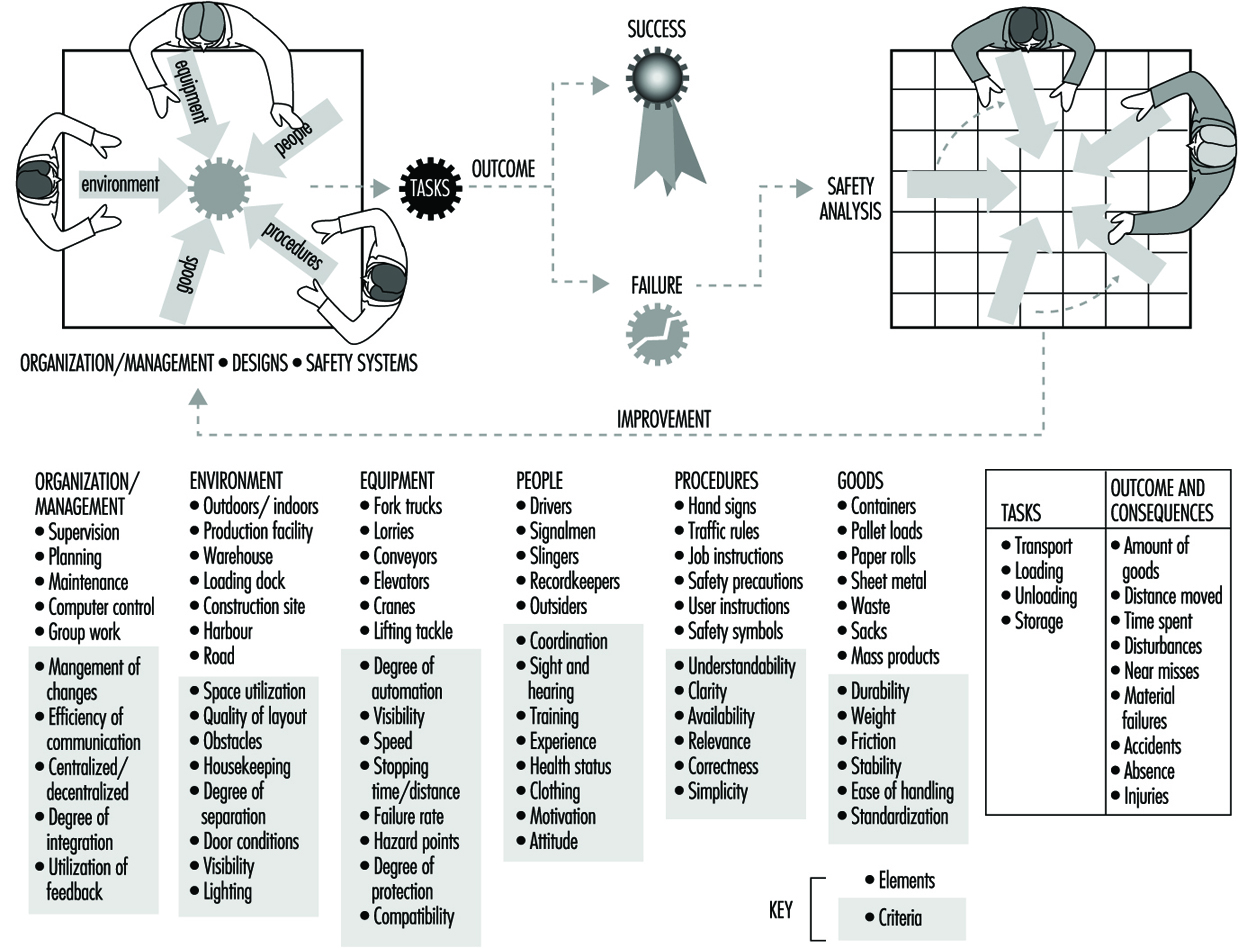
The most common materials-handling and internal traffic types involved in accidents are associated with manual handling, transport and moving by hand (carts, bicycles, etc.), lorries, fork-lift trucks, cranes and hoists, conveyors and rail transport.
Several types of accidents are commonly found in materials transport and handling at workplaces. The following list outlines the most frequent types:
- physical strain in manual handling
- loads falling onto people
- people trapped between objects
- collisions between equipment
- people falling
- hits, blows and cuts to people from equipment or loads.
Elements of Materials-Handling Systems
For each element in a materials-handling system, several design options are available, and the risk of accidents is affected accordingly. Several safety criteria must be considered for each element. It is important that the systems approach is used throughout the lifetime of the system—during the design of the new system, during the normal operation of the system and in following up on past accidents and disturbances in order to introduce improvements into the system.
General Principles of Prevention
Certain practical principles of prevention are generally regarded as applicable to safety in materials handling. These principles can be applied to both manual and mechanical materials-handling systems in a general sense and whenever a factory, warehouse or construction site is under consideration. Many different principles must be applied to the same project to achieve optimum safety results. Usually, no single measure can totally prevent accidents. Conversely, not all of these general principles are needed, and some of them may not work in a specific situation. Safety professionals and materials-handling specialists should consider the most relevant items to guide their work in each specific case. The most important issue is to manage the principles optimally to create safe and practicable materials-handling systems, rather than to settle upon any single technical principle to the exclusion of others.
The following 22 principles can be used for safety purposes in the development and assessment of materials-handling systems in their planned, present or historical stage. All of the principles are applicable in both pro-active and aftermath safety activities. No strict priority order is implied in the list that follows, but a rough division can be made: the first principles are more valid in the initial design of new plant layouts and materials-handling processes, whereas the last principles listed are more directed to the operation of existing materials-handling systems.
Twenty-two Principles of Prevention of Materials-Handling Accidents
- Eliminate all unnecessary transport and handling operations. Because many transport and handling processes are inherently dangerous, it is useful to consider whether some materials handling might be eliminated. Many modern manufacturing processes can be arranged in a continuous flow without any separate handling and transport phases. Many assembly and construction operations can be planned and designed to eliminate strenuous and complex movements of loads. Options for more effective and rational transport can also be found by analysing logistics and material flow in the manufacturing and transport processes.
- Remove human beings from the transport and handling space. When workers are not physically located under or in the vicinity of loads to be moved, safety conditions are ipso facto improved because of reduced exposure to hazards. People are not allowed to work in the scrap-handling area of steelworks because pieces of scrap may drop from the magnetic grippers that are used to move the scrap, presenting a continuous hazard of falling loads. Materials handling in harsh environments can often be automated by using robots and automatic trucks, an arrangement that reduces the accident risks posed to workers by moving loads. Moreover, by forbidding people to go unnecessarily through loading and unloading yards, exposure to several types of materials-handling hazards is basically eliminated.
- Segregate transport operations from each other as much as possible to minimize encounters.The more frequently vehicles encounter one another, other equipment and people, the greater is the probability of collisions. Segregation of transport operations is important when planning for safe in-plant transport. There are many segregations to be considered, such as pedestrians/vehicles; heavy traffic/light traffic; internal traffic/traffic to and from outside; transport between workplaces/materials handling within a workplace; transport/storage; transport/production line; receiving/shipping; hazardous materials transportation/normal transport. When spatial segregation is not practicable, specific times can be allocated when transport and pedestrians respectively are allowed to enter a work area (e.g., in a warehouse open to the public). If separate pathways cannot be arranged for pedestrians, their routes can be designated by markings and signs. When entering a factory building, employees should be able to use separate pedestrian doors. If pedestrian traffic and fork-lift truck traffic are mixed in doorways, they also tend to be mixed beyond the doorways, thus presenting a hazard. During plant modifications, it is often necessary to limit transport and human motion through the areas which are under repair or construction. In overhead crane transport, collisions can be avoided by seeing to it that the tracks of the cranes do not overlap and by installing limit switches and mechanical barriers.
- Provide enough space for materials-handling and transport operations. Too narrow a space for materials handling is often a cause of accidents. For example, workers’ hands can be caught between a load and a wall in manual handling, or a person may be pinned between a moving pillar of a transport crane and a stack of materials when the minimum safety distance of 0.5 m is not available. The space needed for transport and handling operations should be carefully considered in plant design and planning of modifications. It is advisable to reserve some “safety margin” of space in order to accommodate future changes in load dimensions and types of equipment. Often, the volume of the products being manufactured tends to grow as time goes on, but the space in which to handle them becomes smaller and smaller. Although the demand for cost-effective space utilization may be a reason for minimizing production space, it should be borne in mind that the manoeuvring space needed for counterbalanced fork-lift trucks to turn and to backtrack is larger than it seems to be at first sight.
- Aim at continuous transport processes, avoiding points of discontinuity in materials handling. Continuous material flows reduce the potential for accidents. The basic arrangement of a plant layout is of crucial importance in carrying out this safety principle. Accidents concentrate in places where the material flow is interrupted because the moving and handling equipment is changed, or for production reasons. Human intervention is often required to unload and reload, to fasten, package, lift and drag, and so forth. Depending on the materials handled, conveyors generally give more continuous material flows than cranes or fork-lift trucks. It is good planning to arrange transport operations in such a way that motor vehicles can move in factory premises in a one-way circle, without any zigzag motion or backtracking. Because points of discontinuity tend to develop in boundary lines between departments or between working cells, production and transport should be planned to avoid such “no-man’s lands” with uncontrolled materials movement.
- Use standard elements in materials-handling systems. For safety purposes it is generally better to use standard items of loads, equipment and tools in materials handling. The concept of unit load is well-known to most transport professionals. Materials packed in containers and on pallets are easier to attach and move when the other elements in the transport chain (e.g., storage racks, fork-lift trucks, motor vehicles and fastening devices of cranes) are designed for these unit loads. The use of standard types of fork-lift trucks with similar controls decreases the probability of driver error, as accidents have occurred when a driver has changed from one sort of equipment to another with different controls.
- Know the materials to be handled. Knowledge of the characteristics of the materials to be transported is a precondition for safe transfer. In order to select appropriate lifting or load restraints, one must take into account the weight, centre of gravity and dimensions of goods that are to be fastened for lifting and transport. When hazardous materials are handled, it is necessary that information be available as to their reactivity, flammability and health hazards. Special hazards are presented in the case of items which are fragile, sharp, dusty, slippery, loose, or when handling explosive materials and living animals, for example. The packages often provide important information for workers as to proper handling methods, but sometimes labels are removed or protective packaging conceals important information. For example, it may not be possible to view the distribution of the contents within a package, with the result that one cannot properly assess the load’s centre of gravity.
- Keep the loading below the safe working-load capacity. Overloading is a common cause of damage in materials-handling systems. Loss of balance and material breakage are typical results of overloading handling equipment. The safe working load of slings and other lifting tackle should be clearly marked, and proper configurations of slings must be selected. Overloading can take place when the weight or the centre of gravity of the load is misjudged, leading to improper fastening and manoeuvring of loads. When slings are used to handle loads, the equipment operator should be aware that an inclined pathway may exert forces sufficient to cause the load to drop off or over-balance the equipment. The loading capacity of fork-lift trucks should be marked on the equipment; this varies according to the lifting height and the size of the load. Overloading due to fatigue failure may occur under repeated loadings well below the ultimate breaking load if the component is not correctly designed against this type of failure.
- Set the speed limits low enough to maintain safe movement. Speed limits for vehicles moving in workplaces vary from 10 km/h to 40 km/h (about 5 to 25 mph). Lower speeds are required in inside corridors, in doorways, at crossings and in narrow aisles. A competent driver can adapt a vehicle’s speed according to the demands of each situation, but signs notifying drivers of speed limitations are advisable at critical places. The maximum speed of a remote-controlled mobile crane, for example, must be determined first by fixing a vehicle speed comparable to a reasonable walking speed for a human, and then allowing for the time needed for simultaneous observations and control of loads so as not to exceed the response time of the human operator.
- Avoid overhead lifting in areas where people are working underneath. Overhead lifting of materials always poses a risk of falling loads. Although people are ordinarily not allowed to work under hanging loads, the routine transportation of loads over people in production can expose them to danger. Fork-lift transport to high storage racks and lifting between floors are further examples of overhead lifting tasks. Overhead conveyors transporting stones, coke or casts may also constitute a risk of falling loads for those walking underneath if protective covers are not installed. In considering a new overhead transport system, the potential greater risks should be compared with the lesser risks associated with a floor-level transport system.
- Avoid materials-handling methods that require climbing and working at high levels. When people have to climb up—for example, to unfasten sling hooks, to adjust a vehicle’s canopy or to make markings on loads—they risk falling. This hazard can often be averted by better planning, by changing the sequence of work, by using various lifting accessories and remote-controlled tools, or by mechanization and automation.
- Attach guards at danger points. Guards should be installed on danger points in materials-handling equipment such as the chains of fork-lift trucks, the rope drives of cranes and the trapping points of conveyors. Out-of-reach protection is often not enough, because the hazard point may be reached by using ladders and other means. Guards are also used to protect against technical failures that could lead to injuries (e.g., of wire rope retainers on crane sheaves, safety latches in lifting hooks and the protection pads of textile slings that shield against sharp edges). Guardrails and toeboards installed against the edges of loading platforms and overhead storage racks, and around floor openings, can protect both people and things from falling. This sort of protection is often needed when fork-lift trucks and cranes lift materials from one floor to another. People can be protected from falling objects in materials-handling operations by safety nets and permanent guards such as wire mesh or metal plate covers on conveyors.
- Transport and lift people only by the equipment designed for the purpose. Cranes, fork-lift trucks, excavators and conveyors are machines for moving materials, not human beings, from one place to another. Special lifting platforms are available to lift persons, for example, to change lamps on ceilings. If a crane or a fork-lift truck is equipped with a special cage which can be securely attached to the equipment and which meets proper safety requirements, persons can be lifted without an excessive risk of severe injury.
- Keep equipment and loads stable. Accidents happen when equipment, goods or storage racks lose their stability, especially in the case of fork-lift trucks or mobile cranes. The selection of actively stable equipment is a first step to reduce hazards. Further, it is advisable to use equipment that emits a warning signal before the limit of collapse is reached. Good working practices and qualified operators are the next stops of prevention. Experienced and trained employees are able to estimate centres of gravity and recognize unstable conditions where materials are piled and stacked, and to make the necessary adjustments.
- Provide good visibility. Visibility is always limited when handling materials with fork-lift trucks. When new equipment is purchased, it is important to assess how much the driver can see through the mast structures (and, for high-lifting trucks, the visibility through the overhead frame). In any case, the materials handled cause some loss of visibility, and this effect should be considered. Whenever possible, a clear line of sight should be provided—for example, by removing piles of goods or by arranging openings or empty sections at critical points in racks. Mirrors can be applied to the equipment and at suitable locations in factories and warehouses to make blind corners safer. However, mirrors are a secondary means of prevention compared to the actual elimination of blind corners in order to allow direct vision. In crane transport it is often necessary to assign a special signal person to check that the area where the load will be lowered is unoccupied by people. A good safety practice is to paint or otherwise mark danger points and obstructions in the working environment—for example, pillars, edges of doors and of loading docks, protruding machine elements and moving parts of equipment. Appropriate illumination can often improve visibility considerably—for example, on stairs, in corridors and at exit doors.
- Eliminate manual lifting and carrying of loads by mechanical and automated handling. About 15% of all work-related injuries involve the manual lifting and carrying of loads. Most of the injuries are due to over-exertion; the rest are slips and falls and hand injuries inflicted by sharp edges. Cumulative trauma disorders and back disorders are typical health problems due to manual-handling work. Although mechanization and automation have eliminated manual-handling tasks to a large extent in industry, there still exist a number of workplaces where people are physically overloaded by lifting and carrying heavy loads. Consideration should be given to providing appropriate handling equipment—for example, hoists, lifting platforms, elevators, fork-lift trucks, cranes, conveyors, palletizers, robots and mechanical manipulators.
- Provide and maintain effective communication. A common factor in serious accidents is a failure in communication. A crane driver must communicate with a slinger, who fastens the load, and if the hand signs between the driver and the loader are incorrect or radio phones have a low audibility, critical errors may result. Communication links are important between materials-handling operators, production people, loaders, dock workers, equipment drivers and maintenance people. For instance, a fork-lift truck driver has to pass along information about any safety problems encountered—for example, aisles with blind corners due to stacks of material—when turning over the truck to the next driver during shift change. Drivers of motor vehicles and mobile cranes working as contractors in a workplace are often unfamiliar with the particular risks they may encounter, and should therefore receive special guidance or training. This may include providing a map of the factory premises at the access gate together with the essential safe work and driving instructions. Traffic signs for workplace traffic are not as highly developed as the those for public roads. However, many of the risks encountered in road traffic are common within factory premises, too. It is therefore important to provide appropriate traffic signs for internal traffic in order to facilitate the communication of hazard warnings and to alert drivers to whatever precautions may be required.
- Arrange the human interfaces and the manual handling according to ergonomic principles. Materials-handling work should be accommodated to the capacity and skills of people by applying ergonomics so as to obviate errors and improper straining. The controls and displays of cranes and fork-lift trucks should be compatible with the natural expectations and habits of people. In manual handling it is important to make sure that there is enough space for the human motions necessary to carry out the tasks. Furthermore, excessively strenuous working postures should be avoided—for example, manually lifting loads over one’s head, and not exceeding the maximum permissible weights for manual lifting. Individual variations in age, strength, health status, experience and anthropometric considerations may require modification of the workspace and tasks accordingly. Order picking in storage facilities is an example of a task in which ergonomics is of utmost importance for safety and productivity.
- Provide adequate training and advice. Materials-handling tasks are often regarded as too low-status to warrant any special training for the workforce. The number of specialized crane operators and fork-lift drivers is decreasing at workplaces; and there is a growing tendency to make crane and fork-lift truck driving a job that almost anybody in a workplace should be prepared to do. Although hazards can be reduced by technical and ergonomic measures, it is the skill of the operator that is ultimately decisive in averting hazardous situations in dynamic work settings. Accident surveys have indicated that many of the victims in materials-handling accidents are people not involved in materials-handling tasks themselves. Therefore, training should also be provided to some extent for bystanders in the materials-handling areas.
- Supply the people working in transport and handling with appropriate personal outfits. Several types of injuries can be prevented by using appropriate personal protective equipment. Safety shoes which do not cause slips and falls, heavy gloves, safety glasses or goggles, and hard hats are typical personal protectors worn for materials-handling tasks. When special hazards demand it, fall protection, respirators and special safety garments are used. Appropriate working gear for materials handling should provide good visibility and should not include parts that may easily be caught on equipment or gripped by moving parts.
- Carry out proper maintenance and inspection duties. When accidents happen because of failures in equipment, the reasons are often to be found in poor maintenance and inspection procedures. Instructions for maintenance and inspections are given in safety standards and in manufacturers’ manuals. Deviations from the given procedures can lead to dangerous situations. Material-handling equipment users are responsible for daily maintenance and inspection routines involving such tasks as checking batteries, rope and chain drives, lifting tackle, brakes and controls; cleaning windows; and adding oil when needed. More thorough, less frequent, inspections are carried out regularly, such as weekly, monthly, semi-annually or once a year, depending on the conditions of use. Housekeeping, including adequate cleaning of floors and workplaces, is also important for safe materials handling. Oily and wet floors cause people and trucks to slip. Broken pallets and storage racks should be discarded whenever observed. In operations involving the transporting of bulk materials by conveyors it is important to remove accumulations of dust and grain in order to prevent dust explosions and fires.
- Plan for changes in the environmental conditions. The capacity to adapt to varying environmental conditions is limited among equipment and people alike. Fork-lift truck operators need several seconds to adapt themselves when driving from a gloomy hall through doorways to a sunlit yard outside, and when moving inside from outdoors. To make these operations safer, special lighting arrangements can be set up at doorways. In the outdoors, cranes are often subjected to high wind loads, which have to be taken into account during lifting operations. In extreme wind conditions, lifting with cranes must be interrupted entirely. Ice and snow may cause considerable extra work for workers who have to clean the surfaces of loads. Sometimes, this also means taking extra risks; for instance, when the work is done upon the load or even under the load during lifting. Planning should cover safe procedures for these tasks, too. An icy load may glide away from a pallet fork during a forklift transport. Corrosive atmospheres, heat, frost conditions and seawater can cause degradation of materials and subsequent failures if the materials are not designed to withstand such conditions.
Confined Spaces
Confined spaces are ubiquitous throughout industry as recurring sites of both fatal and nonfatal accidents. The term confined space traditionally has been used to label particular structures, such as tanks, vessels, pits, sewers, hoppers and so on. However, a definition based on description in this manner is overly restrictive and defies ready extrapolation to structures in which accidents have occurred. Potentially any structure in which people work could be or could become a confined space. Confined spaces can be very large or they can be very small. What the term actually describes is an environment in which a broad range of hazardous conditions can occur. These condition include personal confinement, as well as structural, process, mechanical, bulk or liquid material, atmospheric, physical, chemical, biological, safety and ergonomic hazards. Many of the conditions produced by these hazards are not unique to confined spaces but are exacerbated by involvement of the boundary surfaces of the confined space.
Confined spaces are considerably more hazardous than normal workspaces. Seemingly minor alterations in conditions can immediately change the status of these workspaces from innocuous to life-threatening. These conditions may be transient and subtle, and therefore are difficult to recognize and to address. Work involving confined spaces generally occurs during construction, inspection, maintenance, modification and rehabilitation. This work is nonroutine, short in duration, nonrepetitive and unpredictable (often occurring during off-shift hours or when the unit is out of service).
Confined Space Accidents
Accidents involving confined spaces differ from accidents that occur in normal workspaces. A seemingly minor error or oversight in preparation of the space, selection or maintenance of equipment or work activity can precipitate an accident. This is because the tolerance for error in these situations is smaller than for normal workplace activity.
The occupations of victims of confined space accidents span the occupational spectrum. While most are workers, as might be expected, victims also include engineering and technical people, supervisors and managers, and emergency response personnel. Safety and industrial hygiene personnel also have been involved in confined space accidents. The only data on accidents in confined spaces are available from the United States, and these cover only fatal accidents (NIOSH 1994). Worldwide, these accidents claim about 200 victims per year in industry, agriculture and the home (Reese and Mills 1986). This is at best a guess based on incomplete data, but it appears to be applicable today. About two-thirds of the accidents resulted from hazardous atmospheric conditions in the confined space. In about 70% of these the hazardous condition existed prior to entry and the start of work. Sometimes these accidents cause multiple fatalities, some of which are the result of the original incident and a subsequent attempt at rescue. The highly stressful conditions under which the rescue attempt occurs often subject the would-be rescuers to considerably greater risk than the initial victim.
The causes and outcomes of accidents involving work external to structures that confine hazardous atmospheres are similar to those occurring inside confined spaces. Explosion or fire involving a confined atmosphere caused about half of the fatal welding and cutting accidents in the United States. About 16% of these accidents involved “empty” 205 l (45 gal UK, 55 gal US) drums or containers (OSHA 1988).
Identification of Confined Spaces
A review of fatal accidents in confined spaces indicates that the best defences against unnecessary encounters are an informed and trained workforce and a programme for hazard recognition and management. Development of skills to enable supervisors and workers to recognize potentially hazardous conditions is also essential. One contributor to this programme is an accurate, up-to-date inventory of confined spaces. This includes type of space, location, characteristics, contents, hazardous conditions and so on. Confined spaces in many circumstances defy being inventoried because their number and type are constantly changing. On the other hand, confined spaces in process operations are readily identifiable, yet remain closed and inaccessible almost all of the time. Under certain conditions, a space may be considered a confined space one day and would not be considered a confined space the next.
A benefit from identifying confined spaces is the opportunity to label them. A label can enable workers to relate the term confined space to equipment and structures at their work location. The downside to the labelling process includes: (1) the label could disappear into a landscape filled with other warning labels; (2) organizations that have many confined spaces could experience great difficulty in labelling them; (3) labelling would produce little benefit in circumstances where the population of confined spaces is dynamic; and (4) reliance on labels for identification causes dependence. Confined spaces could be overlooked.
Hazard Assessment
The most complex and difficult aspect in the confined space process is hazard assessment. Hazard assessment identifies both hazardous and potentially hazardous conditions and assesses the level and acceptability of risk. The difficulty with hazard assessment occurs because many of the hazardous conditions can produce acute or traumatic injury, are difficult to recognize and assess, and often change with changing conditions. Hazard elimination or mitigation during preparation of the space for entry, therefore, is essential for minimizing the risk during work.
Hazard assessment can provide a qualitative estimate of the level of concern attached to a particular situation at a particular moment (table 1). The breadth of concern within each category ranges from minimal to some maximum. Comparison between categories is not appropriate, since the maximum level of concern can differ considerably.
Table 1. Sample form for assessment of hazardous conditions
|
Hazardous condition |
Real or potential consequence |
||
|
Low |
Moderate |
High |
|
|
Hot work |
|||
|
Atmospheric hazards |
|||
|
oxygen deficiency |
|||
|
oxygen enrichment |
|||
|
chemical |
|||
|
biological |
|||
|
fire/explosion |
|||
|
Ingestion/skin contact |
|||
|
Physical agents |
|||
|
noise/vibration |
|||
|
heat/cold stress |
|||
|
non/ionizing radiation |
|||
|
laser |
|||
|
Personal confinement |
|||
|
Mechanical hazard |
|||
|
Process hazard |
|||
|
Safety hazards |
|||
|
structural |
|||
|
engulfment/immersion |
|||
|
entanglement |
|||
|
electrical |
|||
|
fall |
|||
|
slip/trip |
|||
|
visibility/light level |
|||
|
explosive/implosive |
|||
|
hot/cold surfaces |
|||
NA = not applicable. The meanings of certain terms such as toxic substance, oxygen deficiency, oxygen enrichment, mechanical hazard, and so on, require further specification according to standards that exist in a particular jurisdiction.
Each entry in table 1 can be expanded to provide detail about hazardous conditions where concern exists. Detail also can be provided to eliminate categories from further consideration where concern is non-existent.
Fundamental to the success of hazard recognition and assessment is the Qualified Person. The Qualified Person is deemed capable by experience, education and/or specialized training, of anticipating, recognizing and evaluating exposures to hazardous substances or other unsafe conditions and specifying control measures and/or protective actions. That is, the Qualified Person is expected to know what is required in the context of a particular situation involving work within a confined space.
A hazard assessment should be performed for each of the following segments in the operating cycle of the confined space (as appropriate): the undisturbed space, pre-entry preparation, pre-work inspection work activities (McManus, manuscript) and emergency response. Fatal accidents have occurred during each of these segments. The undisturbed space refers to the status quo established between closure following one entry and the start of preparation for the next. Pre-entry preparations are actions taken to render the space safe for entry and work. Pre-work inspection is the initial entry and examination of the space to ensure that it is safe for the start of work. (This practice is required in some jurisdictions.) Work activities are the individual tasks to be performed by entrants. Emergency response is the activity in the event rescue of workers is required, or other emergency occurs. Hazards that remain at the start of work activity or are generated by it dictate the nature of possible accidents for which emergency preparedness and response are required.
Performing the hazard assessment for each segment is essential because the focus changes continuously. For example, the level of concern about a specific condition could disappear following pre-entry preparation; however, the condition could reappear or a new one could develop as a result of an activity which occurs either inside or outside the confined space. For this reason, assessing a level of concern to a hazardous condition for all time based only on an appraisal of pre-opening or even opening conditions would be inappropriate.
Instrumental and other monitoring methods are used for determining the status of some of the physical, chemical and biological agents present in and around the confined space. Monitoring could be required prior to entry, during entry or during work activity. Lockout/tagout and other procedural techniques are used to deactivate energy sources. Isolation using blanks, plugs and caps, and double block and bleed or other valve configurations prevents entry of substances through piping. Ventilation, using fans and eductors, is often necessary to provide a safe environment for working both with and without approved respiratory protection. Assessment and control of other conditions relies on the judgement of the Qualified Person.
The last part of the process is the critical one. The Qualified Person must decide whether the risks associated with entry and work are acceptable. Safety can best be assured through control. If hazardous and potentially hazardous conditions can be controlled, the decision is not difficult to make. The less the level of perceived control, the greater the need for contingencies. The only other alternative is to prohibit the entry.
Entry Control
The traditional methods for managing on-site confined space activity are the entry permit and the on-site Qualified Person. Clear lines of authority, responsibility and accountability between the Qualified Person and entrants, standby personnel, emergency responders and on-site management are required under either system.
The function of an entry document is to inform and to document. Table 2 (below) provides a formal basis for performing the hazard assessment and documenting the results. When edited to include only information relevant to a particular circumstance, this becomes the basis for the entry permit or entry certificate. The entry permit is most effective as a summary that documents actions performed and indicates by exception, the need for further precautionary measures. The entry permit should be issued by a Qualified Person who also has the authority to cancel the permit should conditions change. The issuer of the permit should be independent of the supervisory hierarchy in order to avoid potential pressure to speed the performance of work. The permit specifies procedures to be followed as well as conditions under which entry and work can proceed, and records test results and other information. The signed permit is posted at the entry or portal to the space or as specified by the company or regulatory authority. It remains posted until it is either cancelled, replaced by a new permit or the work is completed. The entry permit becomes a record upon completion of the work and must be retained for recordkeeping according to requirements of the regulatory authority.
The permit system works best where hazardous conditions are known from previous experience and control measures have been tried and proven effective. The permit system enables expert resources to be apportioned in an efficient manner. The limitations of the permit arise where previously unrecognized hazards are present. If the Qualified Person is not readily available, these can remain unaddressed.
The entry certificate provides an alternative mechanism for entry control. This requires an onsite Qualified Person who provides hands-on expertise in the recognition, assessment and evaluation, and control of hazards. An added advantage is the ability to respond to concerns on short notice and to address unanticipated hazards. Some jurisdictions require the Qualified Person to perform a personal visual inspection of the space prior to the start of work. Following evaluation of the space and implementation of control measures, the Qualified Person issues a certificate describing the status of the space and conditions under which the work can proceed (NFPA 1993). This approach is ideally suited to operations that have numerous confined spaces or where conditions or the configuration of spaces can undergo rapid change.
Table 2. A sample entry permit
ABC COMPANY
CONFINED SPACE—ENTRY PERMIT
1. DESCRIPTIVE INFORMATION
Department:
Location:
Building/Shop:
Equipment/Space:
Part:
Date: Assessor:
Duration: Qualification:
2. ADJACENT SPACES
Space:
Description:
Contents:
Process:
3. PRE-WORK CONDITIONS
Atmospheric Hazards
Oxygen Deficiency ![]() Yes
Yes ![]() No
No ![]() Controlled
Controlled
Concentration: (Acceptable minimum: %)
Oxygen Enrichment ![]() Yes
Yes ![]() No
No ![]() Controlled
Controlled
Concentration: (Acceptable maximum: %)
Chemical ![]() Yes
Yes ![]() No
No ![]() Controlled
Controlled
Substance Concentration (Acceptable standard: )
Biological ![]() Yes
Yes ![]() No
No ![]() Controlled
Controlled
Substance Concentration (Acceptable standard: )
Fire/Explosion ![]() Yes
Yes ![]() No
No ![]() Controlled
Controlled
Substance Concentration (Acceptable maximum: % LFL)
Ingestion/Skin Contact Hazard ![]() Yes
Yes ![]() No
No ![]() Controlled
Controlled
Physical Agents
Noise/Vibration ![]() Yes
Yes ![]() No
No ![]() Controlled
Controlled
Level: (Acceptable maximum: dBA)
Heat/Cold Stress ![]() Yes
Yes ![]() No
No ![]() Controlled
Controlled
Temperature: (Acceptable range: )
Non/Ionizing Radiation ![]() Yes
Yes ![]() No
No ![]() Controlled
Controlled
Type Level (Acceptable maximum: )
Laser ![]() Yes
Yes ![]() No
No ![]() Controlled
Controlled
Type Level (Acceptable maximum: )
Personal Confinement
(Refer to corrective action.) ![]() Yes
Yes ![]() No
No ![]() Controlled
Controlled
Mechanical Hazard
(Refer to procedure.) ![]() Yes
Yes ![]() No
No ![]() Controlled
Controlled
Process Hazard
(Refer to procedure.) ![]() Yes
Yes ![]() No
No ![]() Controlled
Controlled
ABC COMPANY
CONFINED SPACE—ENTRY PERMIT
Safety Hazards
Structural Hazard
(Refer to corrective action.) ![]() Yes
Yes ![]() No
No ![]() Controlled
Controlled
Engulfment/Immersion
(Refer to corrective action.) ![]() Yes
Yes ![]() No
No ![]() Controlled
Controlled
Entanglement
(Refer to corrective action.) ![]() Yes
Yes ![]() No
No ![]() Controlled
Controlled
Electrical
(Refer to procedure.) ![]() Yes
Yes ![]() No
No ![]() Controlled
Controlled
Fall
(Refer to corrective action.) ![]() Yes
Yes ![]() No
No ![]() Controlled
Controlled
Slip/Trip
(Refer to corrective action.) ![]() Yes
Yes ![]() No
No ![]() Controlled
Controlled
Visibility/light level ![]() Yes
Yes ![]() No
No ![]() Controlled
Controlled
Level: (Acceptable range: lux)
Explosive/Implosive
(Refer to corrective action.) ![]() Yes
Yes ![]() No
No ![]() Controlled
Controlled
Hot/Cold Surfaces
(Refer to corrective action.) ![]() Yes
Yes ![]() No
No ![]() Controlled
Controlled
For entries in highlighted boxes, Yes or Controlled, provide additional detail and refer to protective measures. For hazards for which tests can be made, refer to testing requirements. Provide date of most recent calibration. Acceptable maximum, minimum, range or standard depends on the jurisdiction.
4. Work Procedure
Description:
Hot Work
(Refer to protective measure.) ![]() Yes
Yes ![]() No
No ![]() Controlled
Controlled
Atmospheric Hazard
Oxygen Deficiency
(Refer to requirement for additional testing. Record results.
Refer to requirement for protective measures.)
Concentration: ![]() Yes
Yes ![]() No
No ![]() Controlled
Controlled
(Acceptable minimum: %)
Oxygen Enrichment
(Refer to requirement for additional testing. Record results.
Refer to requirement for protective measures.)
Concentration: ![]() Yes
Yes ![]() No
No ![]() Controlled
Controlled
(Acceptable maximum: %)
Chemical
(Refer to requirement for additional testing. Record results. Refer to requirement
for protective measures.)
Substance Concentration ![]() Yes
Yes ![]() No
No ![]() Controlled
Controlled
(Acceptable standard: )
Biological
(Refer to requirement for additional testing. Record results. Refer to requirement
for protective measures.)
Substance Concentration ![]() Yes
Yes ![]() No
No ![]() Controlled
Controlled
(Acceptable standard: )
Fire/Explosion
(Refer to requirement for additional testing. Record results. Refer to requirement
for protective measures.)
Substance Concentration ![]() Yes
Yes ![]() No
No ![]() Controlled
Controlled
(Acceptable standard: )
Ingestion/Skin Contact Hazard ![]() Yes
Yes ![]() No
No ![]() Controlled
Controlled
(Refer to requirement for protective measures.)
ABC COMPANY
CONFINED SPACE—ENTRY PERMIT
Physical Agents
Noise/Vibration
(Refer to requirement for protective measures. Refer to requirement for
additional testing. Record results.)
Level: ![]() Yes
Yes ![]() No
No ![]() Controlled
Controlled
(Acceptable maximum: dBA)
Heat/Cold Stress
(Refer to requirement for protective measures. Refer to requirement for
additional testing. Record results.)
Temperature: ![]() Yes
Yes ![]() No
No ![]() Controlled
Controlled
(Acceptable range: )
Non/Ionizing Radiation
(Refer to requirement for protective measures. Refer to requirement for
additional testing. Record results.)
Type Level ![]() Yes
Yes ![]() No
No ![]() Controlled
Controlled
(Acceptable maximum: )
Laser
(Refer to requirement for protective measures.) ![]() Yes
Yes ![]() No
No ![]() Controlled
Controlled
Mechanical Hazard
(Refer to requirement for protective measures.) ![]() Yes
Yes ![]() No
No ![]() Controlled
Controlled
Process Hazard
(Refer to requirement for protective measures.) ![]() Yes
Yes ![]() No
No ![]() Controlled
Controlled
Safety Hazards
Structural Hazard
(Refer to requirement for protective measures.) ![]() Yes
Yes ![]() No
No ![]() Controlled
Controlled
Engulfment/Immersion
(Refer to requirement for protective measures.) ![]() Yes
Yes ![]() No
No ![]() Controlled
Controlled
Entanglement
(Refer to requirement for protective measures.) ![]() Yes
Yes ![]() No
No ![]() Controlled
Controlled
Electrical
(Refer to requirement for protective measures.) ![]() Yes
Yes ![]() No
No ![]() Controlled
Controlled
Fall
(Refer to requirement for protective measures.) ![]() Yes
Yes ![]() No
No ![]() Controlled
Controlled
Slip/Trip
(Refer to requirement for protective measures.) ![]() Yes
Yes ![]() No
No ![]() Controlled
Controlled
Visibility/light level
(Refer to requirement for protective measures.) ![]() Yes
Yes ![]() No
No ![]() Controlled
Controlled
Explosive/Implosive
(Refer to requirement for protective measures.) ![]() Yes
Yes ![]() No
No ![]() Controlled
Controlled
Hot/Cold Surfaces
(Refer to requirement for protective measures.) ![]() Yes
Yes ![]() No
No ![]() Controlled
Controlled
For entries in highlighted boxes, Yes or Possible, provide additional detail and refer to protective
measures. For hazards for which tests can be made, refer to testing requirements. Provide date of
most recent calibration.
Protective Measures
Personal protective equipment (specify)
Communications equipment and procedure (specify)
Alarm systems (specify)
Rescue Equipment (specify)
Ventilation (specify)
Lighting (specify)
Other (specify)
(Continues on next page)
ABC COMPANY
CONFINED SPACE—ENTRY PERMIT
Testing Requirements
Specify testing requirements and frequency
Personnel
Entry Supervisor
Originating Supervisor
Authorized Entrants
Testing Personnel
Attendants
Falls from Elevations
Falls from elevations are severe accidents that occur in many industries and occupations. Falls from elevations result in injuries which are produced by contact between the falling person and the source of injury, under the following circumstances:
- The motion of the person and the force of impact are generated by gravity.
- The point of contact with the source of injury is lower than the surface supporting the person at the start of the fall.
From this definition, it may be surmised that falls are unavoidable because gravity is always present. Falls are accidents, somehow predictable, occurring in all industrial sectors and occupations and having a high severity. Strategies to reduce the number of falls, or at least reduce the severity of the injuries if falls occur, are discussed in this article.
The Height of the Fall
The severity of injuries caused by falls is intrinsically related to the height of fall. But this is only partly true: the free-fall energy is the product of the falling mass times the height of the fall, and the severity of the injuries is directly proportional to the energy transferred during the impact. Statistics of fall accidents confirm this strong relationship, but show also that falls from a height of less than 3 m can be fatal. A detailed study of fatal falls in construction shows that 10% of the fatalities caused by falls occurred from a height less than 3 m (see figure 1). Two questions are to be discussed: the 3-m legal limit, and where and how a given fall was arrested.
Figure 1. Fatalities caused by falls and the height of fall in the US construction industry, 1985-1993

In many countries, regulations make fall protection mandatory when the worker is exposed to a fall of more than 3 m. The simplistic interpretation is that falls of less than 3 m are not dangerous. The 3-m limit is in fact the result of a social, political and practical consensus which says it is not mandatory to be protected against falls while working at the height of a single floor. Even if the 3-m legal limit for mandatory fall protection exists, fall protection should always be considered. The height of fall is not the sole factor explaining the severity of fall accidents and the fatalities due to falls; where and how the person falling came to rest must also be considered. This leads to analysis of the industrial sectors with higher incidence of falls from elevations.
Where Falls Occur
Falls from elevations are frequently associated with the construction industry because they account for a high percentage of all fatalities. For example, in the United States, 33% of all fatalities in construction are caused by falls from elevations; in the UK, the figure is 52%. Falls from elevations also occur in other industrial sectors. Mining and the manufacturing of transportation equipment have a high rate of falls from elevations. In Quebec, where many mines are steep, narrow-vein, underground mines, 20% of all accidents are falls from elevations. The manufacture, use and maintenance of transportation equipment such as airplanes, trucks and railroad cars are activities with a high rate of fall accidents (table 1). The ratio will vary from country to country depending on the level of industrialization, the climate, and so on; but falls from elevations do occur in all sectors with similar consequences.
Table 1. Falls from elevations: Quebec 1982-1987
Falls from elevations Falls from elevations in all accidents
per 1,000 workers
Construction 14.9 10.1%
Heavy industry 7.1 3.6%
Having taken into consideration the height of fall, the next important issue is how the fall is arrested. Falling into hot liquids, electrified rails or into a rock crusher could be fatal even if the height of fall is less than 3 m.
Causes of Falls
So far it has been shown that falls occur in all economic sectors, even if the height is less than 3 m. But why do humans fall? There are many human factors which can be involved in falling. A broad grouping of factors is both conceptually simple and useful in practice:
Opportunities to fall are determined by environmental factors and result in the most common type of fall, namely the tripping or slipping that result in falls from grade level. Other falling opportunities are related to activities above grade.
Liabilities to fall are one or more of the many acute and chronic diseases. The specific diseases associated with falling usually affect the nervous system, the circulatory system, the musculoskeletal system or a combination of these systems.
Tendencies to fall arise from the universal, intrinsic deteriorative changes that characterize normal ageing or senescence. In falling, the ability to maintain upright posture or postural stability is the function that fails as a result of combined tendencies, liabilities and opportunities.
Postural Stability
Falls are caused by the failure of postural stability to maintain a person in an upright position. Postural stability is a system consisting of many rapid adjustments to external, perturbing forces, especially gravity. These adjustments are largely reflex actions, subserved by a large number of reflex arcs, each with its sensory input, internal integrative connections, and motor output. Sensory inputs are: vision, the inner ear mechanisms that detect position in space, the somatosensory apparatus that detects pressure stimuli on the skin, and the position of the weight-bearing joints. It appears that visual perception plays a particularly important role. Very little is known about the normal, integrative structures and functions of the spinal cord or the brain. The motor output component of the reflex arc is muscular reaction.
Vision
The most important sensory input is vision. Two visual functions are related to postural stability and control of gait:
- the perception of what is vertical and what is horizontal is basic to spatial orientation
- the ability to detect and discriminate objects in cluttered environments.
Two other visual functions are important:
- the ability to stabilize the direction in which the eyes are pointed so as to stabilize the surrounding world while we are moving and immobilize a visual reference point
- the ability to fixate and pursue definite objects within the large field (“keep an eye on”); this function requires considerable attention and results in deterioration in the performance of any other simultaneous, attention-demanding tasks.
Causes of postural instability
The three sensory inputs are interactive and interrelated. The absence of one input—and/or the existence of false inputs—results in postural instability and even in falls. What could cause instability?
Vision
- the absence of vertical and horizontal references—for example, the connector at the top of a building
- the absence of stable visual references—for example, moving water under a bridge and moving clouds are not stable references
- the fixing a definite object for work purposes, which diminishes other visual functions, such as the ability to detect and discriminate objects that can cause tripping in a cluttered environment
- a moving object in a moving background or reference—for example, a structural steel component moved by a crane, with moving clouds as background and visual reference.
Inner ear
- having the person’s head upside down while the level equilibrium system is at its optimum performance horizontally
- travelling in pressurized aircraft
- very fast movement, as, for example, in a roller-coaster
- diseases.
Somatosensory apparatus (pressure stimuli on the skin and position of weight-bearing joints)
- standing on one foot
- numbed limbs from staying in a fixed position for a long period of time—for example, kneeling down
- stiff boots
- very cold limbs.
Motor output
- numbed limbs
- tired muscles
- diseases, injuries
- ageing, permanent or temporary disabilities
- bulky clothing.
Postural stability and gait control are very complex reflexes of the human being. Any perturbations of the inputs may cause falls. All perturbations described in this section are common in the workplace. Therefore, falling is somehow natural and prevention must therefore prevail.
Strategy for Fall Protection
As previously noted, the risks of falls are identifiable. Therefore, falls are preventable. Figure 2 shows a very common situation where a gauge must be read. The first illustration shows a traditional situation: a manometer is installed at the top of a tank without means of access In the second, the worker improvises a means of access by climbing on several boxes: a hazardous situation. In the third, the worker uses a ladder; this is an improvement. However, the ladder is not permanently fixed to the tank; it is therefore probable that the ladder may be in use elsewhere in the plant when a reading is required. A situation such as this is possible, with fall arrest equipment added to the ladder or the tank and with the worker wearing a full body harness and using a lanyard attached to an anchor. The fall-from-elevation hazard still exists.
Figure 2. Installations for reading a gauge
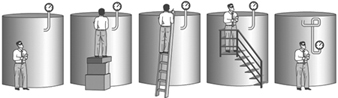
In the fourth illustration, an improved means of access is provided using a stairway, a platform and guardrails; the benefits are a reduction in the risk of falling and an increase in the ease of reading (comfort), thus reducing the duration of each reading and providing a stable work posture allowing for a more precise reading.
The correct solution is illustrated in the last illustration. During the design stage of the facilities, maintenance and operation activities were recognized. The gauge was installed so that it could be read at ground level. No falls from elevations are possible: therefore, the hazard is eliminated.
This strategy puts the emphasis on the prevention of falls by using the proper means of access (e.g., scaffolds, ladders, stairways) (Bouchard 1991). If the fall cannot be prevented, fall arrest systems must be used (figure 3). To be effective, fall arrest systems must be planned. The anchorage point is a key factor and must be pre-engineered. Fall arrest systems must be efficient, reliable and comfortable; two examples are given in Arteau, Lan and Corbeil (to be published) and Lan, Arteau and Corbeil (to be published). Examples of typical fall prevention and fall arrest systems are given in table 2. Fall arrest systems and components are detailed in Sulowski 1991.
Figure 3. Fall prevention strategy
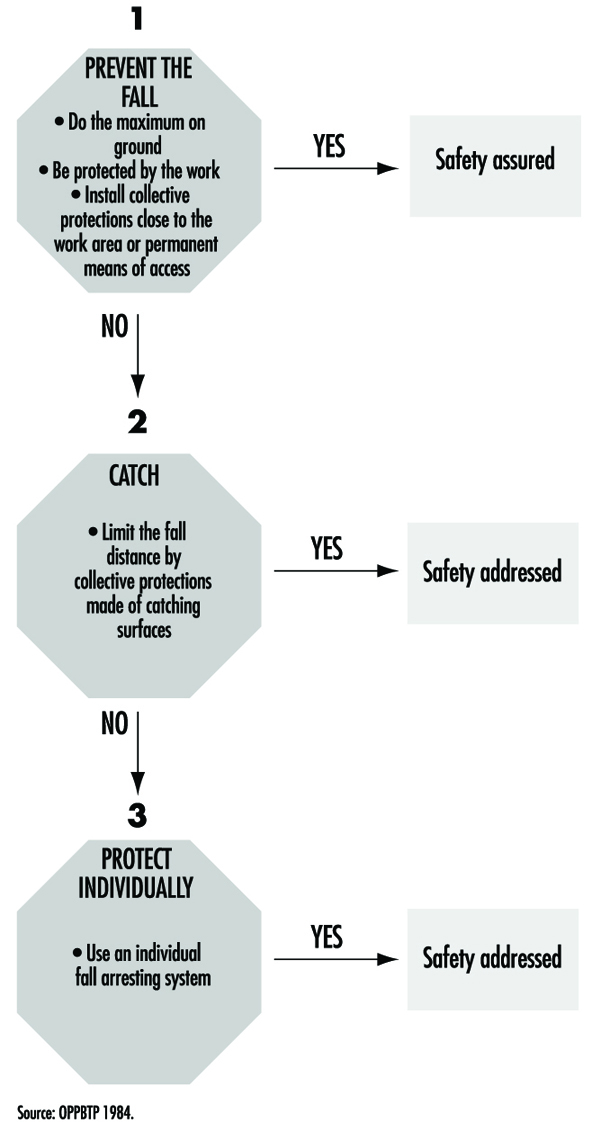
Table 2. Typical fall prevention and fall arrest systems
|
Fall prevention systems |
Fall arrest systems |
|
|
Collective protection |
Guardrails Railings |
Safety net |
|
Individual protection |
Travel restricting system (TRS) |
Harness, lanyard, energy absorber anchorage, etc. |
The emphasis on prevention is not an ideological choice, but rather a practical choice. Table 3 shows the differences between fall prevention and fall arrest, the traditional PPE solution.
Table 3. Differences between fall prevention and fall arrest
|
Prevention |
Arrest |
|
|
Fall occurrence |
No |
Yes |
|
Typical equipment |
Guardrails |
Harness, lanyard, energy absorber and anchorage (fall arrest system) |
|
Design load (force) |
1 to 1.5 kN applied horizontally and 0.45 kN applied vertically—both at any point on the upper rail |
Minimum breaking strength of the anchorage point 18 to 22 kN |
|
Loading |
Static |
Dynamic |
For the employer and the designer, it is easier to build fall prevention systems because their minimum breaking strength requirements are 10 to 20 times less than those of fall arrest systems. For example, the minimum breaking strength requirement of a guard rail is around 1 kN, the weight of a large man, and the minimum breaking strength requirement of the anchorage point of an individual fall arrest system could be 20 kN, the weight of two small cars or 1 cubic metre of concrete. With prevention, the fall does not occur, so the risk of injury does not exist. With fall arrest, the fall does occur and even if arrested, a residual risk of injury exists.
Rollover
Tractors and other mobile machinery in agricultural, forestry, construction and mining work, as well as materials handling, can give rise to serious hazards when the vehicles roll over sideways, tip over forwards or rear over backwards. The risks are heightened in the case of wheeled tractors with high centres of gravity. Other vehicles that present a hazard of rollover are crawler tractors, loaders, cranes, fruit-pickers, dozers, dumpers, scrapers and graders. These accidents usually happen too fast for drivers and passengers to get clear of the equipment, and they can become trapped under the vehicle. For example, tractors with high centres of gravity have considerable likelihood of rollover (and narrow tractors have even less stability than wide ones). A mercury engine cut-off switch to shut off power upon sensing lateral movement was introduced on tractors but was proven too slow to cope with the dynamic forces generated in the rollover movement (Springfeldt 1993). Therefore the safety device was abandoned.
The fact that such equipment often is used on sloping or uneven ground or on soft earth, and sometimes in close proximity to ditches, trenches or excavations, is an important contributing cause to rollover. If auxiliary equipment is attached high up on a tractor, the probability of rearing over backwards in climbing a slope (or tipping over forwards when descending) increases. Furthermore, a tractor can roll over because of the loss of control due to the pressure exerted by tractor-drawn equipment (e.g., when the carriage moves downwards on a slope and the attached equipment is not braked and over-runs the tractor). Special hazards arise when tractors are used as tow vehicles, particularly if the tow hook on the tractor is placed on a higher level than the wheel axle.
History
Notice of the rollover problem was taken on the national level in certain countries where many fatal rollovers occurred. In Sweden and New Zealand, development and testing of rollover protective structures (ROPS) on tractors (figure 1) already were in progress in the 1950s, but this work was followed up by regulations only on the part of the Swedish authorities; these regulations were effective from the year 1959 (Springfeldt 1993).
Figure 1. Usual types of ROPS on tractors

Proposed regulations prescribing ROPS for tractors were met by resistance in the agricultural sector in several countries. Strong opposition was mounted against plans requiring employers to install ROPS on existing tractors, and even against the proposal that only new tractors be equipped by the manufacturers with ROPS. Eventually many countries successfully mandated ROPS for new tractors, and later on some countries were able to require ROPS be retrofitted on old tractors as well. International standards concerning tractors and earth-moving machinery, including testing standards for ROPS, contributed to more reliable designs. Tractors were designed and manufactured with lower centres of gravity and lower-placed tow hooks. Four-wheel drive has reduced the risk of rollover. But the proportion of tractors with ROPS in countries with many old tractors and without mandates for retrofitting of ROPS is still rather low.
Investigations
Rollover accidents, particularly those involving tractors, have been studied by researchers in many countries. However, there are no centralized international statistics with respect to the number of accidents caused by the types of mobile machinery reviewed in this article. Available statistics at the national level nevertheless show that the number is high, especially in agriculture. According to a Scottish report of tractor rollover accidents in the period 1968–1976, 85% of the tractors involved had equipment attached at the time of the accident, and of these, half had trailed equipment and half had mounted equipment. Two-thirds of the tractor rollover accidents in the Scottish report occurred on slopes (Springfeldt 1993). It was later proved that the number of accidents would be reduced after the introduction of training for driving on slopes as well as the application of an instrument for measuring slope steepness combined with an indicator of safe slope limits.
In other investigations, New Zealand researchers observed that half of their fatal rollover accidents occurred on flat ground or on slight slopes, and only one-tenth occurred on steep slopes. On flat ground tractor drivers may be less attentive to rollover hazards, and they can misjudge the risk posed by ditches and uneven ground. Of the rollover fatalities in tractors in New Zealand in the period 1949–1980, 80% occurred in wheel tractors, and 20% with crawler tractors (Springfeldt 1993). Studies in Sweden and New Zealand showed that about 80% of the tractor rollover fatalities occurred when tractors rolled over sideways. Half of the tractors involved in the New Zealand fatalities had rolled 180°.
Studies of the correlation between rollover fatalities in West Germany and the model year of farm tractors (Springfeldt 1993) showed that 1 of 10,000 old, unprotected tractors manufactured before 1957 was involved in a rollover fatality. Of tractors with prescribed ROPS, manufactured in 1970 and later, 1 of 25,000 tractors was involved in a rollover fatality. Of fatal tractor rollovers in West Germany in the period 1980–1985, two-thirds of the victims were thrown from their protected area and then run over or hit by the tractor (Springfeldt 1993). Of nonfatal rollovers, one-quarter of the drivers were thrown from the driver’s seat but not run over. It is evident that the fatality risk increases if the driver is thrown out of the protected area (similar to automobile accidents). Most of the tractors involved had a two-pillar bow (figure 1 C) that does not prevent the driver from being thrown out. In a few cases the ROPS had been subject to breakage or strong deformation.
The relative frequencies of injuries per 100,000 tractors in different periods in some countries and the reduction of the fatality rate was calculated by Springfeldt (1993). The effectiveness of ROPS in diminishing injury in tractor rollover accidents has been proven in Sweden, where the number of fatalities per 100,000 tractors was reduced from approximately 17 to 0.3 over the period of three decades (1960–1990) (figure 2). At the end of the period it was estimated that about 98% of the tractors were fitted with ROPS, mainly in the form of a crushproof cab (figure 1 A). In Norway, fatalities were reduced from about 24 to 4 per 100,000 tractors during a similar period. However, worse results were achieved in Finland and New Zealand.
Figure 2. Injuries by rollovers per 100,000 tractors in Sweden between 1957 and 1990
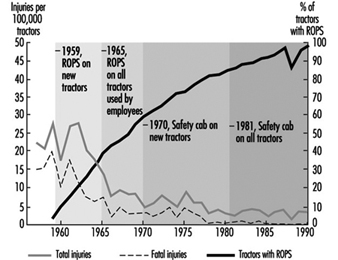
Prevention of Injuries by Rollovers
The risk of rollover is greatest in the case of tractors; however, in agricultural and forest work there is little that can be done to prevent tractors from rolling over. By mounting ROPS on tractors and those types of earth-moving machinery with potential rollover hazards, the risk of personal injuries can be reduced, provided that the drivers remain on their seats during rollover events (Springfeldt 1993). The frequency of rollover fatalities depends largely on the proportion of protected machines in use and the types of ROPS used. A bow (figure 1 C) gives much less protection than a cab or a frame (Springfeldt 1993). The most effective structure is a crushproof cab, which allows the driver to stay inside, protected, during a rollover. (Another reason for choosing a cab is that it affords weather protection.) The most effective means of keeping the driver within the protection of the ROPS during a rollover is a seat-belt, provided that the driver uses the belt while operating the equipment. In some countries, there are information plates at the driver’s seat advising that the steering wheel be gripped in a rollover event. An additional safety measure is to design the driver’s cab or interior environment and the ROPS so as to prevent exposure to hazards such as sharp edges or protuberances.
In all countries, rollovers of mobile machinery, mainly tractors, are causing serious injures. There are, however, considerable differences among countries concerning technical specifications relating to machinery design, as well as administrative procedures for examinations, testing, inspections and marketing. The international diversity that characterizes safety efforts in this connection may be explained by considerations such as the following:
- whether there exist mandatory requirements for ROPS (in the form of regulations or legislation), or recommendations only, or no rules at all
- the need for rules for new machinery and rules applicable to older equipment
- the availability of inspection carried out by authorities and the existence of social pressure and cultural climate favourable to observance of safety rules; in many countries, the obedience to safety guidelines is not checked by inspection in agricultural work
- pressure from trade unions; however, it should be borne in mind that workers’ organizations have less influence on working conditions in agriculture than in other sectors, because there are many family farms in agriculture
- the type of ROPS used in the country
- information and understanding of the risks to which tractor drivers are exposed; practical problems often stand in the way of reaching farmers and forest workers for the purposes of information and education
- the geography of the country, especially where agricultural, forestry and road work is carried out.
Safety Regulations
The nature of rules governing requirements for ROPS and the degree of implementation of the rules in a country, has a strong influence on rollover accidents, especially fatal ones. With this in mind, the development of safer machinery has been abetted by directives, codes and standards issued by international and national organizations. Additionally, many countries have adopted rigorous prescriptions for ROPS which have resulted in a great reduction of rollover injuries.
European Economic Community
Beginning in 1974 the European Economic Community (EEC) issued directives concerning type-approval of wheeled agricultural and forestry tractors, and in 1977 issued further, special directives concerning ROPS, including their attachment to tractors (Springfeldt 1993; EEC 1974, 1977, 1979, 1982, 1987). The directives prescribe a procedure for type-approval and certification by manufacture of tractors, and ROPS must be reviewed by an EEC Type Approval Examination. The directives have won acceptance by all the member countries.
Some EEC directives concerning ROPS on tractors were repealed as of 31 December 1995 and replaced by the general machinery directive which applies to those sorts of machinery presenting hazards due to their mobility (EEC 1991). Wheeled tractors, as well as some earth-moving machinery with a capacity exceeding 15 kW (namely crawlers and wheel loaders, backhoe loaders, crawler tractors, scrapers, graders and articulated dumpers) must be fitted with a ROPS. In case of a rollover, the ROPS must offer the driver and operators an adequate deflection-limiting volume (i.e., space allowing movement of occupants’ bodies before contacting interior elements during an accident). It is the responsibility of the manufacturers or their authorized representatives to perform appropriate tests.
Organization for Economic Cooperation and Development
In 1973 and 1987 the Organization for Economic Cooperation and Development (OECD) approved standard codes for testing of tractors (Springfeldt 1993; OECD 1987). They give results of tests of tractors and describe the testing equipment and test conditions. The codes require testing of many machinery parts and functions, for instance the strength of ROPS. The OECD Tractor Codes describe a static and a dynamic method of testing ROPS on certain types of tractors. A ROPS may be designed solely to protect the driver in the event of tractor rollover. It must be retested for each model of tractor to which the ROPS is to be fitted. The Codes also require that it be possible to mount a weather protection for the driver onto the structure, of a more or less temporary nature. The Tractor Codes have been accepted by all OECD member bodies from 1988, but in practice the United States and Japan also accept ROPS that do not comply with the code requirements if safety belts are provided (Springfeldt 1993).
International Labour Organization
In 1965, the International Labour Organization (ILO) in its manual, Safety and Health in Agricultural Work, required that a cab or a frame of sufficient strength be adequately fixed to tractors in order to provide satisfactory protection for the driver and passengers inside the cab in case of tractor rollover (Springfeldt 1993; ILO 1965). According to ILO Codes of Practice, agricultural and forestry tractors should be provided with ROPS to protect the operator and any passenger in case of rollover, falling objects or displaced loads (ILO 1976).
The fitting of ROPS should not adversely affect
- access between the ground and driver’s position
- access to the tractor’s main controls
- the manoeuvrability of the tractor in cramped surroundings
- the attachment or use of any equipment that may be connected to the tractor
- the control and adjustment of associated equipment.
International and national standards
In 1981 the International Organization for Standardization (ISO) issued a standard for tractors and machinery for agriculture and forestry (ISO 1981). The standard describes a static test method for ROPS and sets forth acceptance conditions. The standard has been approved by the member bodies in 22 countries; however, Canada and the United States have expressed disapproval of the document on technical grounds. A Standard and Recommended Practice issued in 1974 by the Society of Automotive Engineers (SAE) in North America contains performance requirements for ROPS on wheeled agricultural tractors and industrial tractors used in construction, rubber-tired scrapers, front-end loaders, dozers, crawler loaders, and motor graders (SAE 1974 and 1975). The contents of the standard have been adopted as regulations in the United States and in the Canadian provinces of Alberta and British Columbia.
Rules and Compliance
OECD Codes and International Standards concern the design and construction of ROPS as well as the control of their strength, but lack the authority to require that this sort of protection be put into practice (OECD 1987; ISO 1981). The European Economic Community also proposed that tractors and earth-moving machinery be equipped with protection (EEC 1974-1987). The aim of the EEC directives is to achieve uniformity among national entities concerning the safety of new machinery at the manufacturing stage. The member countries are obliged to follow the directives and issue corresponding prescriptions. Starting in 1996, the member countries of the EEC intend to issue regulations requiring that new tractors and earth-moving machinery be fitted with ROPS.
In 1959, Sweden became the first country to require ROPS for new tractors (Springfeldt 1993). Corresponding requirements came into effect in Denmark and Finland ten years later. Later on, in the 1970s and 1980s, mandatory requirements for ROPS on new tractors became effective in Great Britain, West Germany, New Zealand, the United States, Spain, Norway, Switzerland and other countries. In all these countries except the United States, the rules were extended to old tractors some years later, but these rules were not always mandatory. In Sweden, all tractors must be equipped with a protective cab, a rule that in Great Britain applies only to all tractors used by agricultural workers (Springfeldt 1993). In Denmark, Norway and Finland, all tractors must be provided with at least a frame, while in the United States and the Australian states, bows are accepted. In the United States tractors must have seat-belts.
In the United States, materials-handling machinery that was manufactured before 1972 and is used in construction work must be equipped with ROPS which meet minimum performance standards (US Bureau of National Affairs 1975). The machines covered by the requirement include some scrapers, front-end loaders, dozers, crawler tractors, loaders, and motor graders. Retrofitting was carried out of ROPS on machines manufactured about three years earlier.
Summary
In countries with mandatory requirements for ROPS for new tractors and retrofitting of ROPS on old tractors, there has been a decrease of rollover injuries, especially fatal ones. It is evident that a crushproof cab is the most effective type of ROPS. A bow gives poor protection in case of rollover. Many countries have prescribed effective ROPS at least on new tractors and as of 1996 on earth-moving machines. In spite of this fact some authorities seem to accept types of ROPS that do not comply with such requirements as have been promulgated by the OECD and the ISO. It is expected that a more general harmonization of the rules governing ROPS will be accomplished gradually all over the world, including the developing countries.
Technical Requirements for Safety-Related Systems Based on Electrical, Electronic and Programmable Electronic Devices
Machinery, process plants and other equipment can, if they malfunction, present risks from hazardous events such as fires, explosions, radiation overdoses and moving parts. One of the ways such plants, equipment and machinery can malfunction is from failures of electro-mechanical, electronic and programmable electronic (E/E/PE) devices used in the design of their control or safety systems. These failures can arise either from physical faults in the device (e.g., from wear and tear occurring randomly in time (random hardware failures)); or from systematic faults (e.g., errors made in the specification and design of a system that cause it to fail due to (1) some particular combination of inputs, (2) some environmental condition (3) incorrect or incomplete inputs from sensors, (4) incomplete or erroneous data entry by operators, and (5) potential systematic faults due to poor interface design).
Safety-Related Systems Failures
This article covers the functional safety of safety-related control systems, and considers the hardware and software technical requirements necessary to achieve the required safety integrity. The overall approach is in accordance with the proposed International Electrotechnical Commission Standard IEC 1508, Parts 2 and 3 (IEC 1993). The overall goal of draft international standard IEC 1508, Functional Safety: Safety-Related Systems, is to ensure that plant and equipment can be safety automated. A key objective in the development of the proposed international standard is to prevent or minimize the frequency of:
- failures of control systems triggering other events which in turn could lead to danger (e.g., control system fails, control is lost, process goes out of control resulting in a fire, release of toxic materials, etc.)
- failures in alarm and monitoring systems so that operators are not given information in a form that can be quickly identified and understood in order to carry out the necessary emergency actions
- undetected failures in protection systems, making them unavailable when needed for a safety action (e.g., a failed input card in an emergency shut-down system).
The article “Electrical, electronic and programmable electronic safety-related systems” sets out the general safety management approach embodied within Part 1 of IEC 1508 for assuring the safety of control and protection systems that are important to safety. This article describes the overall conceptual engineering design that is needed to reduce the risk of an accident to an acceptable level, including the role of any control or protection systems based on E/E/PE technology.
In figure 1, the risk from the equipment, process plant or machine (generally referred to as equipment under control (EUC) without protective devices) is marked at one end of the EUC Risk Scale, and the target level of risk that is needed to meet the required level of safety is at the other end. In between is shown the combination of safety-related systems and external risk reduction facilities needed to make up the required risk reduction. These can be of various types—mechanical (e.g., pressure relief valves), hydraulic, pneumatic, physical, as well as E/E/PE systems. Figure 2 emphasizes the role of each safety layer in protecting the EUC as the accident progresses.
Figure 1. Risk reduction: General concepts
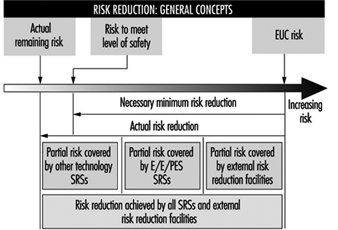
Figure 2. Overall model: Protection layers
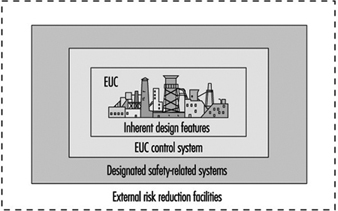
Provided that a hazard and risk analysis has been performed on the EUC as required in Part 1 of IEC 1508, the overall conceptual design for safety has been established and therefore the required functions and Safety Integrity Level (SIL) target for any E/E/PE control or protection system have been defined. The Safety Integrity Level target is defined with respect to a Target Failure Measure (see table 1).
Table 1. Safety Integrity Levels for protection systems: Target failure measures
Safety integrity Level Demand mode of operation (Probability of failure to perform its design function on demand)
4 10-5 ≤ × 10-4
3 10-4 ≤ × 10-3
2 10-3 ≤ × 10-2
1 10-2 ≤ × 10-1
Protection Systems
This paper outlines the technical requirements that the designer of an E/E/PE safety-related system should consider to satisfy the required Safety Integrity Level target. The focus is on a typical protection system utilizing programmable electronics in order to allow for a more in-depth discussion of the key issues with little loss in generality. A typical protection system is shown in figure 3, which depicts a single channel safety system with a secondary switch-off activated via a diagnostic device. In normal operation the unsafe condition of the EUC (e.g., overspeed in a machine, high temperature in a chemical plant) will be detected by the sensor and transmitted to the programmable electronics, which will command the actuators (via the output relays) to put the system into a safe state (e.g., removing power to electric motor of the machine, opening a valve to relieve pressure).
Figure 3. Typical protection system
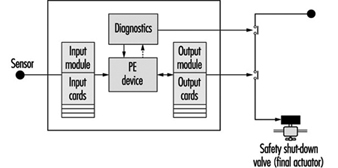
But what if there are failures in the protection system components? This is the function of the secondary switch-off, which is activated by the diagnostic (self-checking) feature of this design. However, the system is not completely fail-safe, as the design has only a certain probability of being available when being asked to carry out its safety function (it has a certain probability of failure on demand or a certain Safety Integrity Level). For example, the above design might be able to detect and tolerate certain types of output card failure, but it would not be able to withstand a failure of the input card. Therefore, its safety integrity will be much lower than that of a design with a higher-reliability input card, or improved diagnostics, or some combination of these.
There are other possible causes of card failures, including “traditional” physical faults in the hardware, systematic faults including errors in the requirements specification, implementation faults in the software and inadequate protection against environmental conditions (e.g., humidity). The diagnostics in this single-channel design may not cover all these types of faults, and therefore this will limit the Safety Integrity Level achieved in practice. (Coverage is a measure of the percentage of faults that a design can detect and handle safely.)
Technical Requirements
Parts 2 and 3 of draft IEC 1508 provide a framework for identifying the various potential causes of failure in hardware and software and for selecting design features that overcome those potential causes of failure appropriate to the required Safety Integrity Level of the safety-related system. For example, the overall technical approach for the protection system in figure 3 is shown in figure 4. The figure indicates the two basic strategies for overcoming faults and failures: (1) fault avoidance, where care is taken in to prevent faults being created; and (2) fault tolerance, where the design is created specifically to tolerate specified faults. The single-channel system mentioned above is an example of a (limited) fault tolerant design where diagnostics are used to detect certain faults and put the system into a safe state before a dangerous failure can occur.
Figure 4. Design specification: Design solution
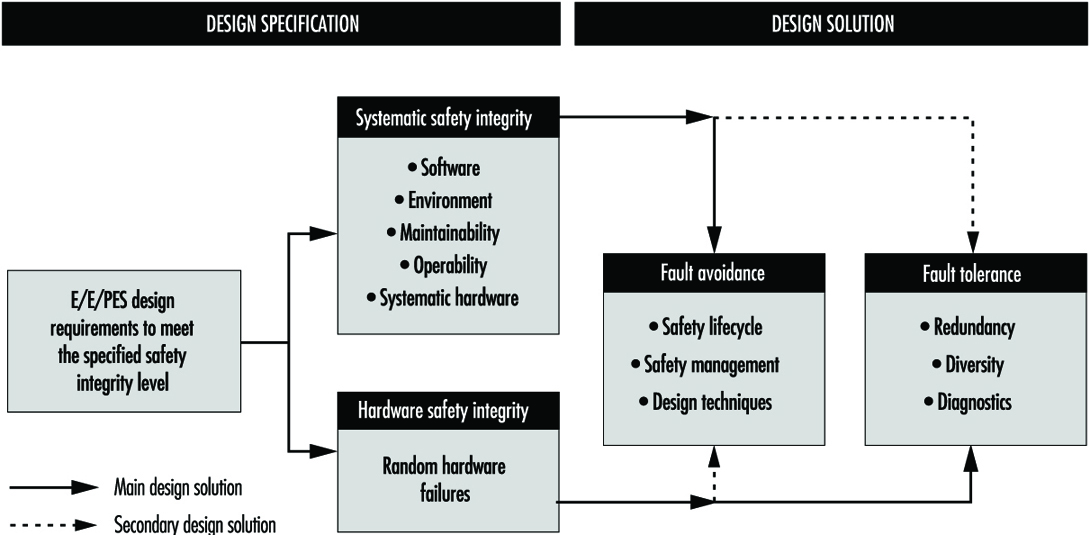
Fault avoidance
Fault avoidance attempts to prevent faults being introduced into a system. The main approach is to use a systematic method of managing the project so that safety is treated as a definable and manageable quality of a system, during design and then subsequently during operation and maintenance. The approach, which is similar to quality assurance, is based on the concept of feedback and involves: (1) planning (defining safety objectives, identifying the ways and means to achieve the objectives); (2) measuring achievement against the plan during implementation and (3) applying feedback to correct for any deviations. Design reviews are a good example of a fault avoidance technique. In IEC 1508 this “quality” approach to fault avoidance is facilitated by the requirements to use a safety lifecycle and employ safety management procedures for both hardware and software. For the latter, these often manifest themselves as software quality assurance procedures such as those described in ISO 9000-3 (1990).
In addition, Parts 2 and 3 of IEC 1508 (concerning hardware and software, respectively) grade certain techniques or measures that are considered useful for fault avoidance during the various safety lifecycle phases. Table 2 gives an example from Part 3 for the design and development phase of software. The designer would use the table to assist in the selection of fault avoidance techniques, depending on the required Safety Integrity Level. With each technique or measure in the tables there is a recommendation for each Safety Integrity Level, 1 to 4. The range of recommendations covers Highly Recommended (HR), Recommended (R), Neutral—neither for or against (—) and Not Recommended (NR).
Table 2. Software design and development
|
Technique/measure |
SIL 1 |
SIL 2 |
SIL 3 |
SIL 4 |
|
1. Formal methods including, for example, CCS, CSP, HOL, LOTOS |
— |
R |
R |
HR |
|
2. Semi-formal methods |
HR |
HR |
HR |
HR |
|
3. Structured. Methodology including, for example, JSD, MASCOT, SADT, SSADM and YOURDON |
HR |
HR |
HR |
HR |
|
4. Modular approach |
HR |
HR |
HR |
HR |
|
5. Design and coding standards |
R |
HR |
HR |
HR |
HR = highly recommended; R = recommended; NR = not recommended;— = neutral: the technique/measure is neither for or against the SIL.
Note: a numbered technique/measure shall be selected according to the safety integrity level.
Fault tolerance
IEC 1508 requires increasing levels of fault tolerance as the safety integrity target increases. The standard recognizes, however, that fault tolerance is more important when systems (and the components that make up those systems) are complex (designated as Type B in IEC 1508). For less complex, “well proven” systems, the degree of fault tolerance can be relaxed.
Tolerance against random hardware faults
Table 3 shows the requirements for fault tolerance against random hardware failures in complex hardware components (e.g., microprocessors) when used in a protection system such as is shown in figure 3. The designer may need to consider an appropriate combination of diagnostics, fault tolerance and manual proof checks to overcome this class of fault, depending on the required Safety Integrity Level.
Table 3. Safety Integrity Level - Fault requirements for Type B components1
1 Safety-related undetected faults shall be detected by the proof check.
2 For components without on-line medium diagnostic coverage, the system shall be able to perform the safety function in the presence of a single fault. Safety-related undetected faults shall be detected by the proof check.
3 For components with on-line high diagnostic coverage, the system shall be able to perform the safety function in the presence of a single fault. For components without on-line high diagnostic coverage, the system shall be able to perform the safety function in the presence of two faults. Safety-related undetected faults shall be detected by the proof check.
4 The components shall be able to perform the safety function in the presence of two faults. Faults shall be detected with on-line high diagnostic coverage. Safety-related undetected faults shall be detected by the proof check. Quantitative hardware analysis shall be based on worst-case assumptions.
1Components whose failure modes are not well defined or testable, or for which there are poor failure data from field experience (e.g., programmable electronic components).
IEC 1508 aids the designer by providing design specification tables (see table 4) with design parameters indexed against the Safety Integrity Level for a number of commonly used protection system architectures.
Table 4. Requirements for Safety Integrity Level 2 - Programmable electronic system architectures for protection systems
|
PE system configuration |
Diagnostic coverage per channel |
Off-line proof test Interval (TI) |
Mean time to spurious trip |
|
Single PE, Single I/O, Ext. WD |
High |
6 months |
1.6 years |
|
Dual PE, Single I/O |
High |
6 months |
10 years |
|
Dual PE, Dual I/O, 2oo2 |
High |
3 months |
1,281 years |
|
Dual PE, Dual I/O, 1oo2 |
None |
2 months |
1.4 years |
|
Dual PE, Dual I/O, 1oo2 |
Low |
5 months |
1.0 years |
|
Dual PE, Dual I/O, 1oo2 |
Medium |
18 months |
0.8 years |
|
Dual PE, Dual I/O, 1oo2 |
High |
36 months |
0.8 years |
|
Dual PE, Dual I/O, 1oo2D |
None |
2 months |
1.9 years |
|
Dual PE, Dual I/O, 1oo2D |
Low |
4 months |
4.7 years |
|
Dual PE, Dual I/O, 1oo2D |
Medium |
18 months |
18 years |
|
Dual PE, Dual I/O, 1oo2D |
High |
48+ months |
168 years |
|
Triple PE, Triple I/O, IPC, 2oo3 |
None |
1 month |
20 years |
|
Triple PE, Triple I/O, IPC, 2oo3 |
Low |
3 months |
25 years |
|
Triple PE, Triple I/O, IPC, 2oo3 |
Medium |
12 months |
30 years |
|
Triple PE, Triple I/O, IPC, 2oo3 |
High |
48+ months |
168 years |
The first column of the table represents architectures with varying degrees of fault tolerance. In general, architectures placed near the bottom of the table have a higher degree of fault tolerance than those near the top. A 1oo2 (one out of two) system is able to withstand any one fault, as can 2oo3.
The second column describes the percentage coverage of any internal diagnostics. The higher the level of the diagnostics, the more faults will be trapped. In a protection system this is important because, provided the faulty component (e.g., an input card) is repaired within a reasonable time (often 8 hours), there is little loss in functional safety. (Note: this would not be the case for a continuous control system, because any fault is likely to cause an immediate unsafe condition and the potential for an incident.)
The third column shows the interval between proof tests. These are special tests that are required to be carried out to thoroughly exercise the protection system to ensure that there are no latent faults. Typically these are carried out by the equipment vendor during plant shutdown periods.
The fourth column shows the spurious trip rate. A spurious trip is one that causes the plant or equipment to shut down when there is no process deviation. The price for safety is often a higher spurious trip rate. A simple redundant protection system—1oo2—has, with all other design factors unchanged, a higher Safety Integrity Level but also a higher spurious trip rate than a single-channel (1oo1) system.
If one of the architectures in the table is not being used or if the designer wants to carry out a more fundamental analysis, then IEC 1508 allows this alternative. Reliability engineering techniques such as Markov modelling can then be used to calculate the hardware element of the Safety Integrity Level (Johnson 1989; Goble 1992).
Tolerance against systematic and common cause failures
This class of failure is very important in safety systems and is the limiting factor on the achievement of safety integrity. In a redundant system a component or subsystem, or even the whole system, is duplicated to achieve a high reliability from lower-reliability parts. Reliability improvement occurs because, statistically, the chance of two systems failing simultaneously by random faults will be the product of the reliabilities of the individual systems, and hence much lower. On the other hand, systematic and common cause faults cause redundant systems to fail coincidentally when, for example, a specification error in the software leads the duplicated parts to fail at the same time. Another example would be the failure of a common power supply to a redundant system.
IEC 1508 provides tables of engineering techniques ranked against the Safety Integrity Level considered effective in providing protection against systematic and common cause failures.
Examples of techniques providing defences against systematic failures are diversity and analytical redundancy. The basis of diversity is that if a designer implements a second channel in a redundant system using a different technology or software language, then faults in the redundant channels can be regarded as independent (i.e., a low probability of coincidental failure). However, particularly in the area of software-based systems, there is some suggestion that this technique may not be effective, as most mistakes are in the specification. Analytical redundancy attempts to exploit redundant information in the plant or machine to identify faults. For the other causes of systematic failure—for example, external stresses—the standard provides tables giving advice on good engineering practices (e.g., separation of signal and power cables) indexed against Safety Integrity Level.
Conclusions
Computer-based systems offer many advantages—not only economic, but also the potential for improving safety. However, the attention to detail required to realize this potential is significantly greater than is the case using conventional system components. This article has outlined the main technical requirements that a designer needs to take into account to successfully exploit this technology.
" DISCLAIMER: The ILO does not take responsibility for content presented on this web portal that is presented in any language other than English, which is the language used for the initial production and peer-review of original content. Certain statistics have not been updated since the production of the 4th edition of the Encyclopaedia (1998)."