- You are here:
-
Home

- k2 Feed
Case Studies of Air Traffic Controllers in the United States and Italy
United States
High levels of stress among air traffic controllers (ATCs) were first widely reported in the United States in the 1970 Corson Report (US Senate 1970), which focused on working conditions such as overtime, few regular work breaks, increasing air traffic, few vacations, poor physical work environment and “mutual resentment and antagonism” between management and labour. Such conditions contributed to ATC job actions in 1968–69. In addition, early medical research, including a major 1975–78 Boston University study (Rose, Jenkins and Hurst 1978), suggested that ATCs may face a higher risk of stress-related illness, including hypertension.
Following the 1981 US ATC strike, in which job stress was a major issue, the Department of Transportation again appointed a task force to examine stress and morale. The resulting 1982 Jones Report indicated that FAA employees in a wide variety of job titles reported negative results for job design, work organization, communication systems, supervisory leadership, social support and satisfaction. The typical form of ATC stress was an acute episodic incident (such as a near mid-air collision) along with interpersonal tensions stemming from management style. The task force reported that 6% of the ATC sample was “burned out” (having a large and debilitating loss of self-confidence in ability to do the job). This group represented 21% of those 41 years of age and older and 69% of those with 19 or more years of service.
A 1984 review by the Jones task force of its recommendations concluded that “conditions are as bad as in 1981, or perhaps a bit worse”. Major concerns were increasing traffic volume, inadequate staffing, low morale and an increasing burnout rate. Such conditions led to the re-unionization of US ATCs in 1987 with the election of the National Air Traffic Controllers Organization (NATCA) as their bargaining representative.
In a 1994 survey, New York City area ATCs reported continuing staffing shortages and concerns about job stress, shift work and indoor air quality. Recommendations for improving morale and health included transfer opportunities, early retirement, more flexible schedules, exercise facilities at work and increased staffing. In 1994, a greater proportion of Level 3 and 5 ATCs reported high burnout than ATCs in 1981 and 1984 national surveys (except for ATCs working in centres in 1984). Level 5 facilities have the highest level of air traffic, and Level 1, the lowest (Landsbergis et al. 1994). Feelings of burnout were related to having experienced a “near miss” in the past 3 years, age, years working as an ATC, working in high-traffic Level 5 facilities, poor work organization and poor supervisor and co-worker support.
Research also continues on appropriate shift schedules for ATCs, including the possibility of a 10-hour, 4-day shift schedule. The long-term health effects of the combination of rotating shifts and compressed work weeks are not known.
A collectively bargained programme to reduce ATC job stress in Italy
The company in charge of all civil air traffic in Italy (AAAV) employs 1,536 ATCs. AAAV and union representatives drew up several agreements between 1982 and 1991 to improve working conditions. These include:
1. Modernizing radio systems and automating aeronautical information, flight data processing and air traffic management. This provided for more reliable information and more time for making decisions, eliminating many risky traffic peaks and providing for a more balanced workload.
2. Reducing work hours. The operative work week is now 28 to 30 hours.
3. Changing shift schedules:
- rapid shift speed: one day on each shift
- one night shift followed by 2 days rest
- adjust of shift length to workload: 5 to 6 hours for morning; 7 hours for afternoon; 11 to 12 hours for night
- short naps on the night shift
- keeping shift rotation as regular as possible to allow better organization of personal, family and social life
- a long break (45 to 60 minutes) for a meal during work shifts.
4. Reduce environmental stressors. Attempts have been made to reduce noise and provide more light.
5. Improving the ergonomics of new consoles, screens and chairs.
6. Improving physical fitness. Gyms are provided in the largest facilities.
Research during this period suggests that the programme was beneficial. The night shift was not very stressful; ATCs’ performance did not worsen significantly at the end of three shifts; only 28 ATCs were dismissed for health reasons in 7 years; and a large decline in “near misses” occurred despite major increases in air traffic.
Airport and Flight Control Operations
Some text was adapted from the 3rd edition Encyclopaedia article “Aviation - ground personnel” authored by E. Evrard.
Commercial air transport involves the interaction of several groups including governments, airport operators, aircraft operators and aircraft manufacturers. Governments are generally involved in overall air transport regulation, oversight of aircraft operators (including maintenance and operations), manufacturing certification and oversight, air traffic control, airport facilities and security. Airport operators can either be local governments or commercial entities. They are usually responsible for the general operation of the airport. Types of aircraft operators include general airlines and commercial transport (either privately or publicly owned), cargo carriers, corporations and individual aircraft owners. Aircraft operators in general are responsible for operation and maintenance of the aircraft, training of personnel and operation of ticketing and boarding operations. Responsibility for security can vary; in some countries the aircraft operators are responsible, and in others the government or airport operators are responsible. Manufacturers are responsible for design, manufacturing and testing, and for aircraft support and improvement. There are also international agreements con- cerning international flights.
This article deals with the personnel involved with all aspects of flight control (i.e., those who control commercial aircraft from takeoff to landing and who maintain the radar towers and other facilities used for flight control) and with those airport personnel who perform maintenance on and load aircraft, handle baggage and air freight and provide passenger services. Such personnel are divided into the following categories:
- air traffic controllers
- airways facilities and radar towers maintenance personnel
- ground crews
- baggage handlers
- passenger service agents.
Flight Control Operations
Government aviation authorities such as the Federal Aviation Administration (FAA) in the United States maintain flight control over commercial aircraft from takeoff to landing. Their primary mission involves the handling of airplanes using radar and other surveillance equipment to keep aircraft separated and on course. Flight control personnel work at airports, terminal radar approach control facilities (Tracons) and regional long-distance centres, and consist of air traffic controllers and airways facilities maintenance personnel. Airways facilities maintenance personnel maintain the airport control towers, air traffic Tracons and regional centres, radio beacons, radar towers and radar equipment, and consist of electronics technicians, engineers, electricians and facilities maintenance workers. The guidance of planes using instruments is accomplished following instrument flight rules (IFR). Planes are tracked using the General National Air Space System (GNAS) by air traffic controllers working at airport control towers, Tracons and regional centres. Air traffic controllers keep planes separated and on course. As a plane moves from one jurisdiction to another, responsibility for the plane is handed from one type of controller to another.
Regional centres, terminal radar approach control and airport control towers
Regional centres direct planes after they have reached high altitudes. A centre is the largest of the aviation authority’s facilities. Regional centre controllers hand off and receive planes to and from Tracons or other regional control centres and use radio and radar to maintain communication with aircraft. A plane flying across a country will always be under surveillance by a regional centre and passed along from one regional centre to the next.
The regional centres all overlap each other in the surveillance range and receive radar information from long-range radar facilities. Radar information is sent to these facilities via microwave links and telephone lines, thus providing a redundancy of information so that if one form of communication is lost, the other is available. Oceanic air traffic, which cannot be seen by radar, is handled by the regional centres via radio. Technicians and engineers maintain the electronic surveillance equipment and the uninterrupted power systems, which includes emergency generators and large banks of back-up batteries.
Air traffic controllers at Tracons handle planes flying at low altitudes and within 80 km of airports, using radio and radar to maintain communication with aircraft. Tracons receive radar tracking information from the airport surveillance radar (ASR). The radar tracking system identifies the plane moving in space but also queries the plane beacon and identifies the plane and its flight information. Personnel and work tasks at Tracons are similar to those at the regional centres.
Regional and approach control systems exist in two variants: non-automated or manual systems and automated systems.
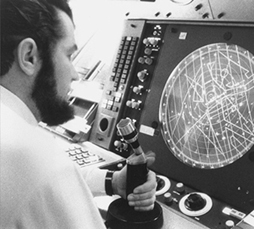
With manual air traffic control systems, radio communications between controller and pilot are supplemented by information from primary or secondary radar equipment. The trace of the aeroplane can be followed as a mobile echo on display screens formed by cathode-ray tubes (see figure 1). Manual systems have been replaced by automated systems in most countries.
Figure 1. Air traffic controller at a manual local control centre radar screen.
With automated air traffic control systems, information on the aeroplane is still based on the flight plan and primary and secondary radar, but computers make it possible to present in alphanumeric form on the display screen all data concerning each aeroplane and to follow its route. Computers are also used to anticipate conflict between two or more aircraft on identical or converging routes on the basis of the flight plans and standard separations. Automation relieves the controller of many of the activities he or she carries out in a manual system, leaving more time for taking decisions.
Conditions of work are different in manual and automated control centre systems. In the manual system the screen is horizontal or sloping, and the operator leans forward in an uncomfortable position with his or her face between 30 and 50 cm from it. The perception of mobile echoes in the form of spots depends on their brightness and their contrast with the illuminance of the screen. As some mobile echoes have a very low luminous intensity, the working environment must be very weakly illuminated to ensure the greatest possible visual sensitivity to contrast.
In the automated system the electronic data display screens are vertical or almost vertical, and the operator can work in a normal sitting position with a greater reading distance. The operator has horizontally arranged keyboards within reach to regulate the presentation of the characters and symbols conveying the various types of information and can alter the shape and brightness of the characters. The lighting of the room can approach the intensity of daylight, for contrast remains highly satisfactory at 160 lux. These features of the automated system place the operator in a much better position to increase efficiency and reduce visual and mental fatigue.
Work is carried out in a huge, artificially lighted room without windows, which is filled with display screens. This closed environment, often far from the airports, allows little social contact during the work, which calls for great concentration and powers of decision. The comparative isolation is mental as well as physical, and there is hardly any opportunity of diversion. All this has been held to produce stress.
Each airport has a control tower. Controllers at airport control towers direct planes in and out of the airport, using radar, radio and binoculars to maintain communication with aircraft both while taxiing and while taking off and landing. Airport tower controllers hand off to or receive planes from controllers at Tracons. Most of the radar and other surveillance systems are located at the airports. These systems are maintained by technicians and engineers.
The walls of the tower room are transparent, for there must be perfect visibility. The working environment is thus completely different from that of regional or approach control. The air traffic controllers have a direct view of aircraft movements and other activities. They meet some of the pilots and take part in the life of the airport. The atmosphere is no longer that of a closed environment, and it offers a greater variety of interest.
Airways facilities maintenance personnel
Airways facilities and radar towers maintenance personnel consist of radar technicians, navigational and communication technicians and environmental technicians.
Radar technicians maintain and operate the radar systems, including airport and long-range radar systems. The work involves electronic equipment maintenance, calibration and troubleshooting.
Navigational and communication technicians maintain and operate the radio communications equipment and other related navigational equipment used in controlling air traffic. The work involves electronic equipment maintenance, calibration and troubleshooting.
Environmental technicians maintain and operate the aviation authority buildings (regional centres, Tracons and airport facilities, including the control towers) and equipment. The work requires running heating, ventilation and air-conditioning equipment and maintaining emergency generators, airport lighting systems, large banks of batteries in uninterrupted power supply (UPS) equipment and related electrical power equipment.
The occupational hazards for all three jobs include: noise exposure; working on or near live electrical parts including exposure to high voltage, x-ray exposure from klystron and magnitron tubes, fall hazards while working on elevated radar towers or using climbing poles and ladders to access towers and radio antenna and possibly PCBs exposure when handling older capacitors and working on utility transformers. Workers may also be exposed to microwave and radio-frequency exposure. According to a study of a group of radar workers in Australia (Joyner and Bangay 1986), personnel are not generally exposed to levels of microwave radiation exceeding 10 W/m2 unless they are working on open waveguides (microwave cables) and components utilizing waveguide slots, or working within transmitter cabinets when high-voltage arcing is occurring. The environmental technicians also work with chemicals related to building maintenance, including boiler and other related water treatment chemicals, asbestos, paints, diesel fuel and battery acid. Many of the electrical and utility cables at airports are underground. Inspection and repair work on these systems often involves confined space entry and exposure to confined space hazards—noxious or asphyxiating atmospheres, falls, electrocution and engulfment.
Airways facilities maintenance workers and other ground crews in the airport operating area are frequently exposed to jet exhaust. Several airport studies where sampling of jet engine exhaust has been conducted demonstrated similar results (Eisenhardt and Olmsted 1996; Miyamoto 1986; Decker 1994): the presence of aldehydes including butyraldehyde, acetaldehyde, acrolein, methacrolein, isobutyraldehyde, propionaldehyde, croton-aldehyde and formaldehyde. Formaldehyde was present at significantly higher concentrations then the other aldehydes, followed by acetaldehyde. The authors of these studies have concluded that the formaldehyde in the exhaust was probably the main causative factor in the eye and respiratory irritation reported by exposed persons. Depending on the study, nitrogen oxides either were not detected or were present in concentrations below 1 part per million (ppm) in the exhaust stream. They concluded that neither nitrogen oxides nor other oxides play a major role in the irritation. Jet exhaust was also found to contain 70 different hydrocarbon species with up to 13 consisting mostly of olefins (alkenes). Heavy-metal exposure from jet exhaust has been shown not to pose a health hazard for areas surrounding airports.
Radar towers should be equipped with standard railings around the stairs and platforms to prevent falls and with interlocks to prevent access to the radar dish while it is operating. Workers accessing towers and radio antennas should use approved devices for ladder climbing and personal fall protection.
Personnel work on both de-energized and energized electrical systems and equipment. Protection from electrical hazards should involve training in safe work practices, lockout/tagout procedures and the use of personal protective equipment (PPE).
The radar microwave is generated by high-voltage equipment using a klystron tube. The klystron tube generates x rays and can be a source of exposure when the panel is opened, allowing personnel to come in close proximity to it to work on it. The panel should always remain in place except when servicing the klystron tube, and work time should be kept to a minimum.
Personnel should wear the appropriate hearing protection (e.g., ear plugs and/or ear muffs) when working around noise sources such as jet planes and emergency generators.
Other controls involve training in materials handling, vehicle safety, emergency response equipment and evacuation procedures and confined space entry procedures equipment (including direct-reading air monitors, blowers and mechanical retrieval systems).
Air traffic controllers and flight services personnel
Air traffic controllers work in regional control centres, Tracons and airport control towers. This work generally involves working at a console tracking planes on radar scopes and communicating with pilots by radio. Flight services personnel provide weather information for pilots.
The hazards to air traffic controllers include possible visual problems, noise, stress and ergonomic problems. At one time there was concern about x-ray emissions from the radar screens. This, however, has not turned out to be a problem at the operating voltages used.
Standards of fitness for air traffic controllers have been recommended by the International Civil Aviation Organization (ICAO), and detailed standards are set out in national military and civil regulations, those relating to sight and hearing being particularly precise.
Visual problems
The broad, transparent surfaces of air traffic control towers at airports sometimes result in dazzling by the sun, and reflection from surrounding sand or concrete can increase the luminosity. This strain on the eyes may produce headaches, though often of a temporary nature. It may be prevented by surrounding the control tower with grass and avoiding concrete, asphalt or gravel and by giving a green tint to the transparent walls of the room. If the colour is not too strong, visual acuity and colour perception remain adequate while the excess radiation that causes dazzle is absorbed.
Until about 1960 there was a good deal of disagreement among authors on the frequency of eyestrain among controllers from viewing radar screens, but it does seem to have been high. Since then, attention given to visual refractive errors in the selection of radar controllers, their correction among serving controllers and the constant improvement of working conditions at the screen have helped to lower it considerably. Sometimes, however, eyestrain appears among controllers with excellent sight. This may be attributed to too low a level of lighting in the room, irregular illumination of the screen, the brightness of the echoes themselves and, in particular, flickering of the image. Progress in viewing conditions and insistence on higher technical specifications for new equipment are leading to a marked reduction in this source of eyestrain, or even its elimination. Strain in accommodation has also been considered until recently to be a possible cause of eyestrain among operators who have worked very close to the screen for an hour without interruption. Visual problems are becoming much less frequent and are likely to disappear or to occur only very occasionally in the automated radar system, for example, when there is a fault in a scope or where the rhythm of the images is badly adjusted.
A rational arrangement of the premises is mainly one that facilitates the adaptation of the scope readers to the intensity of the ambient lighting. In a non-automated radar station, adaptation to the semi-darkness of the scope room is achieved by spending 15 to 20 minutes in another dimly lighted room. The general lighting of the scope room, the luminous intensity of the scopes and the brightness of the spots must all be studied with care. In the automated system the signs and symbols are read under an ambient lighting of from 160 to 200 lux, and the disadvantages of the dark environment of the non-automated system are avoided. With regard to noise, despite modern sound-insulating techniques, the problem remains acute in control towers installed near the runways.
Readers of radar screens and electronic display screens are sensitive to changes in the ambient lighting. In the non-automated system the controllers must wear glasses absorbing 80% of the light for between 20 and 30 minutes before entering their workplace. In the automated system special glasses for adaptation are no longer essential, but persons particularly sensitive to the contrast between the lighting of the symbols on the display screen and that of the working environment find that glasses of medium absorptive power add to the comfort of their eyes. There is also a reduction in eyestrain. Runway controllers are well advised to wear glasses absorbing 80% of the light when they are exposed to strong sunlight.
Stress
The most serious occupational hazard for air traffic controllers is stress. The chief duty of the controller is to make decisions on the movements of aircraft in the sector he or she is responsible for: flight levels, routes, changes of course when there is conflict with the course of another aircraft or when congestion in one sector leads to delays, air traffic and so on. In non-automated systems the controller must also prepare, classify and organize the information his or her decision is based on. The data available are comparatively crude and must first be digested. In highly automated systems the instruments can help the controller in taking decisions, and he or she may then only have to analyse data produced by teamwork and presented in rational form by these instruments. Although the work may be greatly facilitated, the responsibility for approving the decision proposed to the controller remains the controller’s, and his or her activities still give rise to stress. The responsibilities of the job, pressure of work at certain hours of dense or complex traffic, increasingly crowded air space, sustained concentration, rotating shift work and awareness of the catastrophe that may result from an error all create a situation of continuous tension, which may lead to stress reactions. The fatigue of the controller may assume the three classic forms of acute fatigue, chronic fatigue or overstrain and nervous exhaustion. (See also the article “Case Studies of Air Traffic Controllers in the United States and Italy”.)
Air traffic control calls for an uninterrupted service 24 hours a day, all year long. The conditions of work of controllers thus include shift work, an irregular rhythm of work and rest and periods of work when most other people are enjoying holidays. Periods of concentration and of relaxation during working hours and days of rest during a week of work are indispensable to the avoidance of operational fatigue. Unfortunately, this principle cannot be embodied in general rules, for the arrangement of work in shifts is influenced by variables that may be legal (maximum number of consecutive hours of work authorized) or purely professional (workload depending on the hour of the day or the night), and by many other factors based on social or family considerations. With regard to the most suitable length for periods of sustained concentration during work, experiments show that there should be short breaks of at least a few minutes after periods of uninterrupted work of from half an hour to an hour-and-a-half, but that there is no need to be bound by rigid patterns to achieve the desired aim: the maintenance of the level of concentration and the prevention of operational fatigue. What is essential is to be able to interrupt the periods of work at the screen with periods of rest without interrupting the continuity of the shift work. Further study is necessary to establish the most suitable length of the periods of sustained concentration and of relaxation during work and the best rhythm for weekly and annual rest periods and holidays, with a view to drawing up more unified standards.
Other hazards
There are also ergonomic issues while working at the consoles similar to those of computer operators, and there may be indoor air quality problems. Air traffic controllers also experience tone incidents. Tone incidents are loud tones coming into the headsets. The tones are of short duration (a few seconds) and have sound levels up to 115 dBA.
In flight services work, there are hazards associated with lasers, which are used in ceilorometer equipment used to measure cloud ceiling height, as well as ergonomic and indoor air quality issues.
Other flight control services personnel
Other flight control services personnel include flight standards, security, airport facilities renovation and construction, administrative support and medical personnel.
Flight standards personnel are aviation inspectors who conduct airline maintenance and flight inspections. Flight standards personnel verify the airworthiness of the commercial airlines. They often inspect airplane maintenance hangers and other airport facilities, and they ride in the cockpits of commercial flights. They also investigate plane crashes, incidents or other aviation-related mishaps.
The hazards of the job include noise exposure from aircraft, jet fuel and jet exhaust while working in hangers and other airport areas, and potential exposure to hazardous materials and blood-borne pathogens while investigating aircraft crashes. Flight standards personnel face many of the same hazards as airport ground crews, and thus many of the same precautions apply.
Security personnel include sky marshals. Sky marshals provide internal security on airplanes and external security at airport ramps. They are essentially police and investigate criminal activities related to aircraft and airports.
Airport facilities renovation and construction personnel approve all plans for airport modifications or new construction. The personnel are usually engineers, and their work largely involves office work.
Administrative workers include personnel in accounting, management systems and logistics. Medical personnel in the flight surgeon’s office provide occupational medical services to aviation authority workers.
Air traffic controllers, flight services personnel and personnel who work in office environments should have ergonomic training on proper sitting postures and on emergency response equipment and evacuation procedures.
Airport Operations
Airport ground crews conduct maintenance on and load aircraft. Baggage handlers handle passenger baggage and air freight, whereas passenger service agents register passengers and check passenger baggage.
All loading operations (passengers, baggage, freight, fuel, supplies and so on) are controlled and integrated by a supervisor who prepares the loading plan. This plan is given to the pilot prior to take-off. When all operations have been completed and any checks or inspections considered necessary by the pilot have been made, the airport controller gives authorization for take-off.
Ground crews
Aircraft maintenance and servicing
Every aircraft is serviced every time it lands. Ground crews performing routine turnaround maintenance; conduct visual inspections, including checking the oils; perform equipment checks, minor repairs and internal and external cleaning; and refuel and restock the aircraft. As soon as the aircraft lands and arrives in the unloading bays, a team of mechanics begins a series of maintenance checks and operations which vary with the type of aircraft. These mechanics refuel the aircraft, check a number of safety systems which must be inspected after each landing, investigate the logbook for any reports or defects the flight crew may have noticed during the flight and, where necessary, make repairs. (See also the article “Aircraft Maintenance Operations” in this chapter.) In cold weather, the mechanics may have to perform additional tasks, such as de-icing of wings, landing gear, flaps and so on. In hot climates special attention is paid to the condition of the aircraft’s tyres. Once this work has been completed, the mechanics can declare the aircraft flightworthy.
More thorough maintenance inspections and aircraft overhauls are performed at specific intervals of flying hours for each aircraft.
Fuelling aircraft is one of the most potentially hazardous servicing operations. The amount of fuel to be loaded is determined on the basis of such factors as flight duration, take-off weight, flight path, weather and possible diversions.
A cleaning team cleans and services the aircraft cabins, replacing dirty or damaged material (cushions, blankets and so on), empties the toilets and refills the water tanks. This team may also disinfect or disinfest the aircraft under the supervision of public health authorities.
Another team stocks the aircraft with food and drink, emergency equipment and supplies needed for passenger comfort. Meals are prepared under high standards of hygiene to eliminate the risk of food poisoning, particularly among the flight crew. Certain meals are deep frozen to –40ºC, stored at –29ºC and reheated in flight.
Ground service work includes the use of motorized and non-motorized equipment.
Baggage and air cargo loading
Baggage and cargo handlers move passenger baggage and air freight. Freight can range from fresh fruits and vegetables and live animals to radioisotopes and machinery. Because baggage and cargo handling requires physical effort and the use of mechanized equipment, workers may be more at risk for injuries and ergonomic problems.
Ground crews and baggage and freight handlers are exposed to many of the same hazards. These hazards include working outdoors in all types of weather, exposure to potential airborne contaminants from jet fuel and jet engine exhaust and exposure to prop wash and jet blast. Prop wash and jet blast can slam doors shut, knock people or unsecured equipment over, cause turboprop propellers to rotate and blow debris into engines or onto people. Ground crews are also exposed to noise hazards. A study in China showed ground crews were exposed to noise at aircraft engine hatches that exceeds 115 dBA (Wu et al. 1989). Vehicle traffic on the airport ramps and apron is very heavy, and the risk of accidents and collision is high. Fuelling operations are very hazardous, and workers may be exposed to fuel spills, leaks, fires and explosions. Workers on lifting devices, aerial baskets, platforms or access stands are at risk of falling. Job hazards also include rotating shift work carried out under pressure of time.
Strict regulations must be implemented and enforced for vehicle movement and driver training. Driver training should emphasize complying with speed limits, obeying off-limit areas and ensuring that there is adequate room for planes to manoeuvre. There should be good maintenance of ramp surfaces and efficient control of ground traffic. All vehicles authorized to operate on the airfield should be conspicuously marked so they can be readily identified by air traffic controllers. All equipment used by the ground crews should be regularly inspected and maintained. Workers on lifting devices, aerial baskets, platforms or access stands must be protected from falls either through the use of guardrails or personal fall protection equipment. Hearing protection equipment (earplugs and earmuffs) must be used for protection against noise hazards. Other PPE includes suitable work clothing depending on the weather, non-slip reinforced-toe-cap foot protection and appropriate eye, face, glove and body protection when applying de-icing fluids. Rigorous fire prevention and protection measures including bonding and grounding and prevention of electric sparking, smoking, open flames and the presence of other vehicles within 15 m of aircraft, must be implemented for refuelling operations. Fire-fighting equipment should be maintained and located in the area. Training on procedures to follow in the event of a fuel spill or fire should be conducted regularly.
Baggage and freight handlers should store and stack cargo securely and should receive training on proper lifting techniques and back postures. Extreme care should be used when entering and leaving aircraft cargo areas from carts and tractors. Appropriate protective clothing should be worn, depending on the type of cargo or baggage (such as gloves when handling live animal cargo). Baggage and freight conveyors, carousels and dispensers should have emergency shut-offs and built-in guards.
Passenger service agents
Passenger service agents issue tickets, register and check in passengers and passenger baggage. These agents may also guide passengers when boarding. Passenger service agents who sell airline tickets and check in passengers may spend all day on their feet using a video display unit (VDU). Precautions against these ergonomic hazards include resilient floor mats and seats for relief from standing, work breaks and ergonomic and anti-glare measures for the VDUs. In addition, dealing with passengers can be a source of stress, particularly when there are delays in flights or problems with making flight connections and so on. Breakdowns in the computerized airline reservations systems can also be a major source of stress.
Baggage check-in and weigh-in facilities should minimize the need for employees and passengers to lift and handle bags, and baggage conveyors, carousels and dispensers should have emergency shut-offs and built-in guards. Agents should also receive training on proper lifting techniques and back postures.
Baggage inspection systems use fluoroscopic equipment to examine baggage and other carry-on items. Shielding protects workers and the public from x-ray emissions, and if the shielding is not properly positioned, interlocks prevent the system from operating. According to an early study by the US National Institute for Occupational Safety and Health (NIOSH) and the Air Transport Association at five US airports, maximum documented whole-body x-ray exposures were considerably lower than maximum levels set by the US Food and Drug Administration (FDA) and the Occupational Safety and Health Administration (OSHA) (NIOSH 1976). Workers should wear whole-body monitoring devices to measure radiation exposures. NIOSH recommended periodic maintenance programmes to check effectiveness of shielding.
Passenger service agents and other airport personnel must be thoroughly familiar with the airport emergency evacuation plan and procedures.
Challenges to Workers' Health and Safety in the Transportation and Warehousing Industry
The transportation and warehousing industry is fraught with challenges to worker health and safety. Those involved in loading and unloading of cargo and in storing, stacking and retrieving materials are prone to musculoskeletal injuries, slips and falls due to uncertain, irregular or slippery work surfaces and being struck by falling objects. See figure 1. Those operating and maintaining vehicles and other machinery are not only vulnerable to such injuries but also to the toxic effects of fuels, lubricants and exhaust fumes. If ergonomic principles are not heeded in the design of seats, pedals and instrument panels, drivers of trains, planes and motor vehicles (those used in warehousing as well on roads) will not only be subject to musculoskeletal disorders and undue fatigue, but will also be prone to operating mishaps that can lead to accidents.
Figure 1. Lifting parcels above shoulder height is an ergonomic hazard.

Teamster Union
All workers—and the general public as well—may be exposed to toxic substances in the event of leaks, spills and fires. Since much of the work is done out-of-doors, transportation and warehousing workers are also subject to extremes of weather such as heat, cold, rain, snow and ice, which can not only make the work more arduous but also more dangerous. Aviation crews must adjust to changes in barometric pressure. Noise is a perennial problem for those operating or working near noisy vehicles and machinery.
Stress
Perhaps the most pervasive hazard in this industry is work stress. It has many sources:
Adjusting to work hours. Many workers in this industry are burdened by the necessity of adjusting to changing shifts, while flight crews who travel long east-west or west-east distances must adjust to changes in circadian body rhythms; both of these factors may cause drowsiness and fatigue. The danger of functional impairment due to fatigue has led to laws and regulations stipulating the number of hours or shifts that may be worked without a rest period. These are generally applicable to aviation flight crews, railroad train crews and, in most countries, drivers of road buses and trucks. Many of the last group are independent contractors or work for small enterprises and are frequently forced by economic pressures to flout these regulations. There are always emergencies dictated by problems with traffic, weather or accidents which require exceeding the work hours limits. Led by the airlines, large transportation companies are now using computers to track employees’ work schedules to verify their compliance with the regulations and to minimize the amount of down time for both workers and equipment.
Timetables. Most passenger and a good part of freight transport is guided by timetables stipulating departure and arrival times. The necessity of keeping to schedules which often allow too little leeway is often a very potent stressor for the drivers and their crews.
Dealing with the public. Meeting the sometimes unreasonable and often forcefully expressed demands of the public can be a significant source of stress for those dealing with passengers at terminals and ticket offices and en route. Drivers of road transport must contend with other vehicles, traffic regulations and diligent highway traffic officers.
Accidents. Accidents, whether due to equipment failure, human error or environmental conditions, place the transportation industry at or near the top of listings of occupational fatalities in most countries. Even when a particular worker’s injuries may not be serious, post-traumatic stress disorder (PTSD) can lead to profound and prolonged disability, and in some instances it can prompt changing to another job.
Isolation. Many employees in the transportation industry work alone with little or no human contact (e.g., truck drivers, workers in control rooms and in railroad switch and signal towers). If problems arise, there may be difficulty and delays in getting help. And, if they are not kept busy, boredom may lead to a drop in attentiveness that can presage accidents. Working alone, especially for those driving taxis, limousines and delivery trucks, is an important risk factor for felonious assaults and other forms of violence.
Being away from home. Transportation workers are frequently required to be away from home for periods of days or weeks (in the maritime industry, for months). In addition to the stress of living out of a suitcase, strange food and strange sleeping accommodations, there is the reciprocal stress of separation from family and friends.
Health problems
Most industrialized countries require transportation workers, especially drivers and operating crew members, to take periodic medical examinations to verify that their physical and mental capacities meet the requirements established by regulations. Visual and hearing acuity, colour vision, muscular strength and flexibility and freedom from causes of syncope are some of the factors tested for. Accommodations, however, make it possible for many individuals with chronic disorders or disabilities to work without danger to themselves or others. (In the United States, for example, employers are mandated by the federal Americans With Disabilities Act to provide such accommodations.)
Drugs and alcohol
Prescription and over-the-counter medications taken for a variety of disorders (e.g., hypertension, anxiety and other hyperkinetic conditions, allergies, diabetes, epilepsy, headaches and the common cold) may cause drowsiness and affect alertness, reaction time and coordination, especially when alcoholic beverages are also consumed. Abuse of alcohol and/or illegal drugs is found frequently enough among transportation workers to have led to voluntary or legislatively mandated drug testing programmes.
Summary
The health and safety of workers in the transportation and warehousing industry are critical considerations, not only for the workers themselves but also for the public being transported or involved as bystanders. Safeguarding health and safety, therefore, is the joint responsibility of the employers, the employees and their unions and governments on all levels.
General Profile
The transport sector encompasses industries that are involved in the transportation of goods and passengers throughout the world. This sector is structurally complex and vitally important to economies locally, nationally and globally.
Economic Importance
The transport sector is vitally important to the economic viability of nations. Transportation plays a key role in economically important factors such as employment, utilization of raw and manufactured goods, investment of private and public capital and generation of tax revenues.
In most industrialized countries, transport accounts for 2 to 12% of the paid employment (ILO 1992). In the United States alone, the Department of Transportation reported that in 1993, there were approximately 7.8 million employees in trucking-related firms (DOT 1995). The transport sector’s share in the gross domestic product (GDP) and total employment tends to decrease as the country’s income increases.
The transport sector is also a major consumer of raw materials and finished goods in most industrialized countries. For example, in the United States, the transport sector utilizes approximately 71% of all rubber produced, 66% of all petroleum refined, 24% of all zinc, 23% of all cement, 23% of all steel, 11% of all copper and 16% of all aluminium (Sampson, Farris and Shrock 1990).
Capital investment utilizing public and private funds to purchase trucks, ships, airplanes, terminals and other equipment and facilities easily exceeds hundreds of billions of dollars in industrialized countries.
The transport sector also plays a major role in generating revenues in the form of taxes. In industrialized countries, transport of passengers and freight is often heavily taxed (Sampson, Farris and Shrock 1990; Gentry, Semeijn and Vellenga 1995). Typically these taxes take the form of fuel taxes on gasoline and diesel fuels, and excise taxes on freight bills and passenger tickets, and easily exceed hundreds of billions of dollars annually.
Evolution of the Sector
In the early stages of the transport sector, geography greatly influenced what was the dominant mode of transportation. As advances were made in construction technology, it became possible to overcome many of the geographical barriers that limited the development of the transport sector. As a result, the modes of transport that have dominated the sector evolved in accordance with the technology available.
Initially, water travel over the oceans was the primary mode of transport of freight and passengers. As large rivers were navigated and canals were built, the volume of inland transport over the waterways increased significantly. In the late nineteenth century, transport over railways began to emerge as the dominant mode of transport. Rail transport, because of its ability to overcome natural barriers such as mountains and valleys through the use of tunnels and bridges, offered flexibility that waterways could not provide. Furthermore, unlike transport over waterways, transport over the rails was virtually unaffected by winter conditions.
Many national governments recognized the strategic and economic advantages of rail transport. Consequently, rail companies were awarded governmental financial assistance to facilitate the expansion of rail networks.
In the early twentieth century, the development of the combustion engine combined with the increased use of motor vehicles enabled road transport to become an increasingly popular mode of transport. As the highway and throughway systems were developed, road transport enabled door-to-door deliveries of goods. This flexibility far surpassed that of railways and waterways. Eventually, as advances were made in road construction and improvements were made to the internal combustion engine, in many parts of the world road transport became faster than rail transport. Consequently, road transport has become the most used mode of transport of goods and passengers.
The transport sector continued to evolve with the advent of airplanes. The use of airplanes as a means to transport freight and passengers began during the Second World War. Initially, airplanes were primarily used to transport mail and soldiers. However, as aircraft construction was perfected and an increasing number of persons learned to operate airplanes, air transport grew in popularity. Today, air transport is a very fast, reliable mode of transport. However, in terms of total tonnage, air transport handles only a very small percentage of freight.
Structure of the Sector
Information on the structure of rail systems in industrialized countries is generally reliable and comparable (ILO 1992). Similar information on road systems is somewhat less reliable. Information on the structure of waterways is reliable, having not changed substantially in the past few decades. However, similar information regarding developing countries is scarce and unreliable.
European countries developed economic and political blocs that have had a significant impact on the transport sector. In Europe, road transport dominates the movement of freight and passengers. Trucking, with a heavy emphasis on less-than-trailer-load freight, is conducted by small national and regional carriers. This industry is heavily regulated and highly fractured. Since the early 1970s, the total volume of freight transported by road has increased by 240%. Conversely, rail transport has declined by approximately 8% (Violland 1996). However, several European countries are working diligently to increase the efficiency of rail transport and are promoting intermodal transport.
In the United States, the primary mode of transport is over the roadways. The Department of Transportation, Office of Motor Carriers, reported in 1993 that there were over 335,000 firms operating medium and heavy trucks (DOT 1995). This included large companies that transport their own products, smaller private firms, and for-hire truckload and less-than-truckload common and contract carriers. The majority of these fleets (58%) operate six or fewer trucks. These companies operate a total of 1.7 million combination units, 4.4 million single-unit medium and heavy trucks and 3.8 million trailers. The road system in the United States increased by roughly 2% from 1980 to 1989 (ILO 1992).
The rail systems in the United States have declined, due primarily to the loss of Class 1 status of some rail lines, and due to the abandonment of less profitable lines. Canada has increased its rail system by some 40%, due mainly to a change in the classification system. The road system in Canada has decreased by 9% (ILO 1992).
In the industrialized nations of the Pacific Rim, there is great variability of the rail and road systems, due mainly to the different levels of industrialization of the respective countries. For example, rail and road networks in the Republic of Korea are similar to those in Europe, whereas in Malaysia, the rail and road networks are significantly smaller, but experiencing tremendous growth rates (over 53% for roads since 1980) (ILO 1992).
In Japan, the transport sector is heavily dominated by road transport, which accounts for 90.5% of the total Japanese freight transport tonnage. Approximately 8.2% of the tonnage is transported by water and 1.2% by rail (Magnier 1996).
Developing countries in Asia, Africa and Latin America typically suffer from inadequate transport systems. There is significant work underway to improve the systems, but a lack of hard currency, skilled workers and equipment inhibits the growth. Transport systems have grown significantly in Venezuela, Mexico and Brazil.
The Middle East in general has experienced growth in the transport sector, with countries such as Kuwait and Iran leading the way. It should be noted that due to the large size of the countries, sparse populations and arid climatic conditions, unique problems are encountered that limit the development of transport systems in this region.
An overview of railroad and road systems for selected countries and world regions is shown in figure 1 and figure 2.
Figure 1. World road network distribution 1988-89, kilometers.

Figure 2. World railroad network distribution, 1988-89, in kilometers.

Workforce Characteristics
The transportation sector contributes significantly to employment in most countries in both the private and public sectors. However, as per capita income increases, the impact of the sector on total employment decreases. The overall number of workers in the transport industries has declined steadily since the 1980s. This loss of workforce in the sector is due to several factors, especially technological advances that have automated many of the jobs related to the construction, maintenance and operation of transport systems. In addition, many countries have passed legislation which deregulated many transport-related industries; this has ultimately resulted in the loss of jobs.
Workers who are currently employed in transport-related industries must be highly skilled and competent. Due to the rapid advances in technology experienced in the transport sector, these workers and prospective workers must receive continual training and retraining.
Safety Audits and Management Audits
During the 1990s, the organizational factors in safety policy are becoming increasingly important. At the same time, the views of organizations regarding safety have dramatically changed. Safety experts, most of whom have a technical training background, are thus confronted with a dual task. On the one hand, they have to learn to understand the organizational aspects and take them into account in constructing safety programmes. On the other hand, it is important that they be aware of the fact that the view of organizations is moving further and further away from the machine concept and placing a clear emphasis on less tangible and measurable factors such as organizational culture, behaviour modification, responsibility-raising or commitment. The first part of this article briefly covers developments in opinions relating to organizations, management, quality and safety. The second part of the article defines the implications of these developments for audit systems. This is then very briefly placed in a tangible context using the example of an actual safety audit system based on the International Organization for Standardization (ISO) 9001 standards.
New Opinions Concerning Organization and Safety
Changes in social-economic circumstances
The economic crisis that started to impact upon the Western world in 1973 has had a significant influence on thought and action in the field of management, quality and work safety. In the past, the accent in economic development was placed on expansion of the market, increasing exports and improving productivity. However, the emphasis gradually shifted to the reduction of losses and the improvement of quality. In order to retain and acquire customers, a more direct response was provided to their requirements and expectations. This resulted in a need for greater product differentiation, with the direct consequence of greater flexibility within organizations in order to always be able to respond to market fluctuations on a “just in time” basis. Emphasis was placed on the commitment and creativity of employees as the major competitive advantage in the economic competitive struggle. Besides increasing quality, limiting loss-making activities became an important means of improving operating results.
Safety experts enlisted in this strategy by developing and instituting “total loss control” programmes. Not only are the direct costs of accidents or the increased insurance premiums significant in these programmes, but so also are all direct or indirect unnecessary costs and losses. A study of how much production should be increased in real terms to compensate for these losses immediately reveals that reducing costs is today often more efficient and profitable than increasing production.
In this context of improved productivity, reference was recently made to the major benefits of reducing absenteeism due to sickness and stimulating employee motivation. Against the background of these developments, safety policy is increasingly and clearly taking on a new form with different accents. In the past, most corporate leaders considered work safety as merely a legal obligation, as a burden they would quickly delegate to technical specialists. Today, safety policy is more and more distinctly being viewed as a way of achieving the two aims of reducing losses and optimizing corporate policy. Safety policy is therefore increasingly evolving into a reliable barometer of the soundness of the corporation’s success with respect to these aims. In order to measure progress, increased attention is being devoted to management and safety audits.
Organizational Theory
It is not only economic circumstances that have given company heads new insights. New visions relating to management, organizational theory, total quality care and, in the same vein, safety care, are resulting in significant changes. An important turning point in views on the organization was elaborated in the renowned work published by Peters and Waterman (1982), In Search of Excellence. This work was already espousing the ideas which Pascale and Athos (1980) discovered in Japan and described in The Art of Japanese Management. This new development can be symbolized in a sense by McKinsey’s “7-S” Framework (in Peters and Waterman 1982). In addition to three traditional management aspects (Strategy, Structure and Systems), corporations now also emphasize three additional aspects ( Staff, Skills and Style). All six of these interact to provide the input to the 7th “S”, Superordinate goals (figure 1). With this approach, a very clear accent is placed on the human-oriented aspects of the organization.
Figuer 1.The values, mission and organizational culture of a corporation according to McKinsey’s 7-S Framework
The fundamental shifts can best be demonstrated on the basis of the model presented by Scott (1978), which was also used by Peters and Waterman (1982). This model uses two approaches:
- The closed-system approaches deny the influence of developments from outside the organization. With the mechanistic closed approaches, the objectives of an organization are clearly defined and can be logically and rationally determined.
- Open-system approaches take outside influences fully into account, and the objectives are more the result of diverse processes, in which clearly irrational factors contribute to decision making. These organically open approaches more truly reflect the evolution of an organization, which is not determined mathematically or on the basis of deductive logic, but grows organically on the basis of real people and their interactions and values (figure 2).
Figure 2.Organizational Theories
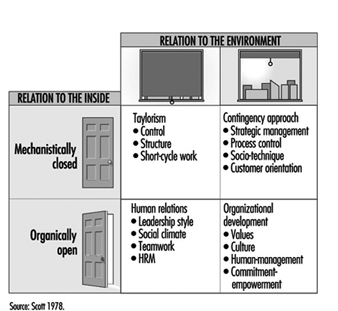
Four fields are thus created in figure 2 . Two of these (Taylorism and contingency approach) are mechanically closed, and the other two (human relations and organizational development) are organically open. There has been enormous development in management theory, moving from the traditional rational and authoritarian machine model (Taylorism) to the human-oriented organic model of human resources management (HRM).
Organizational effectiveness and efficiency are being more clearly linked to optimal strategic management, a flat organizational structure and sound quality systems. Furthermore, attention is now given to superordinate goals and significant values that have a bonding effect within the organization, such as skills (on the basis of which the organization stands out from its competitors) and a staff that is motivated to maximum creativity and flexibility by placing the emphasis on commitment and empowerment. With these open approaches, a management audit cannot limit itself to a number of formal or structural characteristics of the organization. The audit must also include a search for methods to map out less tangible and measurable cultural aspects.
From product control to total quality management
In the 1950s, quality was limited to a post-factum end product control, total quality control (TQC). In the 1970s, partly stimulated by NATO and the automotive giant Ford, the accent shifted to the achievement of the goal of total quality assurance (TQA) during the production process. It was only during the 1980s that, stimulated by Japanese techniques, attention shifted towards the quality of the total management system and total quality management (TQM) was born. This fundamental change in the quality care system has taken place cumulatively in the sense that each foregoing stage was integrated into the next. It is also clear that while product control and safety inspection are facets more closely related to a Tayloristic organizational concept, quality assurance is more associated with a socio-technical system approach where the aim is not to betray the trust of the (external) customer. TQM, finally, relates to an HRM approach by the organization as it is no longer solely the improvement of the product that is involved, but continuous improvement of the organizational aspects in which explicit attention is also devoted to the employees.
In the total quality leadership (TQL) approach of the European Foundation for Quality Management (EFQM), the emphasis is very strongly placed on the equal impact of the organization on the customer, the employees and the overall society, with the environment as the key point of attention. These objectives can be realized by including concepts such as “leadership” and “people management”.
It is clear that there is also a very important difference in emphasis between quality assurance as described in the ISO standards and the TQL approach of the EFQM. ISO quality assurance is an extended and improved form of quality inspection, focusing not only on the products and internal customers, but also on the efficiency of the technical processes. The objective of the inspection is to investigate the conformity with the procedures set out in ISO. TQM, on the other hand, endeavours to meet the expectations of all internal and external customers as well as all processes within the organization, including the more soft and human-oriented ones. The involvement, the commitment and the creativity of the employees are clearly important aspects of TQM.
From Human Error to Integrated Safety
Safety policy has evolved in a similar manner to quality care. Attention has shifted from post-factum accident analysis, with emphasis on the prevention of injuries, to a more global approach. Safety is seen more in the context of “total loss control” - a policy aimed at the avoidance of losses through management of safety involving the interaction of people, processes, materials, equipment, installations and the environment. Safety therefore focuses on the management of the processes that could lead to losses. In the initial development period of safety policy the emphasis was placed on a human error approach. Consequently, employees were given a heavy responsibility for the prevention of industrial accidents. Following a Tayloristic philosophy, conditions and procedures were drawn up and a control system was established to maintain the prescribed standards of behaviour. This philosophy may filter through into modern safety policy via the ISO 9000 concepts resulting in the imposition of a sort of implicit and indirect feeling of guilt upon the employees, with all the adverse consequences this entails for the corporate culture - for instance, a tendency may develop that performance will be impeded rather than enhanced.
At a later stage in the evolution of safety policy, it was recognized that employees carry out their work in a particular environment with well-defined working resources. Industrial accidents were considered as a multicausal event in a human/machine/environment system in which the emphasis shifted in a technical-system approach. Here again we find the analogy with quality assurance, where the accent is placed on controlling technical processes through means such as statistical process control.
Only recently, and partly stimulated by the TQM philosophy, has the emphasis in safety policy systems shifted into a social-system approach, which is a logical step in the improvement of the prevention system. In order to optimize the human/machine/environment system it is not sufficient to ensure safe machines and tools by means of a well-developed prevention policy, but there is also the need for a preventive maintenance system and the assurance of security among all technical processes. Moreover, it is of crucial importance that employees be sufficiently trained, skilled and motivated with regard to health and safety objectives. In today’s society, the latter objective can no longer be achieved through the authoritarian Tayloristic approach, as positive feedback is much more stimulating than a repressive control system that often has only negative effects. Modern management entails an open, motivating corporate culture, in which there is a common commitment to achieving key corporate objectives in a participatory, team-based approach. In the safety-culture approach, safety is an integral part of the objectives of the organizations and therefore an essential part of everyone’s task, starting with top management and passing along the entire hierarchical line down to employees on the shop floor.
Integrated safety
The concept of integrated safety immediately presents a number of central factors in an integrated safety system, the most important of which can be summarized as follows:
A clearly visible commitment from the top management. This commitment is not only given on paper, but is translated right down to the shop floor in practical achievements.
Active involvement of the hierarchical line and the central support departments. Care for safety, health and welfare is not only an integral part of everyone’s task in the production process, but is also integrated into the personnel policy, into preventive maintenance, into the design stage and into working with third parties.
Full participation of the employees. Employees are full discussion partners with whom open and constructive communication is possible, with their contribution being given full weight. Indeed, participation is of crucial importance for carrying through corporate and safety policy in an efficient and motivating way.
A suitable profile for a safety expert. The safety expert is no longer the technician or jack of all trades, but is a qualified adviser to the top management, with particular attention being devoted to optimizing the policy processes and the safety system. He or she is therefore not someone who is only technically trained, but also a person who, as a good organizer, can deal with people in an inspiring manner and collaborate in a synergetic way with other prevention experts.
A pro-active safety culture. The key aspect of an integrated safety policy is a pro-active safety culture, which includes, among other things, the following:
- Safety, health and welfare are the key ingredients of an organization’s value system and of the objectives it seeks to attain.
- An atmosphere of openness prevails, based on mutual trust and respect.
- There is a high level of cooperation with a smooth flow of information and an appropriate level of coordination.
- A pro-active policy is implemented with a dynamic system of constant improvement perfectly matching the prevention concept.
- The promotion of safety, health and welfare is a key component of all decision-making, consultations and teamwork.
- When industrial accidents occur, suitable preventive measures are sought, not a scapegoat.
- Members of staff are encouraged to act on their own initiative so that they possess the greatest possible authority, knowledge and experience, enabling them to intervene in an appropriate manner in unexpected situations.
- Processes are set in motion with a view to promoting individual and collective training to the maximum extent possible.
- Discussions concerning challenging and attainable health, safety and welfare objectives are held on a regular basis.
Safety and Management Audits
General description
Safety audits are a form of risk analysis and evaluation in which a systematic investigation is carried out in order to determine the extent to which the conditions are present that provide for the development and implementation of an effective and efficient safety policy. Each audit therefore simultaneously envisions the objectives that must be realized and the best organizational circumstances to put these into practice.
Each audit system should, in principle, determine the following:
- What is management seeking to achieve, by what means and by what strategy?
- What are the necessary provisions in terms of resources, structures, processes, standards and procedures that are required to achieve the proposed objectives, and what has been provided? What minimum programme can be put forward?
- What are the operational and measurable criteria that must be met by the chosen items to allow the system to function optimally?
The information is then thoroughly analysed to examine to what extent the current situation and the degree of achievement meet the desired criteria, followed by a report with positive feedback that emphasizes the strong points, and corrective feedback that refers to aspects requiring further improvement.
Auditing and strategies for change
Each audit system explicitly or implicitly contains a vision both of an ideal organization’s design and conceptualization, and of the best way of implementing improvements.
Bennis, Benne and Chin (1985) distinguish three strategies for planned changes, each based on a different vision of people and of the means of influencing behaviour:
- Power-force strategies are based on the idea that the behaviour of employees can be changed by exercising sanctions.
- Rational-empirical strategies are based on the axiom that people make rational choices depending on maximizing their own benefits.
- Normative-re-educative strategies are based on the premise that people are irrational, emotional beings and in order to realize a real change, attention must also be devoted to their perception of values, culture, attitudes and social skills.
Which influencing strategy is most appropriate in a specific situation not only depends on the starting vision, but also on the actual situation and the existing organizational culture. In this respect it is very important to know which sort of behaviour to influence. The famous model devised by Danish risk specialist Rasmussen (1988) distinguishes among the following three sorts of behaviour:
- Routine actions (skill-based behaviour) automatically follow the associated signal. Such actions are carried out without one’s consciously devoting attention to them - for example, touch-typing or manually changing gears when driving.
- Actions in accordance with instructions (rule-based) require more conscious attention because no automatic response to the signal is present and a choice must be made between different possible instructions and rules. These are often actions which can be placed in an “ifthen” sequence, as in “If the meter rises to 50 then this valve must be closed”.
- Actions based on knowledge and insight (knowledge-based) are carried out after a conscious interpretation and evaluation of the different problem signals and the possible alternative solutions. These actions therefore presuppose a fairly high degree of knowledge of and insight into the process concerned, and the ability to interpret unusual signals.
Strata in behavioural and cultural change
Based on the above, most audit systems (including those based on the ISO series of standards) implicitly depart from power-force strategies or rational-empirical strategies, with their emphasis on routine or procedural behaviour. This means that insufficient attention is paid in these audit systems to “knowledge-based behaviour” that can be influenced mainly via normative–re-educative strategies. In the typology used by Schein (1989), attention is devoted only to the tangible and conscious surface phenomena of the organizational culture and not to the deeper invisible and subconscious strata that refer more to values and fundamental presuppositions.
Many audit systems limit themselves to the question of whether a particular provision or procedure is present. It is therefore implicitly assumed that the sheer existence of this provision or procedure is a sufficient guarantee for the good functioning of the system. Besides the existence of certain measures, there are always different other “strata” (or levels of probable response) that must be addressed in an audit system to provide sufficient information and guarantees for the optimum functioning of the system.
In more concrete terms, the following example concerns response to a fire emergency:
- A given provision, instruction or procedure is present (“sound the alarm and use the extinguisher”).
- A given instruction or procedure is also familiarly known to the parties concerned (workers know where alarms and extinguishers are located and how to activate and use them).
- The parties concerned also know as much as possible as to the “why and wherefore” of a particular measure (employees have been trained or educated in extinguisher use and typical types of fires).
- The employee is also motivated to apply needful measures (self preservation, save the job, etc.).
- There is sufficient motivation, competence and ability to act in unforeseen circumstances (employees know what to do in the event fire gets out of hand, requiring professional fire-fighting response).
- There are good human relations and an atmosphere of open communication (supervisors, managers and employees have discussed and agreed upon fire emergency response procedures).
- Spontaneous creative processes originate in a learning organiz-ation (changes in procedures are implemented following “lessons learned” in actual fire situations).
Table 1 lays out some strata in quality audio safety policy.
Table 1. Strata in quality and safety policy
|
Strategies |
Behaviour |
||
|
Skills |
Rules |
Knowledge |
|
|
Power-force |
Human error approach |
||
|
Rational-empirical |
Technical system approach |
||
|
Normative-re-educative |
Social system approach TQM |
Safety culture approach PAS EFQM |
|
The Pellenberg Audit System
The name Pellenberg Audit System (PAS) derives from the place where the designers gathered many times to develop the system (the Maurissens Château in Pellenberg, a building of the Catholic University of Leuven). PAS is the result of intense collaboration by an interdisciplinary team of experts with years of practical experience, both in the area of quality management and in the area of safety and environmental problems, in which a variety of approaches and experiences were brought together. The team also received support from the university science and research departments, and thus benefited from the most recent insights in the fields of management and organizational culture.
PAS encompasses an entire set of criteria that a superior company prevention system ought to meet (see table 2). These criteria are classified in accordance with the ISO standard system (quality assurance in design, development, production, installation and servicing). However, PAS is not a simple translation of the ISO system into safety, health and welfare. A new philosophy is developed, departing from the specific product that is achieved in safety policy: meaningful and safe jobs. The contract of the ISO system is replaced by the provisions of the law and by the evolving expectations that exist among the parties involved in the social field with regard to health, safety and welfare. The creation of safe and meaningful jobs is seen as an essential objective of each organization within the framework of its social responsibility. The enterprise is the supplier and the customers are the employees.
Table 2. PAS safety audit elements
|
PAS safety audit elements |
Correspondence with ISO 9001 |
|
|
1. |
Management responsibility |
|
|
1.1. |
Safety policy |
4.1.1. |
|
1.2. |
Organization |
|
|
1.2.1. |
Responsibility and authority |
4.1.2.1. |
|
1.2.2. |
Verification resources and personnel |
4.1.2.2. |
|
1.2.3. |
Health and safety service |
4.1.2.3. |
|
1.3. |
Safety management system review |
4.1.3. |
|
2. |
Safety management system |
4.2. |
|
3. |
Obligations |
4.3. |
|
4. |
Design control |
|
|
4.1. |
General |
4.4.1. |
|
4.2. |
Design and development planning |
4.4.2. |
|
4.3. |
Design input |
4.4.3. |
|
4.4. |
Design output |
4.4.4. |
|
4.5. |
Design verification |
4.4.5. |
|
4.6. |
Design changes |
4.4.6. |
|
5. |
Document control |
|
|
5.1. |
Document approval and issue |
4.5.1. |
|
5.2. |
Document changes/modifications |
4.5.2. |
|
6. |
Purchasing and contracting |
|
|
6.1. |
General |
4.6.1. |
|
6.2. |
Assessment of suppliers and contractors |
4.6.2. |
|
6.3. |
Purchasing data |
4.6.3. |
|
6.4. |
Third party’s products |
4.7. |
|
7. |
Identification |
4.8. |
|
8. |
Process control |
|
|
8.1. |
General |
4.9.1. |
|
8.2. |
Process safety control |
4.11. |
|
9. |
Inspection |
|
|
9.1. |
Receiving and pre-start-up inspection |
4.10.1. |
|
9.2. |
Periodic inspections |
4.10.2. |
|
9.3. |
Inspection records |
4.10.4. |
|
9.4. |
Inspection equipment |
4.11. |
|
9.5. |
Inspection status |
4.12. |
|
10. |
Accidents and incidents |
4.13. |
|
11. |
Corrective and preventive action |
4.13. |
|
12. |
Safety records |
4.16. |
|
13. |
Internal safety audits |
4.17. |
|
14. |
Training |
4.18. |
|
15. |
Maintenance |
4.19. |
|
16. |
Statistical techniques |
4.20. |
Several other systems are integrated in the PAS system:
- At a strategic level, the insights and requirements of ISO are of particular importance. As far as possible, these are comple-mented by the management vision as this was originally devel-oped by the European Foundation for Quality Management.
- At a tactical level, the systematics of the “Management’s Oversight and Risk Tree” encourages people to seek out what are the necessary and sufficient conditions in order to achieve the desired safety result.
- At an operational level a multitude of sources could be drawn upon, including existing legislation, regulations and other criteria such as the International Safety Rating System (ISRS), in which the emphasis is placed on certain concrete conditions that should guarantee the safety result.
The PAS constantly refers to the broader corporate policy within which the safety policy is embedded. After all, an optimum safety policy is at the same time a product and a producer of a pro-active company policy. Assuming that a safe company is at the same time an effective and efficient organization and vice versa, special attention is therefore devoted to the integration of safety policy in the overall policy. Essential ingredients of a future-oriented corporate policy include a strong corporate culture, a far-reaching commitment, the participation of the employees, a special emphasis on the quality of the work, and a dynamic system of continual improvement. Although these insights also partly form the background of the PAS, they are not always very easy to reconcile with the more formal and procedural approach of the ISO philosophy.
Formal procedures and directly identifiable results are indisputably important in safety policy. However, it is not enough to base the safety system on this approach alone. The future results of a safety policy are dependent on the present policy, on the systematic efforts, on the constant search for improvements, and particularly on the fundamental optimizing of processes that ensure durable results. This vision is incorporated in the PAS system, with strong emphasis among other things on a systematic improvement of the safety culture.
One of the main advantages of the PAS is the opportunity for synergy. By departing from the systematics of ISO, the diverse lines of approach become immediately recognizable for all those concerned with total quality management. There are clearly several opportunities for synergy between these various policy areas because in all these fields the improvement of the management processes is the key aspect. A careful purchasing policy, a sound system of preventive maintenance, good housekeeping, participatory management and the stimulation of an enterprising approach by employees are of paramount importance for all these policy areas.
The various care systems are organized in an analogous manner, based on principles such as the commitment of top management, the involvement of the hierarchical line, the active participation of employees, and a valorized contribution from the specific experts. The different systems also contain analogous policy instruments such as the policy statement, annual action plans, measuring and control systems, internal and external audits and so on. The PAS system therefore clearly invites the pursuance of an effective, cost-saving, synergetic cooperation between all these care systems.
The PAS does not offer the easiest road to achievement in the short term. Few company managers allow themselves to be seduced by a system that promises great benefits in the short term with little effort. Every sound policy requires an in-depth approach, with strong foundations being laid for future policy. More important than results in the short term is the guarantee that a system is being built up that will generate sustainable results in the future, not only in the field of safety, but also at the level of a generally effective and efficient corporate policy. In this respect working towards health, safety and welfare also means working towards safe and meaningful jobs, motivated employees, satisfied customers and an optimum operating result. All this takes place in a dynamic, pro-active atmosphere.
Summary
Continual improvement is an essential precondition for each safety audit system that seeks to reap lasting success in today’s rapidly evolving society. The best guarantee for a dynamic system of continual improvement and constant flexibility is the full commitment of competent employees who grow with the overall organization because their efforts are systematically valorized and because they are given the opportunities to develop and regularly update their skills. Within the safety audit process, the best guarantee of lasting results is the development of a learning organization in which both the employees and the organization continue to learn and evolve.
Work-Related Accident Costs
Workers who are the victims of work-related accidents suffer from material consequences, which include expenses and loss of earnings, and from intangible consequences, including pain and suffering, both of which may be of short or long duration. These consequences include:
- doctor’s fees, cost of ambulance or other transport, hospital charges or fees for home nursing, payments made to persons who gave assistance, cost of artificial limbs and so on
- the immediate loss of earnings during absence from work (unless insured or compensated)
- loss of future earnings if the injury is permanently disabling, long term or precludes the victim’s normal advancement in his or her career or occupation
- permanent afflictions resulting from the accident, such as mutilation, lameness, loss of vision, ugly scars or disfigurement, mental changes and so on, which may reduce life expectancy and give rise to physical or psychological suffering, or to further expenses arising from the victim’s need to find a new occupation or interests
- subsequent economic difficulties with the family budget if other members of the family have to either go to work to replace lost income or give up their employment in order to look after the victim. There may also be additional loss of income if the victim was engaged in private work outside normal working hours and is no longer able to perform it.
- anxiety for the rest of the family and detriment to their future, especially in the case of children.
Workers who become victims of accidents frequently receive compensation or allowances both in cash and in kind. Although these do not affect the intangible consequences of the accident (except in exceptional circumstances), they constitute a more or less important part of the material consequences, inasmuch as they affect the income which will take the place of the salary. There is no doubt that part of the overall costs of an accident must, except in very favourable circumstances, be borne directly by the victims.
Considering the national economy as a whole, it must be admitted that the interdependence of all its members is such that the consequences of an accident affecting one individual will have an adverse effect on the general standard of living, and may include the following:
- an increase in the price of manufactured products, since the direct and indirect expenses and losses resulting from an accident may result in an increase in the cost of making the product
- a decrease in the gross national product as a result of the adverse effects of accidents on people, equipment, facilities and materials; these effects will vary according to the availability in each country of workers, capital and material resources
- additional expenses incurred to cover the cost of compensating accident victims and pay increased insurance premiums, and the amount necessary to provide safety measures required to prevent similar occurrences.
One of the functions of society is that it must protect the health and income of its members. It meets these obligations through the creation of social security institutions, health programmes (some governments provide free or low-cost medical care to their constituents), injury compensation insurance and safety systems (including legislation, inspection, assistance, research and so on), the administrative costs of which are a charge on society.
The level of compensation benefits and the amount of resources devoted to accident prevention by governments are limited for two reasons: because they depend (1) on the value placed on human life and suffering, which varies from one country to another and from one era to another; and (2) on the funds available and the priorities allocated for other services provided for the protection of the public.
As a result of all this, a considerable amount of capital is no longer available for productive investment. Nevertheless, the money devoted to preventive action does provide considerable economic benefits, to the extent that there is a reduction in the total number of accidents and their cost. Much of the effort devoted to the prevention of accidents, such as the incorporation of higher safety standards into machinery and equipment and the general education of the population before working age, are equally useful both inside and outside the workplace. This is of increasing importance because the number and cost of accidents occurring at home, on the road and in other non-work-related activities of modern life continues to grow. The total cost of accidents may be said to be the sum of the cost of prevention and the cost of the resultant changes. It would not seem unreasonable to recognize that the cost to society of the changes which could result from the implementation of a preventive measure may exceed the actual cost of the measure many times over. The necessary financial resources are drawn from the economically active section of the population, such as workers, employers and other taxpayers through systems which work either on the basis of contributions to the institutions that provide the benefits, or through taxes collected by the state and other public authorities, or by both systems. At the level of the undertaking the cost of accidents includes expenses and losses, which are made up of the following:
- expenses incurred while setting up the system of work and the related equipment and machinery with a view to ensuring safety in the production process. Estimation of these expenses is difficult because it is not possible to draw a line between the safety of the process itself and that of the workers. Major sums are involved which are entirely expended before production commences and are included in general or special costs to be amortized over a period of years.
- expenses incurred during production, which in turn include: (1) fixed charges related to accident prevention, notably for medical, safety and educational services and for arrangements for the workers’ participation in the safety programme; (2) fixed charges for accident insurance, plus variable charges in schemes where premiums are based on the number of accidents; (3) varying charges for activities related to accident prevention (these depend largely on accident frequency and severity, and include the cost of training and information activities, safety campaigns, safety programmes and research, and workers’ participation in these activities); (4) costs arising from personal injuries (These include the cost of medical care, transport, grants to accident victims and their families, administrative and legal consequences of accidents, salaries paid to injured persons during their absence from work and to other workers during interruptions to work after an accident and during subsequent inquiries and investigations, and so on.); (5) costs arising from material damage and loss which need not be accompanied by personal injury. In fact, the most typical and expensive material damage in certain branches of industry arises in circumstances other than those which result in personal injury; attention should be concentrated upon the few points in common between the techniques of material damage control and those required for the prevention of personal injury.
- losses arising out of a fall in production or from the costs of introducing special counter-measures, both of which may be very expensive.
In addition to affecting the place where the accident occurred, successive losses may occur at other points in the plant or in associated plants; apart from economic losses which result from work stoppages due to accidents or injuries, account must be taken of the losses resulting when the workers stop work or come out on strike during industrial disputes concerning serious, collective or repeated accidents.
The total value of these costs and losses are by no means the same for every undertaking. The most obvious differences depend on the particular hazards associated with each branch of industry or type of occupation and on the extent to which appropriate safety precautions are applied. Rather than trying to place a value on the initial costs incurred while incorporating accident prevention measures into the system at the earliest stages, many authors have tried to work out the consequential costs. Among these may be cited: Heinrich, who proposed that costs be divided into “direct costs” (particularly insurance) and “indirect costs” (expenses incurred by the manufacturer); Simonds, who proposed dividing the costs into insured costs and non-insured costs; Wallach, who proposed a division under the different headings used for analysing production costs, viz. labour, machinery, maintenance and time expenses; and Compes, who defined the costs as either general costs or individual costs. In all of these examples (with the exception of Wallach), two groups of costs are described which, although differently defined, have many points in common.
In view of the difficulty of estimating overall costs, attempts have been made to arrive at a suitable value for this figure by expressing the indirect cost (uninsured or individual costs) as a multiple of the direct cost (insured or general costs). Heinrich was the first to attempt to obtain a value for this figure and proposed that the indirect costs amounted to four times the direct costs—that is, that the total cost amounts to five times the direct cost. This estimation is valid for the group of undertakings studied by Heinrich, but is not valid for other groups and is even less valid when applied to individual factories. In a number of industries in various industrialized countries this value has been found to be of the order of 1 to 7 (4 ± 75%) but individual studies have shown that this figure can be considerably higher (up to 20 times) and may even vary over a period of time for the same undertaking.
There is no doubt that money spent incorporating accident prevention measures into the system during the initial stages of a manufacturing project will be offset by the reduction of losses and expenses that would otherwise have been incurred. This saving is not, however, subject to any particular law or fixed proportion, and will vary from case to case. It may be found that a small expenditure results in very substantial savings, whereas in another case a much greater expenditure results in very little apparent gain. In making calculations of this kind, allowance should always be made for the time factor, which works in two ways: current expenses may be reduced by amortizing the initial cost over several years, and the probability of an accident occurring, however rare it may be, will increase with the passage of time.
In any given industry, where permitted by societal factors, there may be no financial incentive to reduce accidents in view of the fact that their cost is added to the production cost and is thus passed on to the consumer. This is a different matter, however, when considered from the point of view of an individual undertaking. There may be a great incentive for an undertaking to take steps to avoid the serious economic effects of accidents involving key personnel or essential equipment. This is particularly so in the case of small plants which do not have a reserve of qualified staff, or those engaged in certain specialized activities, as well as in large, complex facilities, such as in the process industry, where the costs of replacement could surpass the capacity to raise capital. There may also be cases where a larger undertaking can be more competitive and thus increase its profits by taking steps to reduce accidents. Furthermore, no undertaking can afford to overlook the financial advantages that stem from maintaining good relations with workers and their trade unions.
As a final point, when passing from the abstract concept of an undertaking to the concrete reality of those who occupy senior positions in the business (i.e., the employer or the senior management), there is a personal incentive which is not only financial and which stems from the desire or the need to further their own career and to avoid the penalties, legal and otherwise, which may befall them in the case of certain types of accident. The cost of occupational accidents, therefore, has repercussions on both the national economy and that of each individual member of the population: there is thus an overall and an individual incentive for everybody to play a part in reducing this cost.
Principles of Prevention: Safety Information
Sources of Safety Information
Manufacturers and employers throughout the world provide a vast amount of safety information to workers, both to encourage safe behaviour and to discourage unsafe behaviour. These sources of safety information include, among others, regulations, codes and standards, industry practices, training courses, Material Safety Data Sheets (MSDSs), written procedures, safety signs, product labels and instruction manuals. Information provided by each of these sources varies in its behavioural objectives, intended audience, content, level of detail, format and mode of presentation. Each source may also design its information so as to be relevant to the different stages of task performance within a potential accident sequence.
Four Stages of the Accident Sequence
The behavioural objectives of particular sources of safety information correspond or “map” naturally to the four different stages of the accident sequence (table 1).
Table 1. Objectives and example sources of safety information mapped to the accident sequence
|
Task stage in accident sequence |
||||
|
Prior to task |
Routine task performance |
Abnormal task conditions |
Accident conditions |
|
|
Objectives |
Educate and persuade worker of the nature and level of risk, precautions, remedial measures and emergency procedures. |
Instruct or remind worker to follow safe procedures or take precautions. |
Alert worker of abnormal conditions. Specify needed actions. |
Indicate locations of safety and first aid equipment, exits and emergency procedures. Specify remedial and emergency procedures. |
|
Example |
Training manuals, videos or programmes, hazard communication programmes, material safety data sheets, safety propaganda, safety feedback |
Instruction manuals, job performance aids, checklists, written procedures, warning signs and labels |
Warning signals: visual, auditory, or olfactory. Temporary tags, signs, barriers or lock-outs |
Safety information signs, labels, and markings, material safety data sheets |
First stage. At the first stage in the accident sequence, sources of information provided prior to the task, such as safety training materials, hazard communication programmes and various forms of safety programme materials (including safety posters and campaigns) are used to educate workers about risks and persuade them to behave safely. Methods of education and persuasion (behaviour modification) attempt not only to reduce errors by improving worker knowledge and skills but also to reduce intentional violations of safety rules by changing unsafe attitudes. Inexperienced workers are often the target audience at this stage, and therefore the safety information is much more detailed in content than at the other stages. It must be emphasized that a well-trained and motivated workforce is a prerequisite for safety information to be effective at the three following stages of the accident sequence.
Second stage. At the second stage in the accident sequence, sources such as written procedures, checklists, instructions, warning signs and product labels can provide critical safety information during routine task performance. This information usually consists of brief statements which either instruct less skilled workers or remind skilled workers to take necessary precautions. Following this approach can help prevent workers from omitting either precautions or other critical steps in a task. Statements providing such information are often embedded at the appropriate stage within step-by-step instructions describing how to perform a task. Warning signs at appropriate locations can play a similar role: for example, a warning sign located at the entrance to a workplace might state that safety hard hats must be worn inside.
Third stage. At the third stage in the accident sequence, highly conspicuous and easily perceived sources of safety information alert workers of abnormal or unusually hazardous conditions. Examples include warning signals, safety markings, tags, signs, barriers or lock-outs. Warning signals can be visual (flashing lights, movements, etc.), auditory (buzzers, horns, tones, etc.), olfactory (odours), tactile (vibrations) or kinaesthetic. Certain warning signals are inherent to products when they are in hazardous states (e.g., the odour released upon opening a container of acetone). Others are designed into machinery or work environments (e.g., the back-up signal on a fork-lift truck). Safety markings refer to methods of non-verbally identifying or highlighting potentially hazardous elements of the environment (e.g., by painting step edges yellow or emergency stops red). Safety tags, barriers, signs or lock-outs are placed at points of hazard and are often used to prevent workers from entering areas or activating equipment during maintenance, repair or other abnormal conditions.
Fourth stage. At the fourth stage in the accident sequence, the focus is on expediting worker performance of emergency procedures at the time an accident is occurring, or on the performance of remedial measures shortly after the accident. Safety information signs and markings conspicuously indicate facts critical to adequate performance of emergency procedures (e.g., the locations of exits, fire extinguishers, first aid stations, emergency showers, eyewash stations or emergency releases). Product safety labels and MSDSs may specify remedial and emergency procedures to be followed.
However, if safety information is to be effective at any stage in the accident sequence, it must first be noticed and understood, and if the information has been previously learned, it must also be remembered. Then the worker must both decide to comply with the provided message and be physically able to do so. Successfully attaining each of these steps for effectiveness can be difficult; however, guidelines describing how to design safety information are of some assistance.
Design Guidelines and Requirements
Standards-making organizations, regulatory agencies and the courts through their decisions have traditionally both instituted guidelines and imposed requirements regarding when and how safety information is to be provided. More recently, there has been a trend towards developing guidelines based on scientific research concerning the factors which influence the effectiveness of safety information.
Legal requirements
In most industrialized countries, government regulations require that certain forms of safety information be provided to workers. For example, in the United States, the Environmental Protection Agency (EPA) has developed several labelling requirements for toxic chemicals. The Department of Transportation (DOT) makes specific provisions regarding the labelling of hazardous materials in transport. The Occupational Safety and Health Administration (OSHA) has promulgated a hazard communication standard that applies to workplaces where toxic or hazardous materials are in use, which requires training, container labelling, MSDSs and other forms of warnings.
In the United States, the failure to warn also can be grounds for litigation holding manufacturers, employers and others liable for injuries incurred by workers. In establishing liability, the Theory of Negligence takes into consideration whether the failure to provide adequate warning is judged to be unreasonable conduct based on (1) the foreseeability of the danger by the manufacturer, (2) the reasonableness of the assumption that a user would realize the danger and (3) the degree of care that the manufacturer took to inform the user of the danger. The Theory of Strict Liability requires only that the failure to warn caused the injury or loss.
Voluntary standards
A large set of existing standards provide voluntary recommendations regarding the use and design of safety information. These standards have been developed by multilateral groups and agencies, such as the United Nations, the European Economic Community (EEC’s EURONORM), the International Organization for Standardization (ISO) and the International Electrotechnical Commission (IEC); and by national groups, such as the American National Standards Institute (ANSI), the British Standards Institute, the Canadian Standards Association, the German Institute for Normalization (DIN) and the Japanese Industrial Standards Committee.
Among consensus standards, those developed by ANSI in the United States are of special significance. Since the mid-1980s, five new ANSI standards focusing on safety signs and labels have been developed and one significant standard has been revised. The new standards are: (1) ANSI Z535.1, Safety Color Code, (2) ANSI Z535.2, Environmental and Facility Safety Signs, (3) ANSI Z535.3, Criteria for Safety Symbols, (4) ANSI Z535.4, Product Safety Signs and Labels, and (5) ANSI Z535.5, Accident Prevention Tags. The recently revised standard is ANSI Z129.1–1988, Hazardous Industrial Chemicals—Precautionary Labeling. Furthermore, ANSI has published the Guide for Developing Product Information.
Design specifications
Design specifications can be found in consensus and governmental safety standards specifying how to design the following:
- Material Safety Data Sheets (MSDSs). The OSHA hazard communication standard specifies that employers must have a MSDS in the workplace for each hazardous chemical used. The standard requires that each sheet be written in English, list its date of preparation and provide the scientific and common names of the hazardous chemical mentioned. It also requires the MSDS to describe (1) physical and chemical characteristics of the hazardous chemical, (2) physical hazards, including potential for fire, explosion and reactivity, (3) health hazards, including signs and symptoms of exposure, and health conditions potentially aggravated by the chemical, (4) the primary route of entry, (5) the OSHA permissible exposure limit, the ACGIH threshold limit value or other recommended limits, (6) carcinogenic properties, (7) generally applicable precautions, (8) generally applicable control measures, (9) emergency and first aid procedures and (10) the name, address and telephone number of a party able to provide, if necessary, additional information on the hazardous chemical and emergency procedures.
- Instructional labels and manuals. Few consensus standards currently specify how to design instructional labels and manuals. This situation is, however, quickly changing. The ANSI Guide for Developing User Product Information was published in 1990, and several other consensus organizations are working on draft documents. Without an overly scientific foundation, the ANSI Consumer Interest Council, which is responsible for the above guidelines, has provided a reasonable outline to manufacturers regarding what to consider in producing instruction/operator manuals. They have included sections entitled: “Organizational Elements”, “Illustrations”, “Instructions”, “Warnings”, “Standards”, “How to Use Language”, and “An Instructions Development Checklist”. While the guideline is brief, the document represents a useful initial effort in this area.
- Safety symbols. Numerous standards throughout the world contain provisions regarding safety symbols. Among such standards, the ANSI Z535.3 standard, Criteria for Safety Symbols, is particularly relevant for industrial users. The standard presents a significant set of selected symbols shown in previous studies to be well understood by workers in the United States. Perhaps more importantly, the standard also specifies methods for designing and evaluating safety symbols. Important provisions include the requirement that (1) new symbols must be correctly identified during testing by at least 85% of 50 or more representative subjects, (2) symbols which don’t meet the above criteria should be used only when equivalent printed verbal messages are also provided and (3) employers and product manufacturers should train workers and users regarding the intended meaning of the symbols. The standard also makes new symbols developed under these guidelines eligible to be considered for inclusion in future revisions of the standard.
- Warning signs, labels and tags. ANSI and other standards provide very specific recommendations regarding the design of warning signs, labels and tags. These include, among other factors, particular signal words and text, colour coding schemes, typography, symbols, arrangement and hazard identification (table 2 ). Among the most popular signal words recommended are: DANGER, to indicate the highest level of hazard; WARNING, to represent an intermediate hazard; and CAUTION, to indicate the lowest level of hazard. Colour coding methods are to be used to consistently associate colours with particular levels of hazard. For example, red is used in all of the standards in table 2 to represent DANGER, the highest level of hazard. Explicit recommendations regarding typography are given in nearly all the systems. The most general commonality between the systems is the recommended use of sans-serif typefaces. Varied recommendations are given regarding the use of symbols and pictographs. The FMC and the Westinghouse systems advocate the use of symbols to define the hazard and to convey the level of hazard (FMC 1985; Westinghouse 1981). Other standards recommend symbols only as a supplement to words. Another area of substantial variation, shown in table 1 , pertains to the recommended label arrangements. The proposed arrangements generally include elements discussed above and specify the image (graphic content or colour), the background (shape, colour); the enclosure (shape, colour) and the surround (shape, colour). Many of the systems also precisely describe the arrangement of the written text and provide guidance regarding methods of hazard identification.
Table 2. Summary of recommendations within selected warning systems
|
System |
Signal words |
Colour coding |
Typography |
Symbols |
Arrangement |
|
ANSI Z129.1 |
Danger |
Not specified |
Not specified |
Skull-and-crossbones as supplement to words. |
Label arrangement not specified; examples given |
|
ANSI Z535.2 |
Danger |
Red |
Sans serif, upper case, |
Symbols and pictographs |
Defines signal word, word message, symbol panels in 1 to 3 panel designs. 4 shapes for special use. Can use ANSI Z535.4 for uniformity. |
|
ANSI Z535.4 |
Danger |
Red |
Sans serif, upper case, |
Symbols and pictographs |
Defines signal word, message, pictorial panels in order of general to specific. Can use ANSI Z535.2 for uniformity. Use ANSI Z129.1 for chemical hazards. |
|
NEMA Guidelines: |
Danger |
Red |
Not specified |
Electric shock symbol |
Defines signal word, hazard, consequences, instructions, symbol. Does not specify order. |
|
SAE J115 Safety Signs |
Danger |
Red |
Sans serif typeface, upper |
Layout to accommodate |
Defines 3 areas: signal word panel, pictorial panel, message panel. Arrange in order of general to specific. |
|
ISO Standard: ISO |
None. 3 kinds of labels: |
Red |
Message panel is added |
Symbols and pictographs |
Pictograph or symbol is placed inside appropriate shape with message panel below if necessary |
|
OSHA 1910.145 Specification for Accident Prevention |
Danger |
Red |
Readable at 5 feet or as |
Biological hazard symbol. Major message can be supplied by pictograph |
Signal word and major message (tags only) |
|
OSHA 1910.1200 |
Per applicable |
In English |
Only as Material Safety Data Sheet |
||
|
Westinghouse |
Danger |
Red |
Helvetica bold and regular |
Symbols and pictographs |
Recommends 5 components: signal word, symbol/pictograph, hazard, result of ignoring warning, avoiding hazard |
Source: Adapted from Lehto and Miller 1986; Lehto and Clark 1990.
Certain standards may also specify the content and wording of warning signs or labels in some detail. For example, ANSI Z129.1 specifies that chemical warning labels must include (1) identification of the chemical product or its hazardous component(s), (2) a signal word, (3) a statement of hazard(s), (4) precautionary measures, (5) instructions in case of contact or exposure, (6) antidotes, (7) notes to physicians, (8) instructions in case of fire and spill or leak and (9) instructions for container handling and storage. This standard also specifies a general format for chemical labels that incorporate these items. The standard also provides extensive and specific recommended wordings for particular messages.
Cognitive guidelines
Design specifications, such as those discussed above, can be useful to developers of safety information. However, many products and situations are not directly addressed by standards or regulations. Certain design specifications may not be scientifically proven, and, in extreme cases, conforming with standards and regulations may actually reduce the effectiveness of safety information. To ensure effectiveness, developers of safety information consequently may need to go beyond safety standards. Recognizing this issue, the International Ergonomics Association (IEA) and International Foundation for Industrial Ergonomics and Safety Research (IFIESR) recently supported an effort to develop guidelines for warning signs and labels (Lehto 1992) which reflect published and unpublished studies on effectiveness and have implications regarding the design of nearly all forms of safety information. Six of these guidelines, presented in slightly modified form, are as follows.
- Match sources of safety information to the level of performance at which critical errors occur for a given population. In specifying what and how safety information is to be provided, this guideline emphasizes the need to focus attention on (1) critical errors that can cause significant damage and (2) the level of worker performance at the time the error is made. This objective often can be attained if sources of safety information are matched to behavioural objectives consistently with the mapping shown in table 1 and discussed earlier.
- Integrate safety information into the task and hazard-related context. Safety information should be provided in a way that makes it likely to be noticed at the time it is most relevant, which almost always is the moment when action needs to be taken. Recent research has confirmed that this principle is true for both the placement of safety messages within instructions and the placement of safety information sources (such as warning signs) in the physical environment. One study showed that people were much more likely to notice and comply with safety precautions when they were included as a step within instructions, rather than separated from instructional text as a separate warning section. It is interesting to observe that many safety standards conversely recommend or require that precautionary and warning information be placed in a separate section.
- Be selective. Providing excessive amounts of safety information increases the time and effort required to find what is relevant to the emergent need. Sources of safety information should consequently focus on providing relevant information which does not exceed what is needed for the immediate purpose. Training programmes should provide the most detailed information. Instruction manuals, MSDSs and other reference sources should be more detailed than warning signs, labels or signals.
- Keep the cost of compliance within a reasonable level. A substantial number of studies have indicated that people become less likely to follow safety precautions when doing so is perceived to involve a significant “cost of compliance”. Safety information should therefore be provided in a way that minimizes the difficulty of complying with its message. Occasionally this goal can be attained by providing the information at a time and location when complying is convenient.
- Make symbols and text as concrete as possible. Research has shown that people are better able to understand concrete, rather than abstract, words and symbols used within safety information. Skill and experience, however, play a major role in determining the value of concreteness. It is not unusual for highly skilled workers to both prefer and better understand abstract terminology.
- Simplify the syntax and grammar of text and combinations of symbols. Writing text that poor readers, or even adequate readers, can comprehend is not an easy task. Numerous guidelines have been developed in attempts to alleviate such problems. Some basic principles are (1) use words and symbols understood by the target audience, (2) use consistent terminology, (3) use short, simple sentences constructed in the standard subject-verb-object form, (4) avoid negations and complex conditional sentences, (5) use the active rather than passive voice, (6) avoid using complex pictographs to describe actions and (7) avoid combining multiple meanings in a single figure.
Satisfying these guidelines requires consideration of a substantial number of detailed issues as addressed in the next section.
Developing Safety Information
The development of safety information meant to accompany products, such as safety warnings, labels and instructions, often requires extensive investigations and development activities involving considerable resources and time. Ideally, such activities (1) coordinate the development of product information with design of the product itself, (2) analyse product features which affect user expectations and behaviours, (3) identify the hazards associated with use and likely misuse of the product, (4) research user perceptions and expectations regarding product function and hazard characteristics and (5) evaluate product information using methods and criteria consistent with the goals of each component of product information. Activities accomplishing these objectives can be grouped into several levels. While in-house product designers are able to accomplish many of the tasks designated, some of these tasks involve the application of methodologies most familiar to professionals with backgrounds in human factors engineering, safety engineering, document design and the communication sciences. Tasks falling within these levels are summarized as follows and are shown in figure 1 :
Figure 1.A model for designing and evaluating product information

Level 0: Product design status
Level 0 is both the starting point for initiating a product information project, and the point at which feedback regarding design alternatives will be received and new iterations at the basic model level will be forwarded. At the initiation of a product information project, the researcher begins with a particular design. The design can be in the concept or prototype stage or as currently being sold and used. A major reason for designating a Level 0 is the recognition that the development of product information must be managed. Such projects require formal budgets, resources, planning, and accountability. The largest benefits to be gained from a systematic product information design are achieved when the product is in the pre-production concept or prototype state. However, applying the methodology to existing products and product information is quite appropriate and extremely valuable.
Level 1: Product type investigations
At least seven tasks should be performed at this stage: (1) document characteristics of the existing product (e.g., parts, operation, assembly and packaging), (2) investigate the design features and accompanying information for similar or competitive products, (3) collect data on accidents for both this product and similar or competitive products, (4) identify human factors and safety research addressing this type of product, (5) identify applicable standards and regulations, (6) analyse government and commercial media attention to this type of product (including recall information) and (7) research the litigation history for this and similar products.
Level 2: Product use and user group research
At least seven tasks should be performed at this stage: (1) determine appropriate methods for use of product (including assembly, installation, use and maintenance), (2) identify existing and potential product user groups, (3) research consumer use, misuse, and knowledge of product or similar products, (4) research user perceptions of product hazards, (5) identify hazards associated with intended use(s) and foreseeable misuse(s) of product, (6) analyse cognitive and behavioural demands during product use and (7) identify likely user errors, their consequences and potential remedies.
After completing the analyses in Levels 1 and 2, product design changes should be considered before proceeding further. In the traditional safety engineering sense, this could be called “engineering the hazard out of the product”. Some modifications may be for the health of the consumer, and some for the benefit of the company as it attempts to produce a marketing success.
Level 3: Information design criteria and prototypes
In Level 3 at least nine tasks are performed: (1) determine from the standards and requirements applying to the particular product which if any of those requirements impose design or performance criteria on this part of the information design, (2) determine those types of tasks for which information is to be provided to users (e.g., operation, assembly, maintenance and disposal), (3) for each type of task information, determine messages to be conveyed to user, (4) determine the mode of communication appropriate for each message (e.g., text, symbols, signals or product features), (5) determine temporal and spatial location of individual messages, (6) develop desired features of information based on messages, modes and placements developed in previous steps, (7) develop prototypes of individual components of product information system (e.g., manuals, labels, warnings, tags, advertisements, packaging and signs), (8) verify that there is consistency across the various types of information (e.g., manuals, advertisements, tags and packaging) and (9) verify that products with other brand names or similar existing products from the same company have consistent information.
After having proceeded through Levels 1, 2 and 3, the researcher will have developed the format and content of information expected to be appropriate. At this point, the researcher may want to provide initial recommendations regarding the redesign of any existing product information before moving on to Level 4.
Level 4: Evaluation and revision
In Level 4 at least six tasks are performed: (1) define evaluation parameters for each prototype component of the product information system, (2) develop an evaluation plan for each prototype component of the product information system, (3) select representative users, installers and so on, to participate in evaluation, (4) execute the evaluation plan, (5) modify product information prototypes and/or the design of the product based on the results obtained during evaluation (several iterations are likely to be necessary) and (6) specify the final text and artwork layout.
Level 5: Publication
Level 5, the actual publication of the information, is reviewed, approved and accomplished as specified. The purpose at this level is to confirm that specifications for designs, including designated logical groupings of material, location and quality of illustrations, and special communication features have been precisely followed, and have not been unintentionally modified by the printer. While the publication activity is usually not under the control of the person developing the information designs, we have found it necessary to verify that such designs are precisely followed, the reason being that printers have been known to take great liberties in manipulating design layout.
Level 6: Post-sale evaluations
The last level of the model deals with the post-sale evaluations, a final check to ensure that the information is indeed fulfilling the goals it was designed to achieve. The information designer as well as the manufacturer gains an opportunity for valuable and educational feedback from this process. Examples of post-sale evaluations include (1) feedback from customer satisfaction programmes, (2) potential summarization of data from warranty fulfilments and warranty response cards, (3) gathering of information from accident investigations involving the same or similar products, (4) monitoring of consensus standards and regulatory activities and (5) monitoring of safety recalls and media attention to similar products.
Theoretical Principles of Job Safety
This presentation covers the theoretical principles of job safety and the general principles for accident prevention. The presentation does not cover work-related illnesses, which, although related, are different in many respects.
Theory of Job Safety
Job safety involves the interrelationship between people and work; materials, equipment and machinery; the environment; and economic considerations such as productivity. Ideally, work should be healthful, not harmful and not unreasonably difficult. For economic reasons, as high a level of productivity as possible must be achieved.
Job safety should start in the planning stage and continue through the various phases of production. Accordingly, requirements for job safety must be asserted before work begins and be implemented throughout the work cycle, so that the results can be appraised for purposes of feedback, among other reasons. The responsibility of supervision toward maintaining the health and safety of those employed in the production process should also be considered during planning. In the manufacturing process, people and objects interact. (The term object is used in the broader sense as expressed in the customary designation “people-(machine)-environment system”. This includes not only technical instruments of work, machines and materials, but all surrounding items such as floors, stairs, electrical current, gas, dusts, atmosphere and so on.)
Worker-Job Relationships
The following three possible relationships within the manufacturing process indicate how personal injury incidents (especially accidents) and harmful working conditions are unintended effects of combining people and the objective working environment for the purpose of production.
- The relationship between the worker and the objective working environment is optimal. This means well-being, job safety and labour-saving methods for the employees as well as the reliability of the objective parts of the system, like machines. It also means no defects, accidents, incidents, near misses (potential incidents) or injuries. The result is improved productivity.
- The worker and the objective working environment are incompatible. This may be because the person is unqualified, equipment or materials are not correct for the job or the operation is poorly organized. Accordingly, the worker is unintentionally overworked or underutilized. Objective parts of the system, like machines, may become unreliable. This creates unsafe conditions and hazards with the potential for near misses (near accidents) and minor incidents resulting in delays in production flow and declining output.
- The relationship between the worker and the objective working environment is completely interrupted and a disruption results, causing damage, personal injury or both, thereby preventing output. This relationship is specifically concerned with the question of job safety in the sense of avoiding accidents.
Principles of Workplace Safety
Because it is apparent that questions of accident prevention can be solved not in isolation, but only in the context of their relationship with production and the working environment, the following principles for accident prevention can be derived:
- Accident prevention must be built into production planning with the goal of avoiding disruptions.
- The ultimate goal is to achieve a production flow that is as unhindered as possible. This results not only in reliability and the elimination of defects, but also in the workers’ well-being, labour-saving methods and job safety.
Some of the practices commonly used in the workplace to achieve job safety and which are necessary for disruption-free production include, but are not limited to the following:
- Workers and supervisors must be informed and aware of the dangers and potential hazards (e.g., through education).
- Workers must be motivated to function safely (behaviour modification).
- Workers must be able to function safely. This is accomplished through certification procedures, training and education.
- The personal working environment should be safe and healthy through the use of administrative or engineering controls, substitution of less hazardous materials or conditions, or by the use of personal protective equipment.
- Equipment, machinery and objects must function safely for their intended use, with operating controls designed to human capabilities.
- Provisions should be made for appropriate emergency response in order to limit the consequences of accidents, incidents and injuries.
The following principles are important in understanding how accident prevention concepts relate to disruption-free production:
- Accident prevention is sometimes considered a social burden instead of a major part of disruption prevention. Disruption prevention is a better motivator than accident prevention, because improved production is expected to result from disruption prevention.
- Measures to ensure workplace safety must be integrated into the measures used to ensure disruption-free production. For example, the instructions on hazards must be an integral part of the general directions governing the flow of production at the workplace.
Accident Theory
An accident (including those that entail injuries) is a sudden and unwanted event, caused by an outside influence, that causes harm to people and results from the interaction of people and objects.
Often the use of the term accident in the workplace is linked with personal injury. Damage to a machine is often referred to as a disruption or damage, but not an accident. Damage to the environment is often called an incident. Accidents, incidents and disruptions which do not result in injury or damage are known as “near accidents” or “near misses”. So while it may be considered appropriate to refer to accidents as cases of injury to workers and to define the terms incident, disruption and damage separately as they apply to objects and the environment, in the context of this article they will all be referred to as accidents.
The conceptual model for the term accident indicates that workplace accidents occur from workers and objects interacting with each other through the release of energy. The cause of an accident can lie in the characteristics of the injured worker (e.g., not capable of performing the work safely) or of the object (e.g., unsafe or unsuitable equipment). The cause can also be another worker (providing erroneous information), supervisor (receiving incomplete job instructions) or trainer (receiving incomplete or incorrect training). The following can be derived for accident prevention:
Assuming that workers as well as their objective environments can be carriers of hazards or dangers, accident prevention would basically consist of eliminating the hazards or dangers, or impeding the consequences by keeping the carriers apart or by minimizing the effects of the energy.
Potential Hazards and Risks
Although a hazard or danger may exist in an object, if the worker and the object are so separate from one another that they cannot come into contact, no accident is possible. For example, if the object has a potential hazard (e.g., a suspended load is moved by a crane), this potential hazard cannot cause an injury so long as there are no people in the effective area of the suspended load. It is only when a worker comes into the area of the crane’s suspended load that an actual hazard or danger to this worker is posed, because an interaction between the worker and the object is possible. It should be noted that objects can also endanger other objects, such as vehicles parked under the crane’s load. Risk, defined as a means of quantifying the hazard, is the product of the anticipated frequency of the damage and the anticipated scope of the damage. Accident risk is correspondingly the product of the anticipated frequency of accidents (relative accident frequency) and anticipated accident severity. Relative accident frequency is the number of accidents per risk-time (accidents per 1 million hours or injuries per work year). The seriousness of the accident can be shown quantitatively with the lost time (e.g., lost work days), class of injury (minor accident or first aid case, reportable injury, lost-time compensation case and fatal accident), type of injury, and cost of injury. This risk data should be recorded empirically and in terms of a theoretical prognosis.
The risks of accidents are different in various workplaces, under various conditions. For example, the risks involved in drilling for oil, using the same workers and identical equipment, differ widely depending on the geography (drilling on land or off shore) and the climate (Arctic exploration or deserts). The level of accident risk depends on:
- the anticipated frequency of error of the worker and the technology (number per 1 million hours, etc.)
- the probability of the errors resulting in accidents (accident: error = 1:x)
- the probability of the seriousness level of the accident.
The acceptance of accident risks also varies widely. High accident risk appears to be acceptable in road traffic whereas a zero base tolerance is expected in the field of nuclear energy. For purposes of accident prevention, it therefore follows that the driving force is the smallest possible acceptance of accident risk.
Causes of Accidents
The occurrence of an accident requires classification on a scale from cause to effect. Three levels must be differentiated:
- the level of the causes of possible and actual accidents
- the level of the accident’s origins
- the level of the accident’s consequences in the form of personal and material damages.
Cause is the reason for the accident. Almost every accident has multiple causes such as hazardous conditions, combinations of factors, courses of events, omissions and so on. For example, causes of an accident involving a burst boiler may include one or a combination of the following reasons: faulty materials in the boiler wall, inadequate training to ensure safe operation, failure of a pressure relief device, or violation of an operating procedure such as overheating. Without one or more of these deficiencies, an accident may not have happened. Other conditions, which are not causal to the accident, should be separated. In the case of the burst boiler, these would include conditions such as information about the time, the ambient temperature and the size of the boiler room.
It is important to differentiate the factors associated with the production process from the accident causes linked to workers (conduct of the immediate operator), the organization (safe work procedures or policies) and technical accident causes (environmental changes and object failures). However, in the final analysis, every accident results from faulty conduct of people, because people are always at the end of the causal chain. For example, if faulty material is determined to be the cause of a boiler bursting, then improper conduct existed either on the part of the builder, manufacturer, tester, installer or owner (e.g., corrosion due to inadequate maintenance). Strictly speaking, there is no such thing as a “technical failure” or technical accident cause. The technology is only the intermediate link to the consequences of the improper conduct. Nevertheless, the normal division of causes into behavioural, technical and organizational is useful, because this points toward which group of people behaved improperly and also helps select the appropriate corrective measures.
As previously stated, most accidents are the result of a combination of causes.
For example, a person slips on an oil spot in a dark, unlighted passageway and hits the sharp edge of a replacement part that is lying there, resulting in a head injury. The immediate causes of the accident are inadequate lighting in the passageway, unsafe floor (oil spot), inadequately skid-free shoe soles, not wearing head protection, and the replacement part not in its proper place. The accident could not have happened if the combination of causes had been eliminated or the causal chain had been broken. Successful accident prevention therefore consists of recognizing the causal chain that leads to an accident and breaking it, so that the accident can no longer occur.
Effect of Strains and Demands
Mechanization and automation of production processes have advanced considerably in recent years. It may appear that the causes of many accidents have shifted from human error to those related to the maintenance of and interface with automated processes. However, these positive consequences of technology are counterposed to other, negative ones, particularly the increase in psychological strains and corresponding ergonomic physical demands on workers in automated plants due to the increased attention and responsibility required for overseeing the automated operations process, impersonal working environment and monotony of work. These strains and corresponding demands increase the occurrence of accidents and can be harmful to health.
- Strains are effects on workers which originate in the workplace, such as environmental strains (temperature, heat, humidity, light, noise and air pollution), or they can be static or dynamic strains originating directly from the work process (lifting, climbing, chemical exposure and so on). Strain levels can be physically measured (noise, force, atmospheric exposures and so on), whereas strain factors are physically unmeasurable influences (fatigue, mental stress, plant worker/management relationships and so on).
- Demands on workers are dependent on the type and degree of the strain as well as differing individual capability to withstand the strain. Effects of demands show up physically and psychologically in the human body. The effects of the demands can be desirable or undesirable, depending on the type and degree. Undesirable effects, such as physical and psychological exhaustion, work aggravations, illness, lack of coordination and concentration, and unsafe behaviour cause increased risk of accident.
For purposes of accident prevention, it follows that workers, based on their individual competencies, capabilities and willingness, should be able to physically and psychologically work safely provided that there are no outside factors such as unsuitable equipment, poor environment or unsatisfactory work conditions. Safety may be improved by organizing the work process to include appropriate stimuli such as planned job changes, expansion of work and tasks, and work enrichment.
Near Accidents (Near Misses)
A large part of production loss results from disruptions in the form of near misses (near accidents), which are the basis of occurrences of accidents. Not every disruption affects work safety. Near accidents (near misses) are those occurrences or incidents in which no injury or damage resulted, but if injury or damage had occurred, they would be classified as accidents. For example, a machine that unexpectedly stops running without damage to the equipment or work is considered to be a near accident. Additionally, the disruption may cause another near accident if the machine suddenly starts up again while a worker is inside trying to determine the cause of the stoppage, but the worker is not injured.
Accident Pyramid
Accidents are relatively rare occurrences, and usually the more serious the accident, the more rare the occurrence. Near accidents form the bottom, or base, of the accident pyramid, whereas fatal accidents stand at the top. If lost time is used as a criterion for the seriousness of accidents, we find a relatively high degree of correspondence with the accident pyramid. (There may be a slight deviation as a result of the reporting requirements of different countries, companies and jurisdictions.)
The accident pyramid can be very different for individual types or classifications of accidents. For example, accidents involving electricity are disproportionately serious. When accidents are classified by occupation, we see that certain types of work activities suffer disproportionately more serious accidents. In both cases the accident pyramid is top-heavy due to the relatively high proportion of serious and fatal accidents.
From the accident pyramid, it follows for purposes of accident prevention that:
- Accident prevention begins with avoiding near accidents (near misses).
- Eliminating minor accidents usually has a positive effect on eliminating serious accidents.
Accident Prevention
The different paths of accident prevention for ensuring workplace safety are as follows:
- Eliminate the hazard or danger so that injury or damage is no longer possible.
- Provide for separation between the worker (or equipment) and the hazard (equal to elimination of the hazard). The danger remains, but an injury (or damage) is not possible since we make sure that the natural zones of influence of workers (equipment) and object (hazard or danger) do not intersect.
- Provide shielding, such as fireproofing, protective clothing and respirators to minimize the hazard. The hazard still exists, but the possibility of an injury or damage is reduced by minimizing the chances of the hazard having an effect by shielding the danger.
- Adapt to the hazard by providing measures such as warning systems, monitoring equipment, information about dangers, motivation for safe behaviour, training and education.
Summary
In 1914, Max Planck (German physicist, 1858–1947) said: “In every science the highest watchword is the task of seeking order and continuity from the abundance of individual experiences and individual facts, in order, by filling the gaps, to integrate them into a coherent view.” This principle also applies to the complex scientific and practical questions of job safety because they not only interface with many different disciplines, but also are themselves multifaceted. While it is difficult, for this reason, to systematize the many problems involved with job safety, it is necessary to properly organize the individual questions according to significance and context, and to pose effective options for improving job safety.
Principles of Prevention: The Public Health Approach to Reducing Injuries in the Workplace
A public health approach to occupational injury prevention is based on the assumption that injury is a health problem, and as such can either be prevented or its consequences mitigated (Occupational Injury Prevention Panel 1992; Smith and Falk 1987; Waller 1985). When a worker falls from a scaffold, the tissue damage, internal haemorrhage, shock and death that follow are, by definition, a disease process—and also by definition a concern for public health professionals. Just as malaria is defined as a disease whose causal agent is a specific protozoan, injuries are a family of diseases caused by exposure to a particular form of energy (kinetic, electrical, thermal, radiation or chemical) (National Committee for Injury Prevention and Control 1989). Drowning, asphyxiation and poisoning are also considered injuries because they represent a relatively rapid departure from the body’s structural or functional norm, as does acute trauma.
As a health problem, injuries are the leading cause of premature death (i.e., before age 65) in most countries (Smith and Falk 1987; Baker et al. 1992; Smith and Barss 1991). In the United States, for example, injury is the third leading cause of death following cardiovascular disease and cancer, the leading cause of hospitalization under the age of 45, and an imposed economic burden of 158 billion dollars in direct and indirect costs in 1985 (Rice et al. 1989). One out of three nonfatal injuries and one out of six fatal injuries to working-aged persons in the United States occur on the job (Baker et al. 1992). Similar patterns apply in most of the developed world (Smith and Barss 1991). In middle- and low-income countries, a rapid and relatively unregulated pace of industrialization may result in a nearly global pandemic of occupational injuries.
Public Health Models for Injury Control
The traditional practice of workplace safety usually focuses on minimizing risks and losses within a single company. Public health practitioners engaged in occupational injury control are interested not only in individual worksites but also in improving the health status of populations in geographic areas that may be exposed to the hazards associated with multiple industries and occupations. Some events such as workplace fatalities may be rare at individual plants, but by studying all fatalities in a community, risk patterns and prevention policy may become evident.
Most models of public health practice are based on three elements: (1) assessment, (2) development of prevention strategies, and (3) evaluation. Public health practice is usually multidisciplinary and founded on the applied science of epidemiology. Epidemiology is the study of the distribution and determinants of diseases and injuries in a population. The three main applications of epidemiology are surveillance, aetiological research and evaluation.
Surveillance is “the ongoing and systematic collection, analysis and interpretation of health data in the process of describing and monitoring a health event. This information is used for planning, implementing and evaluating public health interventions and programs” (CDC 1988).
Aetiological research tests hypotheses regarding the determinants of disease and injuries through the use of controlled, usually observational, studies.
Evaluation in both applied social sciences and epidemiology is “a process that attempts to determine as systematically and objectively as possible the relevance, effectiveness and impact of activities in light of their objectives” (Last 1988). Epidemiological evaluation usually entails the use of controlled study designs to measure the effects of an intervention on the occurrence of health-related events in a population.
The basic model of public health practice is described by a cycle of epidemiological surveillance, research on causes, interventions (targeted to high-risk populations and specific to severe health conditions), and epidemiological evaluation. Important modifications of this model include community-oriented primary care (Tollman 1991), community-based health education and health promotion (Green and Kreuter 1991), community health development (Steckler et al. 1993), participatory action research (Hugentobler, Israel and Schurman 1992) and other forms of community-oriented public health practice that rely on greater participation of communities and labour—as opposed to government officials and industrial management—to define problems, develop solutions and evaluate their effectiveness. Family farming, fishing and hunting, self-employed work, many small business operations and work in the informal economy are all primarily influenced by family and community systems and occur outside the context of an industrial management system. Community-oriented public health practice is a particularly viable approach to occupational injury prevention in these populations.
Outcomes of Interest
The public health approach to workplace safety moves from the concept of accident prevention to a broader approach to injury control where the primary outcomes of interest are both the occurrence and severity of injury. Injury is by definition physical damage due to the transfer of energy. A transfer of mechanical energy can cause trauma, as in the case of a fall or automobile crash. Thermal, chemical, electrical or radiation energy can cause burns and other injuries (Robertson 1992). Not only is the occurrence of injury of interest to public health practitioners, but so is the severity and long-term outcome of injury. Injury severity can be measured in several dimensions, including anatomical (the amount and nature of tissue damage in various regions of the body), physiological (how close to death the patient is, based on vital signs), disability, impairment of quality of life, and indirect and direct costs. Of considerable importance to injury epidemiologists is anatomical severity, often measured by the Abbreviated Injury Score and the Injury Severity Scale (MacKenzie, Steinwachs and Shankar 1989). These measures can predict survival and are a useful indicator of the energy transferred in severe events, but are not sensitive enough to discriminate between severity levels among the relatively less severe, but much more frequent occupational injuries such as sprains and strains.
Among the least useful, but most common measures of severity is days lost from work following injury. From an epidemiological point of view, lost work days are often difficult to interpret because they are a function of some unknown combination of disability, demands of the job, availability of alternative light work, workplace policies such as sick leave, disability qualification criteria and individual differences in pain tolerance, the propensity to work with pain, and possibly the same factors that motivate attendance. More work is needed to develop and validate more interpretable occupational injury severity measures, particularly anatomical scales, disability scales and measures of impairment in the various dimensions of quality of life.
Unlike traditional safety practice, the public health community is not restricted to an interest in unintentional (“accidental”) injuries and the events that cause them. Through looking at the individual causes of fatalities in the workplace, it was found, for example, that in the United States, homicide (an intentional injury) is the leading cause of death at work among women and the third leading cause among men (Baker et al. 1992; Jenkins et al. 1993). Such fatalities are very rare events in individual workplaces and thus their importance is often overlooked, as is the fact that motor vehicle injuries are the single leading cause of fatal injuries on the job (figure 1). Based on these surveillance data, injuries and death due to violence in the workplace and to motor vehicle crashes are priorities in the public health approach to occupational injury prevention in the United States.
Figure 1.Leading causes of work-related injury/death, US 1980-1989
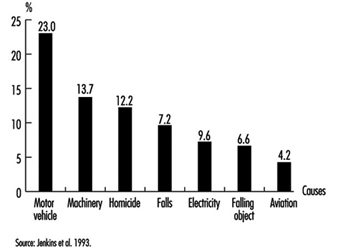
Assessment in Public Health
Assessment in public health is a multidisciplinary effort which involves surveillance, aetiological research, and community and organizational needs assessment. The purpose of injury surveillance is to identify high-risk populations, to identify injuries with significant public health impact, to detect and monitor trends and to generate hypotheses. Surveillance programmes can collect data on injury fatalities, non-fatal injuries, incidents with injury potential, and exposure to hazards. Data sources for occupational injury surveillance include health care providers (hospitals and physicians), death certificates, medical examiner/coroner reports, employer-based reporting to departments of labour or health, workers’ compensation agencies, periodic surveys of employers or households, and individual corporate records. Many of these reports and records are required by law but often offer incomplete information due to a lack of coverage of all workers, incentives to under-report, and a poor level of specificity in injury details.
In-depth investigations of individual incidents employ a variety of approaches which permit the use of expert judgement to draw conclusions about what caused the event and how it could have been prevented (Ferry 1988). Preventive action is often taken based on the findings from a single incident. Rate-based surveillance, on the other hand, has a broader significance than the individual incident. Indeed, some information from traditional accident investigations can have little epidemiological interpretation when aggregated into statistics. Accident investigation in the tradition of Heinrich (1959), for example, often produces statistics indicating that in excess of 80 of industrial injuries are caused solely by unsafe acts. From an epidemiological point of view, such statistics are difficult to interpret except as a survey of value judgements, and are rarely included in rate-based surveillance. Many other risk factors such as shift work, work stress, poorly designed work environments and so on, are often not included in investigation forms and thus are not considered in examining statistics on injury causes.
One of the primary purposes of surveillance is to identify high-risk groups in order to target further investigation and prevention. Injuries, like infectious and chronic diseases, have distinct patterns of risk that vary by age, sex, race, geographic region, industry and occupation (Baker et al. 1992). In the United States during the 1980s, for example, surveillance by the National Institute for Occupational Safety and Health (NIOSH) revealed the following high-risk groups for occupational injury fatality: males; elderly workers; blacks; workers in rural Western states; transportation and materials moving occupations; farming, forestry and fishing occupations; and labourers (Jenkins et al. 1993). Another important aspect of surveillance is to identify the types of injury that occur with the greatest frequency and severity, such as the leading external causes of work-related injury fatality in the United States (see figure 1 ). At an individual company level, problems such as homicide and motor vehicle fatalities are rare events and thus are seldom addressed by many traditional safety programmes. However, national surveillance data identified these among the three leading causes of occupational injury fatalities. Assessing the impact of non-fatal injuries requires the use of severity measures in order to make meaningful interpretations. For example, back injuries are a common cause of lost days of work, but an infrequent cause of hospitalization for work-related injuries.
Surveillance data alone do not represent a complete assessment in the public health tradition. Particularly in community-oriented public health practice, needs assessment and community diagnosis using surveys, focus groups and other techniques are important steps to assess what problems workers or communities perceive are important, what are the prevalent attitudes, intentions and barriers regarding the adoption of prevention measures, and how an organization or community really functions. A community-based agricultural safety programme, for example, might need to identify whether or not farmers perceive that tractor rollovers are a critical problem, what barriers such as financial or time constraints may prevent the installation of rollover protective structures, and through whom an intervention strategy should be implemented (e.g., trade association, youth organization, organization of farm wives). In addition to a diagnosis of the community, organizational needs assessment identifies an organization’s capacity, workload and constraints to implement fully any already existing prevention programmes such as the enforcement activities of a governmental department of labour (or health) or the safety department of a large corporation.
Investigating the aetiology or causation of loss incidents and injuries is another step in the public health approach to occupational injury control. Such studies of occupational disease have been the mainstay of developing disease-control programmes in the workplace. Aetiological research involves the application of epidemiology to identify risk factors for injury. It also involves applied social sciences to identify the determinants of organizational and individual behaviours that lead to unsafe conditions. Epidemiological research seeks to identify modifiable risk factors through the use of controlled, usually observational study designs such as the case-control study, the cohort study, the panel study and the cross-sectional study. As with epidemiological studies of other acute health events (e.g., asthma attacks, sudden cardiac arrests), aetiological research on injuries is challenged by the need to study either rare or recurrent events that are highly influenced by situational exposures that occur immediately before the event (e.g., distraction by impact noise) and by social and behavioural constructs that are difficult to measure (e.g., safety climate, job strain) (Veazie et al. 1994). Only recently have epidemiological and statistical methods been developed to accommodate the study of these types of health events.
Epidemiological studies that focus on the occurrence of injury are expensive and are not always needed. It does not require a controlled epidemiological study to document the impact of a lack of machine guarding on amputations due to a particular machine; a series of case investigations would suffice. Similarly, if an easily measurable individual behaviour such as failing to use a seat-belt is already a known risk factor, then studies focusing on the determinants of the behaviour and how to improve usage rates, are more useful than studying the injury. However, controlled epidemiological studies of injury and injury severity are needed to provide an understanding of a variety of causal mechanisms that are responsible for decrements in the performance of humans or technology that are difficult to measure. The effect of noise exposure or shift work, for example, on the risk and severity of injury is unlikely to be quantified by case investigations or by studies of easy-to-measure behaviours.
A recent review of studies on risk factors of occupational injuries revealed that age, job title, physical attributes or impairments and experience in the job or task were the most commonly studied human variables (Veazie et al. 1994). Shift work and scheduling were the most commonly studied job content variables. The work environment was the least studied. Most environment factors related to design features or recognized material hazards. Some studies examined factors in the organization and social environment. A few studies evaluated physical stressors such as heat and noise exposure as risk factors for injury. Many of these studies were of poor methodological quality, and few were replicated in different populations. Thus, little is known about risk factors for injury at work, except for the most obvious immediate causes. Future research may benefit by examining the impact on injury rates of risk factors predicted by theory in human factors, ergonomics, occupational stress and organizational behaviour. These may include design and scheduling of tasks and jobs, psychosocial factors (e.g., worker control, social support, psychological demands), and organizational structure and change (e.g., continuous quality improvement and management commitment to safety).
The public health approach also integrates injury epidemiology with the applied behavioural sciences (particularly health promotion, health behaviour and health policy research) to identify the modifiable, environmental reasons for unsafe worker behaviour and, most important, for behaviours on the part of employers and managers that lead to the creation and persistence of hazards. In the large organizational setting, this effort must involve research in organizational behaviour and industrial psychology. Thus, the assessment phase in the public health approach involves epidemiological surveillance, in-depth investigations, community and organizational needs assessment, and aetiological research based on the application of epidemiology and applied behavioural sciences.
Prevention Strategies
A number of principles guide the selection and implementation of prevention measures in a public health approach to injury control. These include:
(1) The importance of basing prevention measures on prior assessment and evaluation. The first principle acknowledges the importance of selecting interventions that are targeted to have a high impact on community health status and are likely to be successfully implemented. Thus, interventions selected on the basis of a thorough assessment phase, rather than merely common sense, are more likely to be effective. Interventions that have been demonstrated as effective in the past are even more promising. Unfortunately, very few occupational injury interventions have been scientifically evaluated (Goldenhar and Schulte 1994).
(2) The relative importance of control measures that automatically protect the worker. The second principle emphasizes the continuum between active and passive protection. Active protection is that which requires constant repetitive individual action; passive protection offers relatively automatic protection. For example, seat-belts require individual action to initiate protection each time someone gets into a vehicle. An air bag, on the other hand, bestows protection on a vehicle occupant without any initiating action—it automatically protects that person. Active interventions require modifying and sustaining individual behaviour change, which has been the least successful of injury prevention strategies to date. This principle is similar to the traditional hierarchy of controls in occupational safety which emphasizes the importance of engineering controls over administrative controls, personal protective equipment and training.
(3) The importance of behaviour modification rather than education. The third principle recognizes the importance of behaviour modification and that not all hazards can be engineered out of the environment at the manufacturing stage. Modification of the behaviour of employers, managers and employees is central, not only to the installation and maintenance of passive protection, but to most other occupational injury control strategies as well. Another important aspect of this principle is that classroom instruction, posters, pamphlets and other forms of education that merely seek to increase knowledge, usually have little effect on behaviour when used alone. Most health behaviour theories applied in health promotion focus on a variety of factors that motivate behaviour change other than awareness of a physical hazard or safe behaviour. The Health Belief Model, for example, emphasizes that self-protective behaviour is most influenced by the perception of risk, the perception of severity and the perception of the benefits and barriers associated with taking protective action (Green and Kreuter 1991).
While credible educational messages may alter some of these perceptions, sometimes the best way to alter these perceptions is to change the physical and social environment. A potentially effective approach to behaviour modification is to redesign equipment and the physical environment to make safe behaviour easier, quicker, and more comfortable or socially desirable than unsafe behaviour. If the layout of machine shop equipment is designed to make walking through hazardous zones difficult and unnecessary, then this unsafe behaviour will be reduced. Similarly, if hard hats are designed to be comfortable and to enhance the social image of the construction worker, they may be used more often.
The social environment can also be modified to change behaviour. For example, legislation and enforcement is another far-reaching strategy in injury prevention that changes behaviour and extends beyond education alone. Seat-belt laws and laws requiring the use of infant safety seats, for example, have dramatically reduced motor vehicle fatalities in the United States. The effect of legislation and enforcement on occupational safety, however, is less well-described. One notable exception is the documented clear, dramatic decline in US mine fatalities that followed the implementation of the Federal Coal Mine Health and Safety Act of 1969 (figure 2 ). The resources and administrative authority devoted to mine safety enforcement is, however, much greater than that available to most other agencies (Weeks 1991).
Figure 2.Coal mining regulations and mortality rates, US 1950-1990
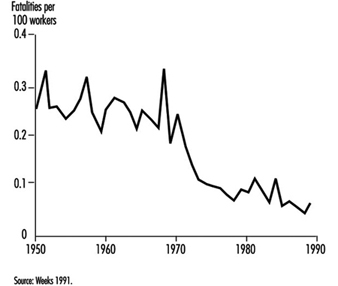
Well-designed occupational safety training often involves modifying the social environment by including a role modelling process, incentives, and feedback on safety performance (Johnston, Cattledge and Collins 1994). Another form of training, labour education, represents an altered social environment (Wallerstein and Baker 1994). It empowers workers to recognize hazards and to modify the behaviour of their employers so as to reduce those hazards. While education alone is not usually sufficient, it is usually a necessary component of any injury prevention programme (Gielen 1992). Educating employers and employees is a necessary part of the implementation of a specific injury prevention programme. Educating legislators, policy makers, health care providers and others is also important to initiating and sustaining community-wide injury prevention efforts. Indeed, interventions most likely to succeed in the field use a multifaceted approach which combines environmental modifications with policy changes and education (National Committee for Injury Prevention and Control 1989).
(4) Systematic consideration of all available options, including those that reduce not only injury occurrence but the severity and long-term consequences of injuries. The fourth principle is that the process of choosing interventions should systematically consider a wide range of options. The choice of countermeasures should not be determined by the relative importance of the causal factors or by their earliness in the sequence of events; rather priority must be given to those which most effectively reduce injury. A useful scheme for systematically considering injury control options was proposed by Haddon (1972). The Haddon Matrix reveals that interventions targeted at humans, the vehicles which can transfer damaging energy (e.g., cars, machinery), or the physical or psychosocial environment may operate to control injury in the pre-event, event or post-event phases. Table 1 shows the application of the Haddon Matrix to the problem of preventing motor vehicle injuries, which are the leading cause of occupational injury fatalities in many countries.
Table 1. The Haddon Matrix applied to motor vehicle injuries
|
Phases |
Factors |
||
|
Human |
Vehicles and equipment |
Environment |
|
|
Pre-event |
Educate public in the use of seat-belts and child restraints |
Safe brakes and tires |
Improved road design; restrict alcohol advertising and availability at gas stations |
|
Event |
Prevention of osteoporosis to decrease likelihood of fracture |
Air bags and a crashworthy vehicle design |
Breakaway utility poles and crash barriers |
|
Post-event |
Treatment of haemophilia and other conditions that result in impaired healing |
Safe design of fuel tank to prevent rupture and fire |
Adequate emergency medical care and rehabilitation |
Source: National Committee for Injury Prevention and Control 1989.
Traditional occupational safety interventions most often operate in the pre-event phase to prevent the initiation of an incident with potential to cause injury (i.e., an accident). Event phase interventions such as building cars to be more crashworthy or using safety lanyards while working at elevations, do not prevent accidents, but minimize the probability and severity of injury. After the event is over—the cars in a crash have stopped moving or the worker has stopped falling—post-event interventions such as first aid and prompt transport to appropriate surgical care seek to minimize the health consequences of injury (i.e., the probability of death or long-term disability).
In the public health approach, it is important to avoid getting locked into one phase of the matrix. Just as injury is multifactorial in causation, prevention strategies should address as many phases and aspects of injury as possible (but not necessarily all). The Haddon Matrix, for example, emphasizes that injury control is not limited to preventing accidents. In fact, many of our most effective control strategies do not prevent accidents or even injuries, but can considerably reduce their severity. Seat-belts and air bags in cars, safety helmets, fall protection in construction, rollover protective structures in agriculture, and emergency eyewash fountains in the laboratory are but a few examples of event-phase strategies that do nothing to prevent an accident from occurring. Instead, they reduce the severity of injury after the accident has been initiated. Even after the anatomical damage has been done, much can be done to reduce the risk of death and long-term disability. In the United States, it has been estimated that many major trauma deaths could be prevented by systems that minimize the time delay between injury and definitive surgical care. This broader framework is called injury control and goes far beyond traditional accident prevention. A commonly used phrase to illustrate this point is “Injuries are not an accident”. They can be predicted and their impact on society controlled.
Another useful scheme often used for systematically considering injury control options is Haddon’s Ten Countermeasure Strategies (Haddon 1973). Table 2 shows how these strategies can be applied to controlling injury from falls in construction. As shown, not all strategies will be applicable for specific problems.
(5) Involvement of the community, workers and management. The fifth principle is the importance of involving the target population (communities, workers, managers) in choosing and implementing intervention strategies. Cost, feasibility, convenience and acceptability can all be barriers to developing effective prevention strategies (Schelp 1988).
Table 2. Haddon’s Ten Countermeasure Strategies applied to injuries due to falls in construction
|
Countermeasure |
Intervention (and relevant notes) |
|
Prevent the creation of the hazard. |
Do not construct buildings—generally not a practical option, to be sure. |
|
Reduce the amount of the hazard |
Lower the height of construction project to below fatal levels—usually not practical, but may be possible in some work zones. |
|
Prevent the release of the hazard. |
Install non-slip walking surfaces on roofs and other heights. |
|
Modify the rate of release of the hazard from |
Use safety lanyards. Use safety nets. |
|
Separate the hazard from the worker by time and space. |
Do not schedule unnecessary foot traffic near fall hazards until the hazards are abated. |
|
Separate the hazard from the worker by physical barriers. |
Install guardrails on elevated surfaces. |
|
Modify basic qualities of the hazard. |
Remove sharp or protruding projections on the ground surface where workers can |
|
Make worker as injury resistant as possible. |
Require, e.g., safety helmets. |
|
Begin to counter damage done by the hazard. |
Apply first aid. |
|
Stabilize, treat and rehabilitate worker. |
Develop a regionalized trauma system; provide |
Evaluation in Public Health
Evaluation in both applied social sciences and epidemiology is “a process that attempts to determine as systematically and objectively as possible the relevance, effectiveness and impact of activities in light of their objectives” (Last 1988). Evaluation is an essential component of public health practice. It occurs at two levels. The first level relies on surveillance systems to determine whether or not entire communities have met their disease and injury reduction objectives, without attempting to determine what caused the observed changes. Federal, state and local government agencies in the United States, for example, have set objectives for the year 2000. One of these objectives is to reduce work-related injures resulting in medical treatment, lost time from work, or restricted work activity to no more than 6 cases per 100 full-time workers per year. Progress in meeting these objectives will be monitored with the national surveillance systems in place.
The second level of evaluation focuses on determining the effectiveness of policies, programmes and specific interventions. Ideally, this requires the application of controlled experimental or quasi-experimental study designs. Mohr and Clemmer (1989), for example, conducted a time series study of injury rates in those mobile off-shore oil rigs that opted to implement a new technology to assist workers in connecting drill pipes, compared with rates in those rigs that did not have the new technology. Although injury rates were going down over the period of the installation of the new equipment, the authors were able to attribute a decrease of 6 injuries per 100 workers per year to the new safety equipment and to demonstrate that the savings from injury prevention resulted in a full recovery of the initial capital and installation costs within 5.7 years. Unfortunately, this type of scientific evaluation of programmes and interventions in occupational health and safety is rare and often methodologically flawed (Goldenhar and Schulte 1994).
Summary
The above-mentioned programme demonstrates well the various components in the public health approach to reducing injuries in the workplace. Assessing the injury problem and establishing an ongoing surveillance system was an essential part of this and earlier studies of injuries on oil rigs that were conducted by these authors. The subsequent development of a simple engineering prevention strategy was then followed by a rigorous evaluation strategy which included an evaluation of cost savings. Such studies have been the mainstay of the public health approach to the prevention of other occupational diseases. In the future, the integration of occupational injury prevention into the assessment, intervention and evaluation phases of public health practice has the potential to be an important step toward more effective protection and promotion of health in communities.
MAIM: The Merseyside Accident Information Model
Generally speaking, the term accident is used to denote events resulting in undesired or unplanned physical injury or damage; an accident model is a conceptual scheme applied to the analysis of such events. (Some models may explicitly declare that “near accidents”—sometimes known as “near misses”—are covered by the model; however, the distinction is not important to this article.) Models of accidents can serve different purposes. First, they may provide a conceptual understanding of how accidents occur. Second, models may be used to record and store information on accidents. Third, they may provide a mechanism for investigating accidents. These three aims are not entirely distinct, but form a useful means of categorization.
This article describes MAIM, the Merseyside Accident Information Model, which is most naturally adapted to the second purpose—recording and storing accident information. Following an outline of the rationale for MAIM, some early studies evaluating the model are described. The article ends with recent progress with MAIM, including the use of “intelligent software” to collect and analyse information on injury accidents.
Early Accident Modelling
In Heinrich’s model (1931), the causal sequence leading to an accident was likened to a sequence of five falling dominoes, each of the first four being necessary before the final event could occur. In a precursor to MAIM, Manning (1971) concluded that “the basic requirements of an accidental injury are the presence of a host [a worker, for example] and an environmental object which contributes to the accident. The host or the object or both move in relation to each other.” Kjellén and Larsson (1981) developed their own model, which posited two levels: the accident sequence and the underlying, determining factors. In a later paper, Kjellén and Hovden (1993) described subsequent progress in the context of other literature and noted the need for “efficient use of existing information from routine accident and near accident reports by means of a powerful information retrieval system”. This has been achieved for MAIM.
Rationale for MAIM
There appears to be a substantial consensus that useful information on accidents should not merely concentrate on the immediate circumstances of the damage or injury, but should also include an understanding of the preceding chain of events and factors causing the accident sequence to occur. Some early classification systems failed to achieve this. Understanding objects, movements (of people or objects) and events were commonly mixed and successive events were not distinguished.
A simple example illustrates the problem. A worker slips on a patch of oil, falls and strikes his or her head on a machine and suffers a concussion. We can easily distinguish the (immediate) cause of the accident (slipping on oil) and the cause of the injury (hitting the head on the machine). Some classification systems, however, include the categories “falls of persons” and “striking against objects”. The accident could be allocated to either of these, although neither describes even the immediate cause of the accident (slipping on oil) or causal factors (such as how did the oil get on the floor).
Essentially, the problem is that just one factor is considered in a multifactorial situation. An accident does not always consist of a single event; there may be many. These points formed the basis for the development of MAIM by Derek Manning, an occupational physician.
Description of MAIM
The centrepiece of the accident is the first unforeseen (undesired or unplanned) event involving the damaged equipment or injured person (figure 1). This will not always be the first event in the accident process described as a preceding event. In the example above, the slip counts as the first unforeseen event of the accident. (Given the presence of oil patches on the floor, it is not unforeseen that someone will slip on one and fall, but the person walking does not foresee this.)
Figure 1. The MAIM Accident Model
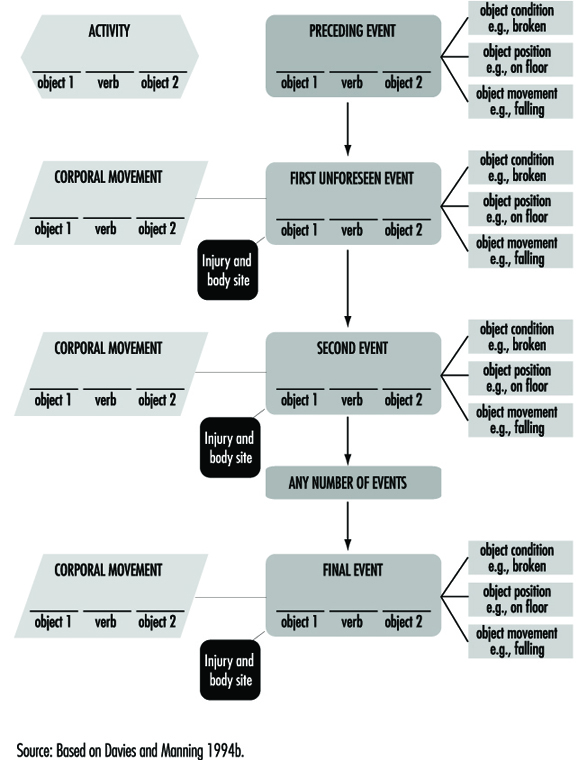
The behaviour of the equipment or person is described by the general activity at the time and a more specific description of the type of corporal movement when the first event occurred. Objects involved are described, and for those related to events, characteristics of objects include position, movement and condition. On occasion, a second object which inter-relates with the first object may be involved (for example, striking a chisel with a hammer).
As noted above, there may be more than one event and the second event may also have an object (perhaps different) involved in it. Additionally, the equipment or person may make an additional corporal movement, such as throwing out a hand to prevent or break a fall. These can be included in the model. A third fourth or later event may occur before the sequence finally leads to an injury. The model can be expanded in all directions by recording factors related to each component. For example, branches from activities and corporal movements would record psychological factors, medications or physical limitations of a worker.
In general, separate events may be easily distinguished intuitively, but a stricter definition is useful: an event is an unexpected change, or lack of change, in the energy state of the situation. (The term energy includes both kinetic and potential energy.) The first event is always unexpected. Subsequent events may be expected, even inevitable, after the first event, but are always unexpected before the accident. An example of unexpected lack of change of energy is when a hammer being swung misses the nail at which it is aimed. The example of a worker who slips on a patch of oil, falls and hits his or her head provides an illustration. The first event is “foot slipped”—instead of remaining still, the foot acquires kinetic energy. The second event is “fell”, when further kinetic energy is acquired. This energy is absorbed by the collision of the worker’s head with the machine when the injury occurs and the sequence ends. This can be “plotted” onto the model as follows:
- 1st event: foot slipped on oil.
- 2nd event: person fell.
- 3rd event: head struck against machine.
Experience with MAIM
An earlier version of the MAIM model was used in a study of all 2,428 reported accidents in 1973 in a gearbox manufacturing plant on the grounds of an automobile company. (See Shannon 1978 for further details.) The operations included cutting and grinding of gears, heat treatment and gearbox assembly. The cutting process produced sharp metal splinters and shavings, and oil was used as a coolant. Purpose-designed forms were used to collect information. Each accident was plotted independently onto the model by two people and discrepancies were resolved by discussion. For each accident, the components were given numerical codes, so the data could be stored on a computer and analyses performed. The following outlines some basic results and presents an examination made what was learned specifically from the use of the model.
The accident rate was substantially reduced (by nearly 40%), apparently as a result of the study being conducted. The researchers learned that because of the additional questioning that the study called for (and the consequent time involved) many employees “could not be bothered” to report minor injuries. Several items of evidence confirmed this:
- The rate rose again in 1975 after the study ended.
- The rate of lost-time injuries was unaffected.
- Visits to the medical centre for non-industrial complaints were unaffected.
- Accident rates on the rest of the grounds were unaffected.
Thus the reduced rate did indeed appear to be an artefact of reporting.
Another interesting finding was that there were 217 injuries (8%) for which the workers involved could not be certain how or when they occurred. This was discovered because workers were explicitly asked if they were sure of what happened. Typically, the injuries involved were cuts or splinters, relatively common given the nature of work at this plant.
Of the remaining accidents, nearly half (1,102) consisted of just one event. Two- and three-event accidents were successively less common, and 58 accidents involved four or more events. There was a marked increase in the proportion of accidents resulting in lost time with an increase in the number of events. One possible explanation is that there was an increase in kinetic energy with each event, so that with more events, there was more energy to dissipate when the worker and the object involved collided.
Further examination of differences between lost-time and non-lost-time accidents found very marked differences in the distributions for separate components of the model. For example, when the first event was “person slipped”, nearly a quarter of the accidents resulted in lost time; but for “body punctured by”, only 1% did so. For combinations of components, such differences were accentuated. For example, with respect to the final events and related objects, none of the 132 accidents in which the casualty was “punctured by” or “splintered” resulted in lost time, but when the final event was “strained/sprained” with “no object involved”, 40% of the injuries caused lost time.
These results contradicted the view that the severity of injury is largely a matter of luck and prevention of all types of accidents would lead to a reduction of serious injuries. This means that analysing all accidents and attempting to prevent the most common types would not necessarily have an effect on those causing serious injuries.
A sub-study was conducted to assess the usefulness of information in the model. Several potential uses of accident data were identified:
- to measure safety performance—the extent to which accidents in a plant, or area of a plant, continue to occur over time
- to identify causes
- to identify errors (in the broadest meaning of the term)
- to check on control—that is, to see whether safety measures taken to prevent some type(s) of accident are indeed effective
- to provide a basis of expertise, as knowledge of a wide range of accident situations and circumstances might help provide accident prevention advice.
Three safety officers (practitioners) rated the usefulness of the verbal descriptions and the plotted models for a series of accidents. Each rated at least 75 accidents on a scale from 0 (no useful information) to 5 (perfectly adequate for use). For the majority of accidents, the ratings were identical—that is, no information was lost in the transfer from the written descriptions to the model. Where there was a loss of information it was mostly just one point on the 0 to 5 scale—that is, only a small loss.
The information available, though, was rarely “perfectly adequate”. This was partly because the safety officers were used to conducting detailed on-the-spot investigations, something not done in this study because all reported accidents, both minor and more serious ones, were included. It should be remembered, however, that the information plotted onto the models was taken directly from written descriptions. Since relatively little information was lost, this suggested the possibility of excluding the intermediate step. The more widespread use of personal computers and availability of improved software make automated data collection possible—and allow checklists to be used by way of insuring that all relevant information is obtained. A program has been written for this purpose and has undergone some initial testing.
MAIM Intelligent Software
The MAIM model was used by Troup, Davies and Manning (1988) to investigate accidents causing back injuries. A database was created on an IBM PC by coding results from patient interviews conducted by an interviewer who was experienced with the MAIM model. The analysis of interviews to obtain the MAIM description (figure 2 ) was done by the interviewer and it was only at this stage that the data were entered into the database. While the method was quite satisfactory, there were potential problems in making the method generally accessible. In particular, two areas of expertise were required—interviewing skills and the familiarity with the analysis needed to form the MAIM description of the accident.
Figure 2. Accident summary as recorded by patient interview

Software was developed by Davies and Manning (1994a) to conduct a patient interview and produce a database of accidents using the MAIM model. The purpose of the software was to provide two areas of expertise—the interview and the analysis to form the MAIM event structure. The MAIM software is, in effect, an intelligent “front end” to a database, and by 1991 it was sufficiently developed to be tested in a clinical environment. The MAIM software was designed to interact with the patient by means of “menus”—the patient selects options from lists which require only the use of cursor keys and the “Enter” key. The choice of an item from the list of options affected to some extent the path through the interview and also had the effect of recording information at the appropriate part of the MAIM description of the accident. This method of data collection eliminated the need for spelling and typing skills and also gave a repeatable and consistent interview.
The event structure of the MAIM model uses verbs and objects to form simple sentences. Verbs in events can be associated with different accident scenarios, and this property of the model forms the basis for the construction of a set of linked questions that form an interview. Questions are presented in such a way that at any stage only simple choices are needed, effectively breaking the complex account of the accident into a set of simple descriptions. Once an event verb has been identified, associated nouns can be found by locating the objects to form a sentence giving the full detail of the description of the particular event. It is clear that this strategy requires the use of an extensive dictionary of objects which can be searched quickly and efficiently.
The Home Accident Surveillance System (HASS) (Department of Trade and Industry 1987) monitors objects involved in accidents, and the list of objects used by HASS was used as the basis of an object dictionary for the MAIM software and was extended to include objects found in the workplace. Objects can be grouped into classes, and with this structure a hierarchical menu system can be defined—classes of objects form layers that correspond to menu lists. Thus a linked list of associated objects can be used to locate individual items. As an example, the object hammer could be found by selecting, in order: (1) tools, (2) hand tools and (3) hammer from three successive menu lists. A given object could potentially be classified into several different groups—for example, a knife could be associated with kitchen items, tools or sharp objects. This observation was used to create redundant links in the object dictionary, allowing many different paths to find the required object. The object dictionary currently has a vocabulary of about 2,000 entries covering work and leisure environments.
The MAIM interview also collects information on activities at the time of the accident, corporal movements, the location of the accident, contributory factors, injuries and disability. All of these elements can occur more than once in an accident, and this is reflected in the structure of the underlying relational database which was used to record the accident.
At the end of the interview, several sentences describing events in the accident will have been recorded and the patient is asked to put them in the correct order. In addition, the patient is asked to link injuries with the recorded events. A summary of the information collected is then presented on the screen of the computer for information.
An example of an accident summary as seen by the patient is shown in figure 2 . This accident has been superimposed on the MAIM diagram in figure 2 . Details relating to factors and the location of the accident have been omitted.
The first unforeseen or unintended event (first event) involving the injured person is usually the first event in the accident sequence. For example, when a person slips and falls, the slip is normally the first event in the accident sequence. If, on the other hand, a person is injured by a machine because another person operates the machine before the victim is standing clear, the first event involving the victim is “trapped by machine” but the first event in the accident sequence is “other person operated machine prematurely”. In the MAIM software, the first event in the accident sequence is recorded and it may arise either from the first event involving the injured person or as a preceding event (figure 1). Theoretically, this way of viewing matters may be unsatisfactory, but from the accident prevention point of view, it identifies the beginning of the accident sequence, which can then be targeted to prevent similar accidents in the future. (The term action of deviation is used by some authorities to describe the beginning of the accident sequence, but it is not yet clear if this is always synonymous with the first event in the accident.)
When the MAIM software was first used in a clinical setting it was clear that there were problems in correctly appraising some types of “underfoot” accidents. The MAIM model identifies the first unforeseen event as the starting point of the accident sequence. Consider two similar accidents, one in which a worker intentionally steps onto an object which then breaks, and a second accident in which a worker unintentionally steps onto an object which breaks. In the first accident stepping on the object is a body movement and the first unforeseen event is the object breaking. In the second accident stepping on the object is the first unforeseen event in the accident. The resolution of these two scenarios is to ask, “Did you accidentally step on something?” This demonstrates how important the correct design of the interview is in obtaining accurate data. The analysis of these two accidents allows recommendations on accident prevention as follows; the first accident could have been prevented by making the patient aware that the object would break. The second accident could have been prevented by making the patient aware that the object was an underfoot hazard.
The MAIM software has been tested successfully in three clinical settings, including a 1-year project in the Accident and Emergency Department of the Royal Liverpool University Hospital. Patient interviews took between 5 and 15 minutes, and on average two patients were interviewed per hour. In all, 2,500 accidents were recorded. Work on publications based on these data is in progress.
More...
Accident Deviation Models
An occupational accident may be regarded as an abnormal or unwanted effect of the processes in an industrial system, or something which does not work as planned. Unwanted effects other than personal injury are also possible, such as material damage, accidental release of pollution to the environment, time delay or reduced product quality. The deviation model is rooted in systems theory. When applying the deviation model, accidents are analysed in terms of deviations.
Deviations
The definition of deviations in relation to specified requirements coincides with the definition of nonconformities in the International Organization for Standardization’s ISO 9000 series of standards on quality management (ISO 1994). The value of a systems variable is classified as a deviation when it falls outside a norm. Systems variables are measurable characteristics of a system, and they can assume different values.
Norms
There are four different types of norms. These relate to: (1) specified requirements, (2) what has been planned, (3) what is normal or usual and (4) what is accepted. Each type of norm is characterized by the way it has been established and its degree of formalization.
Safety regulations, rules and procedures are examples of specified requirements. A typical example of a deviation from a specified requirement is a “human error”, which is defined as a transgression of a rule. The norms that relate to what is “normal or usual” and what is “accepted” are less formalized. They are typically applied in industrial settings, where the planning is oriented to outcome and the execution of the work is left to the discretion of the operators. An example of a deviation from an “accepted” norm is an “incidental factor”, which is an unusual event that may (or may not) result in an accident (Leplat 1978). A further example is an “unsafe act”, which traditionally was defined as a personal action violating a commonly accepted safe procedure (ANSI 1962).
Systems Variables
In the application of the deviation model, the set or range of values of systems variables is divided into two classes, namely, normal and deviation. The distinction between normal and deviation may be problematic. Differences of opinion about what is normal may arise, for example, among workers, supervisors, management and systems designers. Another problem relates to the lack of norms in work situations which have not been encountered before (Rasmussen, Duncan and Leplat 1987). These differences of opinion and the lack of norms may in themselves contribute to an increased risk.
The Time Dimension
Time is a basic dimension in the deviation model. An accident is analysed as a process rather than as a single event or a chain of causal factors. The process develops through consecutive phases, so that there is a transition from normal conditions in the industrial system to abnormal conditions or a state of lack of control. Subsequently, a loss of control of energies in the system occurs and the damage or injury develops. Figure 1 shows an example of the analysis of an accident based on a model developed by the Occupational Accident Research Unit (OARU) in Stockholm, in relation to these transitions.
Figure 1. Accident analysis at construction site using OARU model
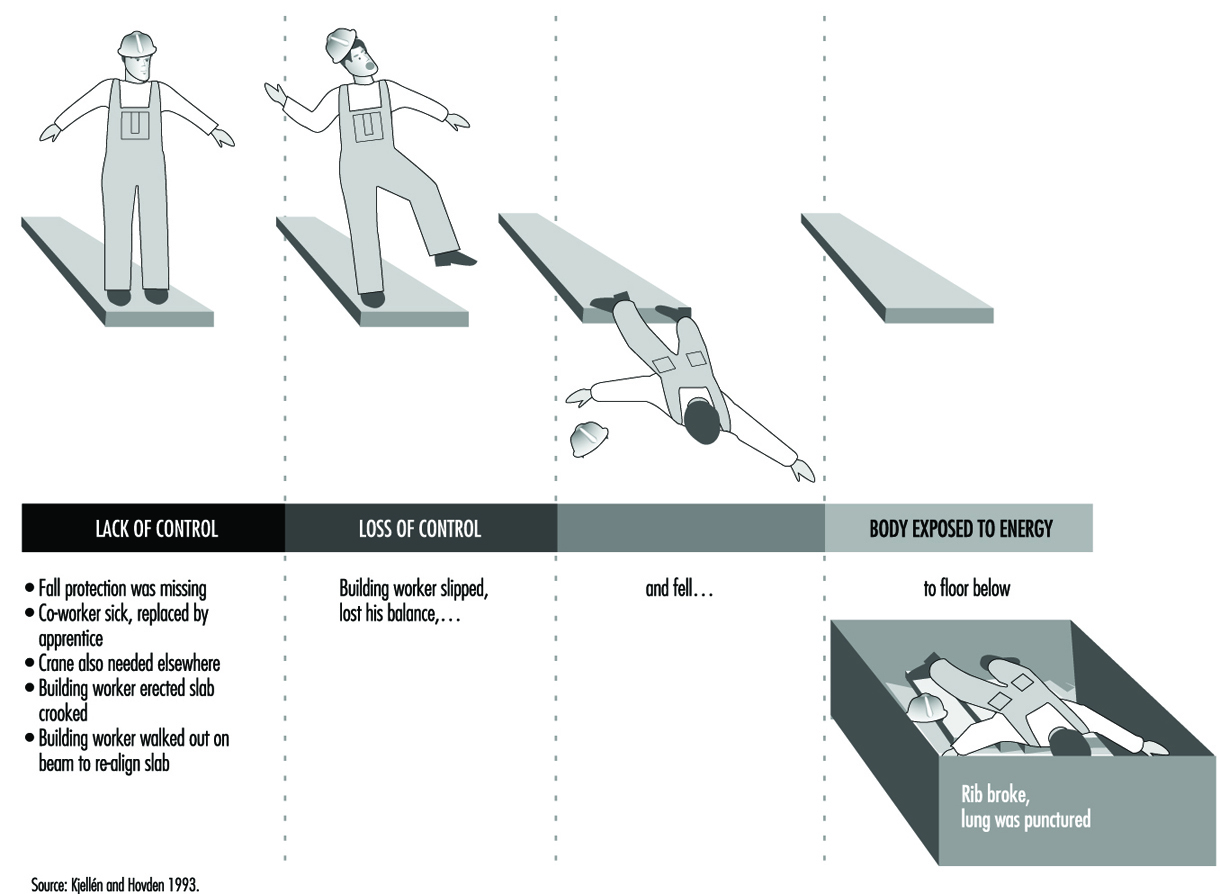
Focus on Accident Control
Each accident model has a unique focus, which is linked to an accident-prevention strategy. The deviation model puts the focus on the initial phase of the accident sequence, which is characterized by the state of abnormal conditions or lack of control. Accident prevention is accomplished through feedback where established information systems for production planning and control and safety management are used. The aim is to conduct a smooth operation with as few disturbances and improvisations as possible, so as to not increase the risk of accidents.
A distinction is made between corrective and preventive actions. Correction of deviations coincides with the first order of feedback in Van Court Hare’s hierarchy of feedback, and does not result in any organizational learning from the accident experiences (Hare 1967). Preventive actions are accomplished through higher orders of feedback that involve learning. An example of a preventive action is the development of new work instructions based on commonly shared norms about safe work routines. In general, there are three different aims of preventive actions: (1) to reduce the probability of deviations, (2) to reduce the consequences of deviations and (3) to reduce the time from the occurrence of deviations to their identification and correction.
To illustrate the characteristics of the deviation model, a comparison is made with the energy model (Haddon 1980) which directs the focus of accident prevention on the later phases of the accident process—that is, the loss of control of energies and subsequent harm. Accident prevention is typically accomplished through limitation or control of energies in the system or by interposing barriers between the energies and the victim.
Taxonomies of Deviations
There are different taxonomies for the classification of deviations. These have been developed to simplify the collection, processing and feedback of data on deviations. Table 1 presents an overview.
Table 1. Examples of taxonomies for the classification of deviations
|
Theory or model and variable |
Classes |
|
Process model |
|
|
Duration |
Event/act, condition |
|
Phase of the accident sequence |
Initial phase, concluding phase, injury phase |
|
Systems theory |
|
|
Subject-object |
(Act of) person, mechanical/physical condition |
|
Systems ergonomics |
Individual, task, equipment, environment |
|
Industrial engineering |
Materials, labour power, information, |
|
Human errors |
|
|
Human actions |
Omission, commission, extraneous act, |
|
Energy model |
|
|
Type of energy |
Thermal, radiation, mechanical, electrical, chemical |
|
Type of energy control system |
Technical, human |
|
Consequences |
|
|
Type of loss |
No significant time loss, degraded output |
|
Extent of loss |
Negligible, marginal, critical, catastrophic |
Source: Kjellén 1984.
A classical taxonomy of deviations is the distinction between “unsafe act of persons” and “unsafe mechanical/physical conditions” (ANSI 1962). This taxonomy combines a classification with respect to duration and the subject-object split. The OARU model is based on an industrial engineering systems view (Kjellén and Hovden 1993) wherein each class of deviations is related to a typical system for production control. It follows, for example, that deviations related to work materials are controlled through material control, and technical deviations are controlled through inspection and maintenance routines. Stationary guards are typically controlled through safety inspections. Deviations that describe the loss of control of energies are characterized by the type of energy involved (Haddon 1980). A distinction is also made between failures in human and technical systems for the control of energies (Kjellén and Hovden 1993).
The Validity of the Deviation Concept
No general relationships exist between deviations and the risk of injury. Research results suggest, however, that some types of deviations are associated with an increased risk of accidents in certain industrial systems (Kjellén 1984). These include defective equipment, production disturbances, irregular workload and tools used for unusual purposes. The type and amount of energy that is involved in the uncontrolled energy flow are fairly good predictors of the consequences.
Application of the Deviation Model
Data on deviations are collected in safety inspections, safety sampling, near-accident reporting and accident investigations. (See figure 2).
Figure 2. Coverage of different tools for use in safety practice

For example, Safety sampling is a method for the control of deviations from safety rules through performance feedback to the workers. Positive effects of safety sampling on safe performance, as measured by the risk of accidents, have been reported (Saari 1992).
The deviation model has been applied in the development of tools for use in accident investigations. In the incidental factors analysis method, deviations of the accident sequence are identified and arranged in a logical tree structure (Leplat 1978). The OARU model has been the basis for the design of accident investigation forms and checklists and for the structuring of the accident investigation procedure. Evaluation research shows that these methods support a comprehensive and reliable charting and evaluation of deviations (see Kjellén and Hovden 1993 for a review). The deviation model has also inspired the development of methods for risk analysis.
Deviation analysis is a risk analysis method and encompasses three steps: (1) the summarizing of systems functions and operator activities and their division into subsections, (2) the examination of each activity to identify possible deviations and to assess the potential consequences of each deviation and (3) the development of remedies (Harms-Ringdahl 1993). The accident process is modelled as illustrated by figure 1 , and the risk analysis covers all three phases. Checklists similar to those applied in accident investigations are used. It is possible to integrate this method with design tasks; it is further effective in identifying needs for remedial actions.
Summary
Deviation models focus on the early part of the accident process, where there are disturbances in the operation. Prevention is accomplished through feedback control in order to achieve a smooth operation with few disturbances and improvisations that may result in accidents.
Accident Sequence Models
This article covers a group of accident models that all share the same basic design. The interplay between human, machine and environment, and the development of this interplay into potential hazards, dangers, damages and injuries, is envisaged by means of a sequence of questions derived and listed in a logical order. This sequence is then applied in a similar manner at different levels of analysis through the use of models. The first of these models was presented by Surry (1969). A few years later, a modified version was presented by the Swedish Work Environment Fund (1983) and received the fund’s sobriquet, WEF. A Swedish research team then evaluated the WEF model and suggested some further developments resulting in a third model.
These models are herein described one by one, with comments on the reasons for the changes and developments undertaken. Finally, a tentative synthesis of the three models is proposed. Thus, a total of four models, with considerable similarities, are presented and discussed. Although this may seem confusing, it illustrates the fact that there is no model that is universally accepted as “The Model”. Among other things, there is an obvious conflict between simplicity and completeness with regard to accident models.
Surry’s Model
In 1969, Jean Surry published the book Industrial Accident Research—A Human Engineering Appraisal. This book contains a review of models and approaches predominantly applied in accident research. Surry grouped the theoretical and conceptual frameworks she identified into five different categories: (1) chain-of-multiple-events models, (2) epidemiological models, (3) energy-exchange models, (4) behaviour models, and (5) systems models. She concluded that none of these models is incompatible with any of the others; each simply stresses different aspects. This inspired her to combine the various frameworks into one comprehensive and general model. She made it clear, though, that her model should be regarded as provisional, without any pretensions of finality.
In Surry’s view, an accident can be described by a series of questions, forming a sequential hierarchy of levels, where the answers to each question determine whether an event turns out as an accident or not. Surry’s model (see figure 1) reflects the principles of human information processing, and is based upon the notion of an accident as a deviation from an intended process. It has three principal stages, linked by two similar cycles.
Figure 1. Surry's model
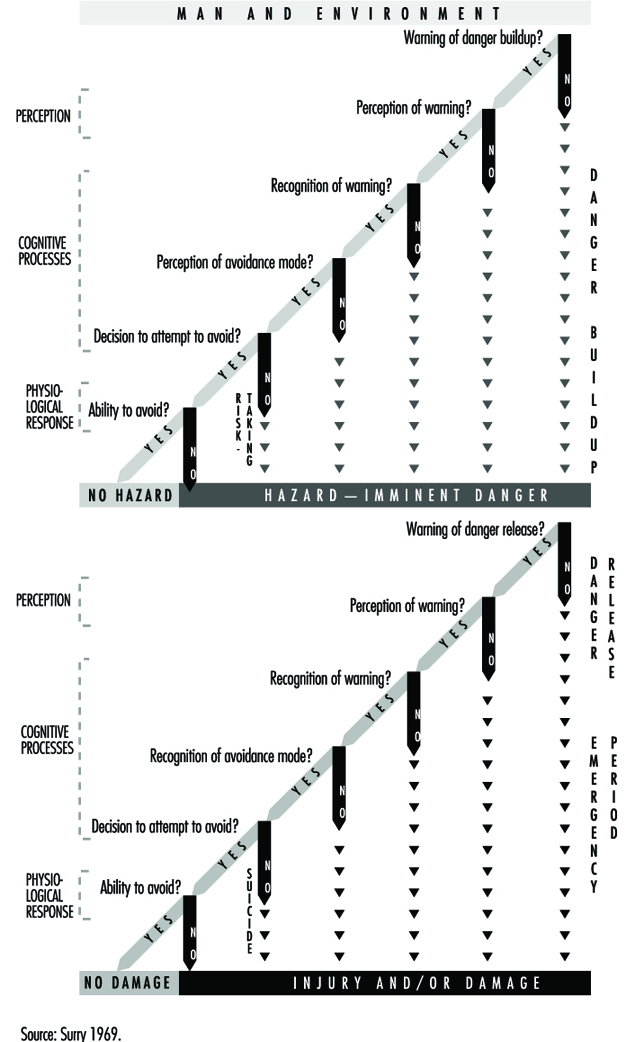
The first stage views human beings in their total environment, including all relevant environmental and human parameters. The potential injury agent is also described at this stage. It is assumed that, through the actions (or non-actions) of the individual, dangers grow out of such an environment. For the purpose of analysis a “danger-build-up” cycle is constituted by the first sequence of questions. If there are negative responses to any of these questions, the danger in question will become imminent.
The second sequence of questions, the “danger-release cycle”, links the level of danger to possible alternative outcomes when the danger is triggered. It should be noted that by following different routes through the model, it is possible to distinguish between deliberate (or consciously accepted) dangers and unintentional negative outcomes. The differences between “accident-like” unsafe acts, mishaps (and so on) and completed accidents are also clarified by the model.
The WEF Model
In 1973, a committee set up by the Swedish Work Environment Fund to review the state of occupational accident research in Sweden launched a “new” model and promoted it as a universal tool that should be employed for all research in this field. It was announced as a synthesis of existing behavioural, epidemiological and systems models, and was also said to encompass all relevant aspects of prevention. Reference was made to Surry, among others, but without mention of the fact that the proposed model was almost identical to hers. Only a few changes had been made, all for the purpose of improvement.
As often occurs when scientific models and perspectives are recommended by central agencies and authorities, the model is subsequently adopted in only a few projects. Nevertheless, the report issued by the WEF contributed to a rapidly rising interest in modelling and theory development among Swedish and Scandinavian accident researchers, and several new accident models emerged within a short period.
The point of departure in the WEF model (in contrast to Surry’s “man and environment” level) lies in the concept of danger, here limited to “objective danger” as opposed to the subjective perception of danger. Objective danger is defined as an integral part of a given system, and is basically determined by the amount of resources available for investment in safety. Increasing a system’s tolerance to human variability is mentioned as a way of reducing danger.
When an individual comes into contact with a certain system and its dangers, a process begins. Due to system features and individual behaviour, a risk situation may arise. What is most important (as regards the properties of systems) according to the authors, is how dangers are indicated through various kinds of signals. Risk imminence is determined depending on the individual’s perception, understanding and actions in relation to these signals.
The next sequence in the process, which is in principle identical to Surry’s, is directly related to the event and whether it will lead to injury or not. If the danger is released, can it be, in fact, observed? Is it perceived by the individual in question and is he or she able to avoid injury or damage? Answers to such questions explain the kind and degree of harmful outcomes that emanate from the critical period.
The WEF model (figure 2) was seen as having four advantages:
- It makes clear that safe working conditions presuppose the taking of action at the earliest possible stage.
- It illustrates the importance of working with disturbances and near-accidents, as well as those accidents that lead to damage or injury. Actual outcome is of less importance in a preventive perspective.
- It describes the principles of human information processing.
- It provides for self-correcting safety systems by means of the feedback of results from studied incidents.

Evaluation and Further Development
By the time the WEF report was issued, an epidemiological study on occupational accidents was under way in the city of Malmö, Sweden. The study was based on a modified version of the so-called Haddon Matrix, which cross-tabulates variables along two dimensions: time in terms of pre-accident, accident and post-accident phases; and the epidemiological trichotomy of host, agent (or vehicle/vector) and environment. Although such a model provides a good basis for data collection, it was found by the research team to be insufficient to understand and explain the causal mechanisms underlying accident and injury phenomena. The WEF model appeared to represent a new approach, and was therefore received with great interest. It was decided to conduct an immediate evaluation of the model by testing it on a random selection of 60 actual cases of occupational accidents that had been previously thoroughly investigated and documented by the Malmö group as a part of its ongoing study.
The results of the evaluation were summarized in four points:
- The model is not the comprehensive tool it was expected to be. Instead, it should be regarded primarily as a behavioural model. The “danger” is given, and the analysis focuses on the individual’s behaviour in relation to that danger. Consequently, preventive options derived from such analysis are oriented to human factors rather than to equipment or environment. The “danger” as such is hardly questioned within the framework of the model.
- The model does not take due consideration of technical or organizational constraints in the work process. It creates an illusion of free choice between dangerous and safe alternatives. Some dangers were actually found to be unavoidable by the individual worker, although they were clearly avoidable by management. Hence, it becomes irrelevant and misleading to ask whether people know how to avoid (and choose to avoid) something which is not really avoidable unless they decide to quit their job.
- The model provides no insight into the important issue of why the dangerous activity was necessary to begin with, and why it was performed by the specific individual. Sometimes dangerous tasks can be made unnecessary; and sometimes they can be performed by other, more appropriate persons with greater skills.
- The analysis is restricted to a single person, but many accidents occur in interaction between two or more persons. However, it was suggested that this deficiency could be overcome by combining the results of parallel analyses, each made from the perspective of one of the different individuals involved.
Based on these remarks, the model was further developed by the research group in Malmö. The most important innovation was the addition of a third sequence of questions to complement the other two. This sequence was designed to analyse and explain the existence and nature of “danger” as an inherent feature of a human-machine system. General principles from systems theory and control technology were applied.
Moreover, the work process, thus understood in terms of human-machine-environment interaction, should also be seen in the light of its organizational and structural contexts at both company and societal levels. The need to take personal characteristics and motives for the actual activity into consideration, as well as for the individual to carry out that activity, was also indicated. (See figure 3.)
Figure 3. The EF model developed by introduction of a new first sequence
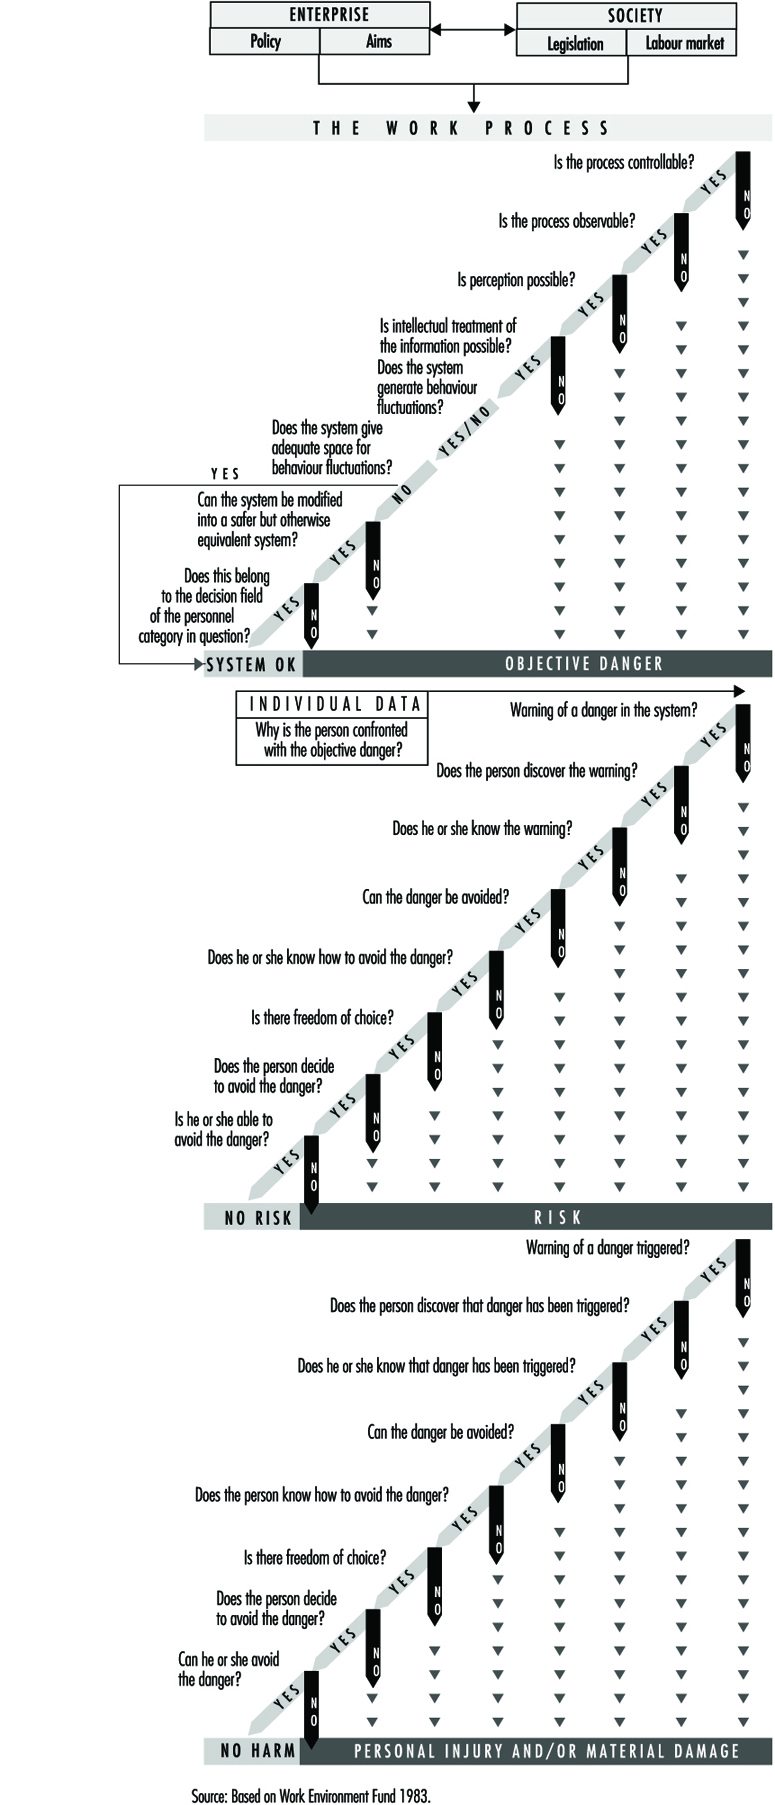
Summary
In reconsidering these early models today, more than twenty years later, against the background of progress made concerning theories and models in accident research, they still seem surprisingly up-to-date and competitive.
The basic underlying assumption of the models—that accidents, as well as their causes, should be seen as deviations from intended processes—is still a dominant perspective (see, inter alia, Benner 1975; Kjellén and Larsson 1981).
The models make a clear distinction between the concept of injury as a health outcome and the concept of accident as a preceding occurrence. Moreover, they demonstrate that an accident is not just an “event”, but rather a process which can be analysed as a series of steps (Andersson 1991).
Many subsequent models have been designed as a number of “boxes”, organized in temporal or hierarchical order, and indicating various temporal phases or levels of analysis. Examples of these include the ISA model (Andersson and Lagerlöf 1983), the deviation model (Kjellén and Larsson 1981) and the so-called Finnish model (Tuominen and Saari 1982). Such levels of analysis are also clearly central to the models described here. But the sequence models also propose a theoretical instrument for analysing the mechanisms which link these levels together. Important contributions in this respect have been made by authors such as Hale and Glendon (1987) from a human factors perspective, and Benner (1975) from a systems point of view.
As clearly emerges when comparing these models, Surry did not give a key position to the concept of danger, as is done in the WEF model. Her starting point was the human-environment interaction, reflecting a broader approach similar to that suggested by the Malmö group. On the other hand, like the WEF committee, she did not refer to any further levels of analysis beyond the worker and environment, such as organizational or societal levels. Further, the comments from the Malmö study cited here in relation to the WEF model also seem relevant to Surry’s model.
A modern synthesis of the three models presented above might include fewer details on human information processing and more information on “upstream” conditions (further back in the casual “flow”) at organizational and societal levels. Key elements in a sequence of questions designed to address the relationship between the organizational and human-machine levels might be derived from modern principles of safety management, involving quality assurance methodologies (internal control and so on). Similarly, a sequence of questions for the connection between societal and organizational levels might involve modern principles of systems-oriented supervision and auditing. A tentative comprehensive model, based on Surry’s original design and including these additional elements, is outlined in figure 4.
Figure 4. Tentative comprehensive model on accident causation (based on Surry 1969 and descendants)
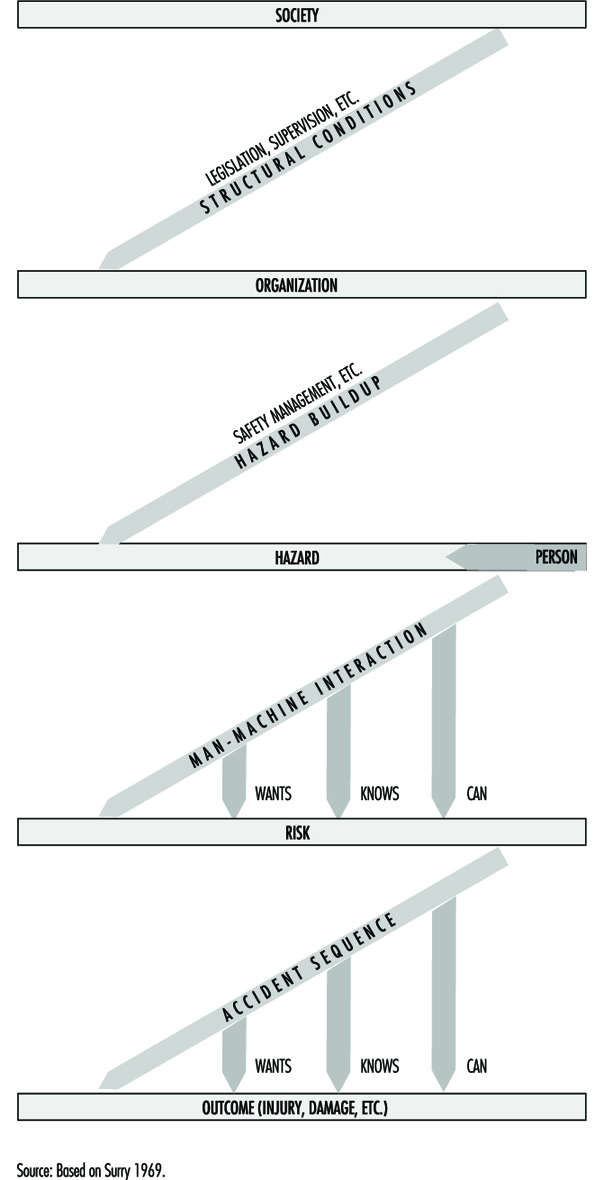
Accident Modelling
Humans play important roles in most of the processes leading up to accidents and in the majority of measures aimed at accident prevention. Therefore, it is vital that models of the accident process should provide clear guidance about the links between human actions and accidents. Only then will it be possible to carry out systematic accident investigation in order to understand these links and to make predictions about the effect of changes in the design and layout of workplaces, in the training, selection and motivation of workers and managers, and in the organization of work and management safety systems.
Early Modelling
Up until the 1960s, modelling human and organizational factors in accidents had been rather unsophisticated. These models had not differentiated human elements relevant to accidents beyond rough subdivisions such as skills, personality factors, motivational factors and fatigue. Accidents were seen as undifferentiated problems for which undifferentiated solutions were sought (as doctors two centuries ago sought to cure many then undifferentiated diseases by bleeding the patient).
Reviews of accident research literature that were published by Surry (1969) and by Hale and Hale (1972) were among the first attempts to go deeper and offer a basis for classifying accidents into types reflecting differentiated aetiologies, which were themselves linked to failures in different aspects of the man-technology-environment relationships. In both of these reviews, the authors drew upon the accumulating insights of cognitive psychology in order to develop models presenting people as information processors, responding to their environment and its hazards by trying to perceive and control the risks that are present. Accidents were considered in these models as failures of different parts of this process of control that occur when one or more of the control steps does not perform satisfactorily. The emphasis was also shifted in these models away from blaming the individual for failures or errors, and towards focusing on the mismatch between the behavioural demands of the task or system and the possibilities inherent in the way behaviour is generated and organized.
Human Behaviour
Later developments of these models by Hale and Glendon (1987) linked them to the work of Rasmussen and Reason (Reason 1990), which classified human behaviour into three levels of processing:
- automatic, largely unconscious responses to routine situations (skill-based behaviour)
- matching learned rules to a correct diagnosis of the prevailing situation (rule-based behaviour)
- conscious and time-consuming problem solving in novel situations (knowledge-based behaviour).
The typical failures of control differ from one level of behaviour to another, as do the types of accidents and the appropriate safety measures used to control them. The Hale and Glendon model, updated with more recent insights, is depicted in figure 1. It is made up of a number of building blocks which will be explained successively in order to arrive at the full model.
Figure 1. Individual problem solving in the face of danger
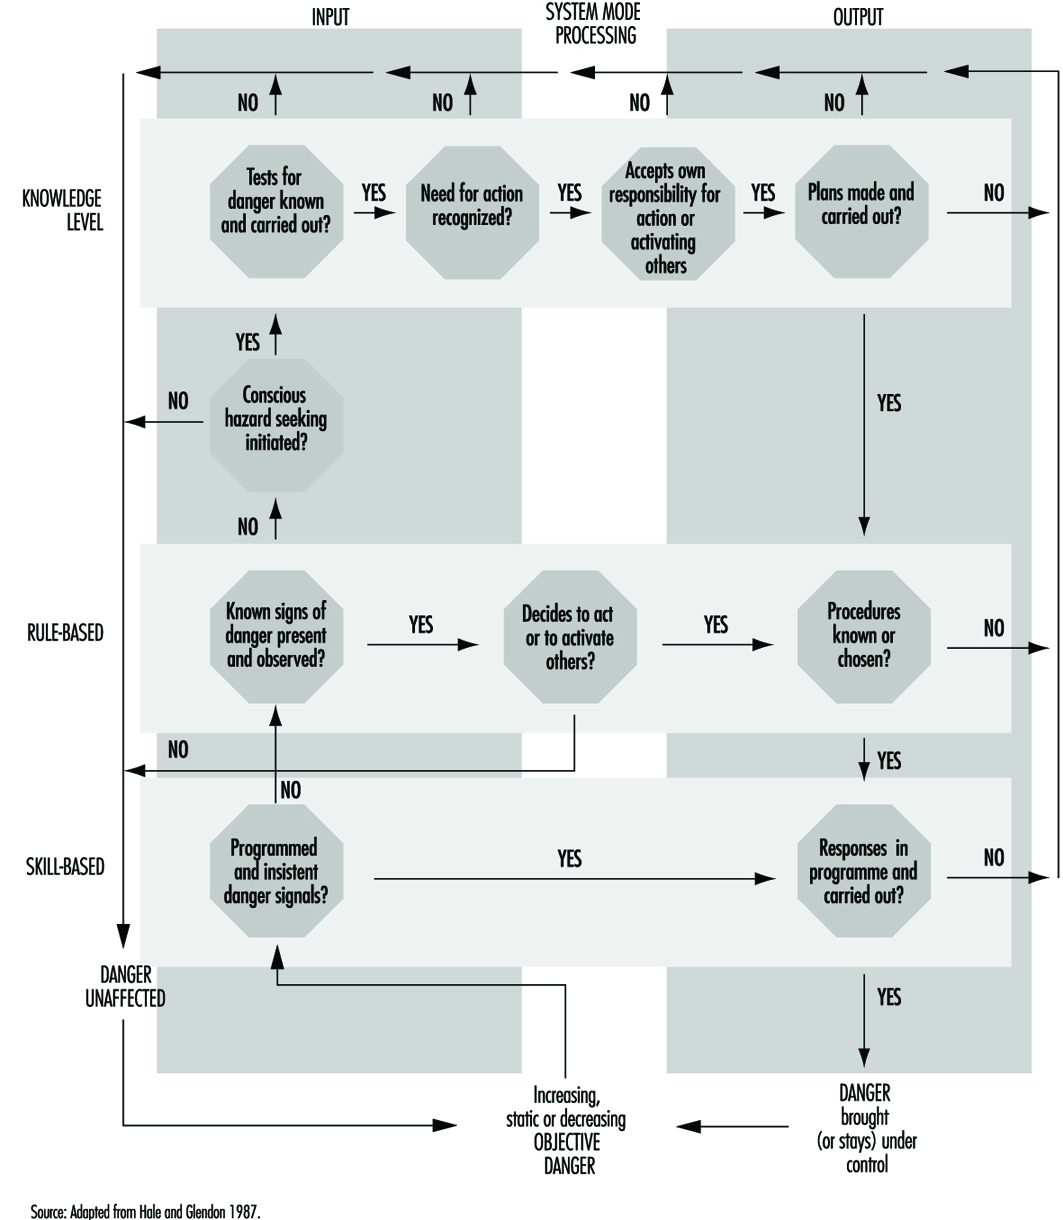
Link to deviation models
The starting point of the Hale and Glendon model is the way in which danger evolves in any workplace or system. Danger is considered to be always present, but kept under control by a large number of accident-prevention measures linked to hardware (e.g., the design of equipment and safeguards), people (e.g., skilled operators), procedures (e.g., preventive maintenance) and organization (e.g., allocation of responsibility for critical safety tasks). Provided that all relevant dangers and potential hazards have been foreseen and the preventive measures for them have been properly designed and chosen, no damage will occur. Only if a deviation from this desired, normal state takes place can the accident process start. (These deviation models are dealt with in detail in “Accident deviation models”.)
The task of the people in the system is to assure proper functioning of the accident-prevention measures so as to avert deviations, by using the correct procedures for each eventuality, handling safety equipment with care, and undertaking the necessary checks and adjustments. People also have the task of detecting and correcting many of the deviations which may occur and of adapting the system and its preventive measures to new demands, new dangers and new insights. All these actions are modelled in the Hale and Glendon model as detection and control tasks related to a danger.
Problem solving
The Hale and Glendon model conceptualizes the role of human action in controlling danger as a problem-solving task. The steps in such a task can be described generically as in figure 2.
Figure 2. Problem-solving cycle

This task is a goal-seeking process, driven by the standards set in step one in figure 2. These are the standards of safety which workers set for themselves, or which are set by employers, manufacturers or legislators. The model has the advantage that it can be applied not only to individual workers faced with imminent or future danger, but also to groups of workers, departments or organizations aiming to control both existing danger from a process or industry and future danger from new technology or products at the design stage. Hence safety management systems can be modelled in a consistent way with human behaviour, allowing the designer or evaluator of safety management to take an appropriately focused or a wide view of the interlocking tasks of different levels of an organization (Hale et al. 1994).
Applying these steps to individual behaviour in the face of danger we obtain figure 3. Some examples of each step can clarify the task of the individual. Some degree of danger, as stated above, is assumed to be present all the time in all situations. The question is whether an individual worker responds to that danger. This will depend partly on how insistent the danger signals are and partly on the worker’s own consciousness of danger and standards of acceptable level of risk. When a piece of machinery unexpectedly glows red hot, or a fork-lift truck approaches at high speed, or smoke starts seeping from under the door, individual workers skip immediately to considering the need for action, or even to deciding what they or someone else can do.
Figure 3. Behaviour in the face of danger

These situations of imminent danger are rare in most industries, and it is normally desirable to activate workers to control danger when it is much less imminent. For example, workers should recognize slight wear on the machine guard and report it, and realize that a certain noise level will make them deaf if they are continuously exposed to it for some years. Designers should anticipate that a novice worker could be liable to use their proposed new product in a way that could be dangerous.
To do this, all persons responsible for safety must first consider the possibility that danger is or will be present. Consideration of danger is partly a matter of personality and partly of experience. It can also be encouraged by training and guaranteed by making it an explicit part of tasks and procedures at the design and execution phases of a process, where it may be confirmed and encouraged by colleagues and superiors. Secondly, workers and supervisors must know how to anticipate and recognize the signs of danger. To ensure the appropriate quality of alertness, they must accustom themselves to recognize potential accident scenarios—that is, indications and sets of indications that could lead to loss of control and so to damage. This is partly a question of understanding webs of cause and effect, such as how a process can get out of control, how noise damages hearing or how and when a trench can collapse.
Just as important is an attitude of creative mistrust. This involves considering that tools, machines and systems can be misused, go wrong, or show properties and interactions outside their designers’ intentions. It applies “Murphy’s Law” (whatever can go wrong will go wrong) creatively, by anticipating possible failures and affording the opportunity of eliminating or controlling them. Such an attitude, together with knowledge and understanding, also helps at the next step—that is, in really believing that some sort of danger is sufficiently likely or serious to warrant action.
Labelling something as dangerous enough to need action is again partly a matter of personality; for instance, it may have to do with how pessimistic a person may be about technology. More importantly, it is very strongly influenced by the kind of experience that will prompt workers to ask themselves such questions as, “Has it gone wrong in the past?” or “Has it worked for years with the same level of risk with no accidents?” The results of research on risk perception and on attempts to influence it by risk communication or feedback on accident and incident experience are given in more detail in other articles.
Even if the need for some action is realized, workers may take no action for many reasons: they do not, for example, think it is their place to interfere with someone else’s work; they do not know what to do; they see the situation as unchangeable (“it is just part of working in this industry”); or they fear reprisal for reporting a potential problem. Beliefs and knowledge about cause and effect and about the attribution of responsibility for accidents and accident prevention are important here. For example, supervisors who consider that accidents are largely caused by careless and accident-prone workers will not see any need for action on their own part, except perhaps to eliminate those workers from their section. Effective communications to mobilize and coordinate the people who can and should take action are also vital at this step.
The remaining steps are concerned with the knowledge of what to do to control the danger, and the skills needed to take appropriate action. This knowledge is acquired by training and experience, but good design can help greatly by making it obvious how to achieve a certain result so as to avert danger or to protect one’s self from it—for instance, by means of an emergency stop or shutdown, or an avoiding action. Good information resources such as operations manuals or computer support systems can help supervisors and workers to gain access to knowledge not available to them in the course of day-to-day activity. Finally, skill and practice determine whether the required response action can be carried out accurately enough and with the right timing to make it successful. A difficult paradox arises in this connection: the more alert and prepared that people are, and the more reliable the hardware is, the less frequently the emergency procedures will be needed and the harder it will be to sustain the level of skill needed to carry them out when they are called upon.
Links with behaviour based on skill, rules and knowledge
The final element in the Hale and Glendon model, which turns figure 3 into figure 1, is the addition of the link to the work of Reason and Rasmussen. This work emphasized that behaviour can be evinced at three different levels of conscious control—skill-based, rule-based and knowledge-based—which implicate different aspects of human functioning and are subject to different types and degrees of disturbance or error on account of external signals or internal processing failures.
Skill-based. The skill-based level is highly reliable, but subject to lapses and slips when disturbed, or when another, similar routine captures control. This level is particularly relevant to the kind of routine behaviour that involves automatic responses to known signals indicating danger, either imminent or more remote. The responses are known and practised routines, such as keeping our fingers clear of a grinding wheel while sharpening a chisel, steering a car to keep it on the road, or ducking to avoid a flying object coming at us. The responses are so automatic that workers may not even be aware that they are actively controlling danger with them.
Rule-based. The rule-based level is concerned with choosing from a range of known routines or rules the one which is appropriate to the situation—for example, choosing which sequence to initiate in order to close down a reactor which would otherwise become overpressurized, selecting the correct safety goggles to work with acids (as opposed to those for working with dusts ), or deciding, as a manager, to carry out a full safety review for a new plant rather than a short informal check. Errors here are often related to insufficient time spent matching the choice to the real situation, to relying on expectation rather than observation to understand the situation, or to being misled by outside information into making a wrong diagnosis. In the Hale and Glendon model, behaviour at this level is particularly relevant to detecting hazards and choosing correct procedures in familiar situations.
Knowledge-based. The knowledge-based level is engaged only when no pre-existing plans or procedures exist for coping with a developing situation. This is particularly true of the recognition of new hazards at the design stage, of detecting unsuspected problems during safety inspections or of coping with unforeseen emergencies. This level is predominant in the steps at the top of figure 1. It is the least predictable and least reliable mode of operation, but also the mode where no machine or computer can replace a human in detecting potential danger and in recovering from deviations.
Putting all the elements together results in figure 1, which provides a framework for both classifying where failures occurred in human behaviour in a past accident and analysing what can be done to optimize human behaviour in controlling danger in a given situation or task in advance of any accidents.
Accident Models: Risk Homeostasis
Give me a ladder that is twice as stable, and I will climb it twice as high. But give me a cause for caution, and I’ll be twice as shy. Consider the following scenario: A cigarette is invented that causes half the frequency of smoking-related deaths per cigarette smoked as compared to present-day cigarettes, but in all other ways it is indistinguishable. Does this constitute progress? When the new cigarette replaces the current one, given that there is no change in people’s desire to be healthy (and that this is the only factor inhibiting smoking), smokers will respond by smoking twice as much. Thus, although the death rate per cigarette smoked is cut in half, the death risk due to smoking remains the same per smoker. But this is not the only repercussion: the availability of the “safer” cigarette leads fewer people to stop smoking than presently is the case and seduces more current non-smokers to yield to the temptation to smoke. As a consequence, the smoking-related death rate in the population increases. However, as people are willing to take no more risks with their health and lives than they see fit in exchange for the satisfaction of other desires, they will cut down on other, less appealing, unsafe or unhealthy habits. The end result is that the lifestyle-dependent death rate remains essentially the same.
The above scenario illustrates the following basic premises of risk homeostasis theory (RHT) (Wilde 1988; 1994):
The first is the notion that people have a target level of risk—that is, the level of risk they accept, tolerate, prefer, desire or choose. The target level of risk depends on perceived benefits and disadvantages of safe and unsafe behaviour alternatives, and it determines the degree to which they will expose themselves to safety and health hazards.
The second premise is that the actual frequency of lifestyle-dependent death, disease and injury is maintained over time through a closed-loop, self-regulating control process. Thus, fluctuations in the degree of caution people apply in their behaviour determine the ups and downs in the loss to their health and safety. Moreover, the ups and downs in the amount of actual lifestyle-dependent loss determine the fluctuations in the amount of caution people exercise in their behaviour.
Finally, the third premise holds that the level of loss to life and health, in so far as this is due to human behaviour, can be decreased through interventions that are effective in reducing the level of risk people are willing to take—that is, not through measures of the “safe cigarette” variety or other such efforts towards a “technological fix” of the problem, but by means of programmes that enhance people’s desire to be alive and healthy.
The Risk Homeostasis Theory of Accident Causation and Prevention
Among the many psychological contributions to the literature on occupational accidents and disease, traffic accidents and lifestyle-dependent ill health, only a relatively few deal with motivational factors in the causation and the prevention of these problems. Most of the publications deal with variables such as permanent or semi-permanent traits (e.g., gender, personality or experience), transient states (fatigue, blood-alcohol level), information overload or underload (stress or boredom ), training and skills, environmental factors and workstation ergonomics. It may be reasoned, however, that all variables other than motivational ones (i.e., those impinging upon the target level of risk) merely have a marginal influence upon the frequency of accidents per operator-hour of task execution. Some, though, may well have a favourable effect upon the accident rate per unit of productivity or per unit distance of mobility.
When applied, for instance, to road traffic, RHT posits that the traffic accident rate per time unit of road-user exposure is the output of a closed-loop control process in which the target level of risk operates as the unique controlling variable. Thus, in contrast with temporary fluctuations, time-averaged accident risk is viewed as independent of factors such as the physical features of the vehicle and road environment and of operator skills. Instead, it ultimately depends on the level of accident risk accepted by the road-user population in exchange for the perceived benefits received from motor-vehicle mobility in general (like driving a lot), and from specific risky acts associated with that mobility in particular (like driving well in excess of the average speed).
Thus, it is reasoned that at any moment of time, vehicle operators, equipped with their perceptual skills, perceive a certain level of accident risk and they compare this with the amount of accident risk they are willing to accept. The level of the latter is determined by the pattern of trade-offs between expected costs and benefits associated with the available alternatives for action. Thus, the target level of risk is that level of risk at which the overall utility of manner and amount of mobility is thought to maximize. The expected costs and benefits are a function of economic, cultural and person-related variables, and their long-term, short-term and momentary fluctuations. These control the target level of risk at any specific moment of time.
Whenever road users perceive a discrepancy between target risk and experienced risk in one direction or the other, they will attempt to restore the balance through some behavioural adjustment. Whether the balance is achieved or not depends upon the individual’s decision-making and psychomotor skills. However, any action taken carries a certain likelihood of accident risk. The sum total of all actions taken by the road users in a jurisdiction in a given time period (like 1 year), produce the frequency and severity of the traffic accidents in that jurisdiction. It is hypothesized that this accident rate has an influence (through feedback) upon the level of accident risk perceived by the survivors and thus upon their subsequent actions and subsequent accidents, and so forth. Thus, as long as the target level of risk remains unchanged, accident toll and behavioural caution determine each other in a circular causal chain.
The Risk Homeostatic Process
This homeostatic process, in which the accident rate is both consequence and cause of changes in operator behaviour, is modelled in figure 1. The self-correcting nature of the homeostatic mechanism can be recognized in the closed loop that runs from box e to box b, to box c, to box d, and then back to box e. It may take some time for people to become aware of a change in the accident rate (the feedback may be delayed, and this is symbolized by f). Note that box a is located outside the closed loop, meaning that interventions that lower that target level of risk can bring about a lasting reduction in the accident rate (box e).
Figure 1. Homeostatic model relating changes in accident loss to changes in operator behaviour and vice versa, with the target level of risk as the controlling variable
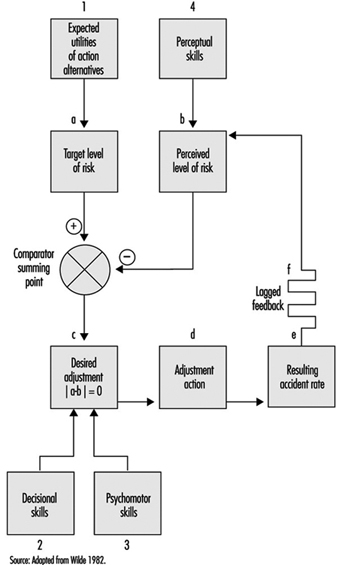
The process described herein can be further and quite clearly explained by another example of homeostatic regulation: the thermostatic control of the temperature in a house. The set temperature (comparable to box a) on the thermostat is at any point in time being compared with the actual temperature (box b). Whenever there is a difference between the two, there is a need for adjustment (box c), which triggers an adjustment action (i.e., the provision of colder or warmer air, box d). As a result, the air that is distributed through the house becomes colder (via air conditioning) or warmer (via heating—box e), as desired. After some time (symbolized by f) the air at the new temperature reaches the point set on the thermostat and gives rise to a new temperature reading, which is compared with the set-point temperature (box a), and so on.
The house temperature will show major fluctuations if the thermometer is not very sensitive. The same thing will happen when the adjustment action is slow to set in, either due to inertia of the switching mechanism or to a limited capacity of the heating/cooling system. Note, however, that these deficiencies will not alter the time-averaged temperature in the house. Note too that the desired temperature (analogous to box a in figure 1) is the only factor outside the closed loop. Resetting the thermostat to a new target temperature will produce durable changes in the time-averaged temperature. Just as a person chooses a target level of risk on the basis of the perceived benefits and costs of safe and risky behaviour alternatives, so is the target temperature selected in consideration of the pattern of expected costs and benefits of higher or lower temperatures (e.g., energy expenditures and physical comfort). A lasting discrepancy between target risk and actual risk can occur only in the case of consistent over- or under-estimation of risk, just as a thermometer that produces a temperature reading that is consistently too high or too low will cause real temperature to deviate systematically from target temperature.
Evidence in Support of the Model
It may be deduced from the model described above that the introduction of any accident countermeasure that does not alter the target level of risk is followed by road users making an estimate of its intrinsic effect upon safety—that is, the change in accident rate that would occur if operator behaviour did not change in response to the new countermeasure. This estimate will enter into the comparison between perceived and accepted level of risk and thus influence subsequent adjustment behaviour. If the initial estimates are incorrect on average, a disturbance in the accident rate will occur, but only temporarily, because of the correcting effect due to the feedback process.
This phenomenon has been discussed in an OECD report. The greater opportunity for safety and the increased level of skill may not be utilized for greater safety, but instead for improved performance: “Behavioural adaptations of road users which may occur following the introduction of safety measures in the transport system are of particular concern to road authorities, regulatory bodies and motor vehicle manufacturers particularly in cases where such adaptations may decrease the expected safety benefit” (OECD 1990). This report mentions numerous examples, as follows:
Taxicabs in Germany equipped with anti-lock brake systems were not involved in fewer accidents than taxis without these brakes, and they were driven in a more careless manner. Increases in lane width of two-lane highways in New South Wales in Australia have been found to be associated with higher driving speeds: a speed increase by 3.2 km/h for every 30 cm additional lane width. This was found for passenger cars, while truck speed increased by about 2 km/h for every 30 cm in lane width. A US study dealing with the effects of lane-width reduction found that drivers familiar with the road reduced their speed by 4.6 km/h and those unfamiliar by 6.7 km/h. In Ontario it was found that speeds decreased by about 1.7 km/h for each 30 cm of reduction in lane width. Roads in Texas with paved shoulders as compared to unpaved shoulders were driven at speeds at least 10% higher. Drivers have generally been found to move at a higher speed when driving at night on roads with clearly painted edge markings.
Recently, a Finnish study investigated the effect of installing reflector posts along highways with an 80 km/h speed limit. Randomly selected road sections which totalled 548 km were equipped with these posts and compared with 586 km that were not. The installation of reflector posts increased speed in darkness. There was not even the slightest indication that it reduced the accident rate per km driven on these roads; if anything, the opposite happened (Kallberg 1992).
Numerous other examples could be mentioned. Seat-belt-wearing legislation has not been seen to reduce traffic fatality rates (Adams 1985). Habitual non-users of seat-belts who were made to buckle up, increased their moving speed and decreased their following distance (Janssen 1994). Following the change-over from left- to right-hand traffic in Sweden and Iceland, there were initially major reductions in the occurrence of serious accidents, but their rates returned to the pre-existing trend when road users found out that the roads had not become as dangerous as they thought at first (Wilde 1982). There have been major reductions in the accident rate per km driven in the course of this century, but the traffic accident rate per head of population has not shown a downward trend (when account is taken of periods of high unemployment in which the target level of accident risk is reduced; Wilde 1991).
Motivation for Accident Prevention
Interestingly, most of the evidence for the phenomena that are postulated by RHT comes from the area of road traffic, while the prospects this theory holds for accident prevention have largely been confirmed in occupational settings. In principle, there are four ways in which workers and drivers may be motivated to lower their target level of risk:
- Reduce the expected benefits of risky behaviour alternatives.
- Increase the expected costs of risky behaviour alternatives.
- Increase the expected benefits of safe behaviour alternatives.
- Decrease the expected costs of safe behaviour alternatives.
While some of these approaches have been found to be more effective than others, the notion that safety may be enhanced by acting upon motivation has a long history, as is obvious from the universal presence of punitive law.
Punishment
Although enforcement of punitive law is one of society’s traditional attempts at motivating people towards safety, the evidence for its effectiveness has not been forthcoming. It suffers from several other problems as well, some of which have been identified in the context of organizational psychology (Arnold 1989).
First is the “self-fulfilling prophecy” effect of attribution. For example, labelling people with undesirable characteristics may stimulate individuals to behave as if they had these characteristics. Treat people as if they were irresponsible and eventually some will behave as if they were.
Second, the emphasis is on process controls; i.e., on specific behaviours such as using a piece of safety equipment or obeying the speed limit, instead of focusing on the end result, which is safety. Process controls are cumbersome to design and implement, and they can never totally encompass all undesirable specific behaviours of all people at all times.
Third, punishment brings negative side-effects. Punishment creates a dysfunctional organizational climate, marked by resentment, uncooperativeness, antagonism and even sabotage. As a result, the very behaviour that was to be prevented may in fact be stimulated.
Encouragement
In contrast to punishment, incentive programmes have the effect for which they are intended, as well as the positive side-effect of creating a favourable social climate (Steers and Porter 1991). The effectiveness of incentives and recognition programmes in enhancing safety has been clearly established. In a recent review of over 120 published evaluations of different types of occupational accident prevention, incentives and recognition were generally found more effective towards safety than engineering improvements, personnel selection and other types of intervention which included disciplinary action, special licensing, and exercise and stress-reduction programmes (Guastello 1991).
Behavioural Adaptation
According to risk homeostasis theory, the accident rate per person-hour of task performance or the annual accident rate per head of population do not primarily depend upon a person’s ability to be safe, nor upon the opportunity to be safe, but instead upon that person’s desire to be safe. Thus, it is reasoned that, although education and engineering may provide the ability or the opportunity for greater safety, these approaches to accident prevention will fail to reduce the accident rate per hour, because they do not reduce the amount of risk people are willing to take. The response to these interventions, therefore, will usually take the form of some behavioural adjustment in which the potential safety advantage is in fact consumed as an addition to performance in terms of greater productivity, more mobility and/or higher speed of mobility.
This can be explained as the consequence of a homeostatic control process in which the degree of behavioural caution determines the accident rate and the accident rate determines the extent of caution in operator behaviour. In this closed-loop process, the target level of risk is the only independent variable that ultimately explains the accident rate. The target level of risk depends on the person’s perception of the advantages and disadvantages of various action alternatives. To maintain that safety is its own reward is to ignore the fact that people knowingly take risks for various contingencies that are open to modification.
Therefore, of all accident countermeasures that are currently available, those that enhance people’s motivation towards safety seem to be the most promising. Furthermore, of all countermeasures that affect people’s motivation towards safety, those that reward people for accident-free performance seem to be the most effective. According to McAfee and Winn’s literature review: “The major finding was that every study, without exception, found that incentives or feedback enhanced safety and/or reduced accidents in the workplace, at least in the short term. Few literature reviews find such consistent results” (1989).
Summary
Of all possible schemes that reward people for accident-free performance, some promise better results than others because they contain the elements that appear to enhance motivation towards safety. Examples of empirical evidence for the risk-homeostatic process have been selected from the larger information base (Wilde 1994), while the ingredients for effective incentive programming have been discussed in greater detail in Chapter 60.16. The under-reporting of accidents has been mentioned as the only identified negative side-effect of incentive schemes. This phenomenon, however, is limited to minor accidents. It may be possible to conceal a broken finger; it is more difficult to hide a corpse.
" DISCLAIMER: The ILO does not take responsibility for content presented on this web portal that is presented in any language other than English, which is the language used for the initial production and peer-review of original content. Certain statistics have not been updated since the production of the 4th edition of the Encyclopaedia (1998)."