- You are here:
-
Home

- k2 Feed
Health Effects and Disease Patterns
As an emerging industry, semiconductor manufacturing often has been viewed as the epitome of the high-technology workplace. Because of stringent manufacturing requirements associated with producing multiple layers of micron dimensional electronic circuitry on silicon wafers, the cleanroom environment has become synonymous with the workplace for this industry. Since certain of the hydride gases used in semiconductor manufacturing (e.g., arsine, phosphine) were recognized early as highly toxic chemicals, inhalation exposure control technology has always been an important component of wafer fabrication. Semiconductor workers are further isolated from the production process by wearing special clothing covering the whole body (e.g., gowns), hair covers, shoe covers and, frequently, facial masks (or even air-supplied breathing devices). From a practical standpoint, employer concerns for product purity have resulted, also, in worker exposure protection.
In addition to personal protective clothing, highly sophisticated systems of ventilation and chemical/gas air monitoring are used throughout the semiconductor industry to detect leaks of toxic chemical solvent vapours, acids and hydride gases at parts per million (ppm) or less. Although, from the historic viewpoint, the industry has experienced frequent worker evacuations from wafer fabrication rooms, based on real or suspected leaks of gases or solvents, such evacuation episodes have become rare events because of the lessons learned in design of ventilation systems, toxic gas/chemical handling and increasingly sophisticated air-monitoring systems with continuous air sampling. However, the increasing monetary value of individual silicon wafers (together with increasing wafer diameters), which can contain scores of individual microprocessors or memory devices, can place mental stress on workers who must manually manipulate containers of these wafers during manufacturing processes. Evidence of such stress was obtained during a study of semiconductor workers (Hammond et al. 1995; Hines et al. 1995; McCurdy et al. 1995).
The semiconductor industry had its beginnings in the United States, which has the highest number of semiconductor industry workers (approximately 225,000 in 1994) of any country (BLS 1995). However, obtaining valid international employment estimates for this industry is difficult because of the inclusion of semiconductor workers with “electrical/electronic equipment manufacturing” workers in most nations’ statistics. Because of the highly stringent engineering controls required for semiconductor device manufacturing, it is most probable that semiconductor workplaces (i.e., cleanrooms) are comparable, in most respects, throughout the world. This understanding, coupled with US government requirements for recording all significant work-related injuries and illnesses among US workers, makes the work injury and illness experience of US semiconductor workers a highly relevant issue on both a national and international scale. Simply stated, at this time there are few international sources of relevant information and data concerning semiconductor worker safety and health experience, other than those from the Annual Survey of Occupational Injuries and Illnesses by the US Bureau of Labor Statistics (BLS).
In the United States, which has collected work injury and illness data on all industries since 1972, the frequency of work-related injuries and illnesses among semiconductor workers has been among the lowest of all manufacturing industries. However, concerns have been voiced that more subtle health effects may be present among semiconductor workers (LaDou 1986), although such effects have not been documented.
Several symposia have been held concerning control technology assessment in the semiconductor industry, with several of the symposia papers dealing with environmental and worker safety and health issues (ACGIH 1989, 1993).
A limited quantity of work injury and illness data for the international semiconductor manufacturing community was derived via a special survey performed in 1995, involving cases reported for the years 1993 and 1994. These survey data are summarized below.
Work Injuries and Illness among Semiconductor Workers
With respect to international statistical data associated with work injuries and illnesses among semiconductor workers, the only comparable data appear to be those derived from a survey of multi-national semiconductor manufacturing operations performed in 1995 (Lassiter 1996). The data collected in this survey involved the international operations of US-based semiconductor manufacturers for the years 1993-94. Some of the data from the survey included operations other than semiconductor manufacturing (e.g., computer and disk drive manufacturing), although all participating companies were involved in the electronics industry. The results of this survey are presented in figure 1 and figure 2, which include data from the Asia-Pacific region, Europe, Latin America and the United States. Each case involved a work-related injury or illness which required medical treatment or work loss or restriction. All incidence rates in the figures have been calculated as numbers of cases (or lost workdays) per 200,000 worker-hours per year. If total worker-hours was not available, average annual employment estimates were used. The 200,000 worker-hours denominator is equal to 100 full-time equivalent workers per year (assuming 2,000 work hours per worker per year).
Figure 1. Distribution of incidence rates for work injuries and illnesses by world sector, 1993 and 1994.
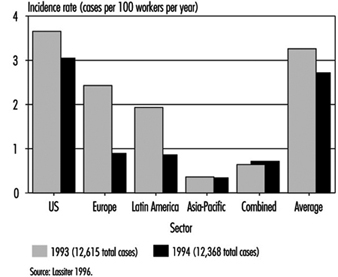
Figure 2. Distribution of incidence rates for Injuries and illnesses with days off from work by world sector 1993 and 1994
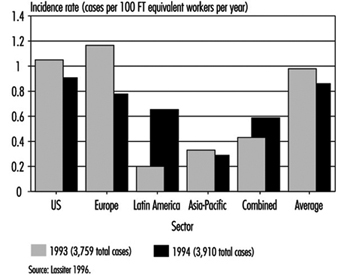
Figure 1 depicts work injury and illness incidence rates for the various world regions in the 1993-94 survey. Individual country rates have not been included to ensure confidentiality of those participating companies which were the sole sources of data for certain countries. Hence, for certain countries in the survey, data were reported for only a single facility. In several instances, companies combined all international data into a single statistic. These latter data are listed in figure 1 and figure 2 as “Combined”.
The annual incidence of work injuries and illnesses among all workers in the international survey was 3.3 cases per 100 employees (200,000 worker-hours) in 1993 and 2.7 in 1994. There were 12,615 cases reported for 1993 and 12,368 for 1994. The great majority of cases (12,130 in 1993) were derived from US companies. These cases were associated with approximately 387,000 workers in 1993 and 458,000 in 1994.
Figure 2 presents incidence rates for lost workday cases involving days away from work. The 1993 and 1994 incidence rates were based on approximately 4,000 lost workday cases for each of the 2 years in the international survey. The international/regional range in incidence rates for this statistic was the most narrow of those measured. The incidence of lost workday cases may represent the most comparable international statistics with respect to worker safety and health experience. The incidence rate for lost workdays (days away from work) was approximately 15.4 days away from work per 100 workers for each of the 2 years.
The only detailed data known to exist concerning case characteristics of semiconductor worker injuries and illnesses are those compiled annually in the US by the BLS, involving cases with lost workdays. The cases discussed here were identified by the BLS in their annual survey for the year 1993. Data obtained from these cases appear in figure 3, figure 4, figure 5 and figure 6. Each figure compares the lost workday case experience for the private sector, all manufacturing and semiconductor manufacturing.
Figure 3. Comparative incidence of lost workdays cases1 by type of event or exposure, 1993
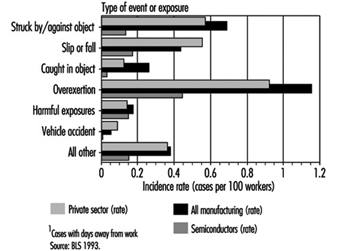
Figure 4. Comparative incidence of lost workday cases1 by source of injury or illness, 1993.
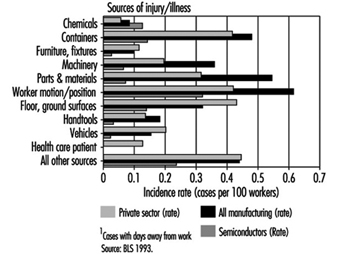
Figure 5. Comparative incidence of lost workday cases1 by nature of injury or illness, 1993.
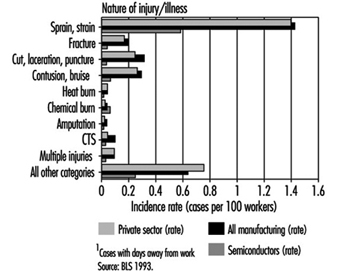
Figure 6. Comparative incidence of lost workday cases by part of body affected, 1993
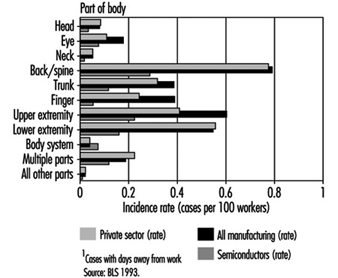
Figure 3 compares the lost workday case experience of US semiconductor workers in 1993 with the private sector and with all manufacturing with respect to type of event or exposure. The incidence rates for most categories in this figure were much less for semiconductor industry workers than for the private sector or all manufacturing. Cases involving overexertions among semiconductor workers were less than half the rate for all workers in the manufacturing sector. The harmful exposure category (primarily associated with exposures to chemical substances) was equivalent among all three groups.
Comparative distributions of lost workday cases according to source of injury or illness are presented in figure 4. Lost workday case incidence rates for semiconductor workers were less than those for the private sector and all manufacturing in all source categories except for cases associated with exposures to chemical substances.
Figure 5 compares lost workday case incidence rates associated with nature of injury or illness among the three groups. The rates for semiconductor workers were less than half of the rates for both the private sector and for all manufacturing in 1993. The incidence of chemical burns was slightly higher for semiconductor workers, but was very low for all three comparison groups. The incidence of carpal tunnel syndrome (CTS) among US semiconductor workers was less than half the rate for all manufacturing.
In figure 6, the distribution and incidence of cases involving days away from work is illustrated according to part of body affected. Although the incidence of cases involving body systems was low for all comparison groups, the rate for semiconductor workers was slightly elevated. All other body parts affected were much lower for semiconductor workers than for the other two comparison groups.
Epidemiological Studies of Semiconductor Workers
Concern for possible reproductive health consequences associated with employment in the semiconductor surfaced in 1983 when a female employee at the Digital Equipment Corporation’s semiconductor facility in Hudson, Massachusetts, indicated that she believed that an excess of miscarriages had occurred among employees in the facility’s cleanrooms. This allegation, coupled with an absence of internal data at the facility, led to an epidemiological study by the University of Massachusetts School of Public Health in Amherst (UMass). The study was begun in May of 1984 and completed in 1985 (Pastides et al. 1988).
An elevated risk of miscarriage was observed in both the photolithographic area and the diffusion area when compared to non-exposed workers in other areas of the facility. A relative risk of 1.75 was considered to be not statistically significant (p <0.05), although a 2.18 relative risk observed among workers in diffusion areas was significant. Publication of the UMass study led to concern throughout the semiconductor industry that a larger study was warranted to validate the observed findings and to determine their extent and possible causation.
The Semiconductor Industry Association (SIA) of the United States sponsored a larger study performed by the University of California at Davis (UC Davis) beginning in 1989. The UC Davis study was designed to test the hypothesis that semiconductor manufacturing was associated with an increased risk of miscarriage for female wafer fabrication employees. The study’s population was selected from among 14 companies which represented 42 production sites in 17 states. The highest number of sites (representing almost half of the employees in the study) was in California.
The UC Davis study consisted of three different components: a cross-sectional component (McCurdy et al. 1995; Pocekay et al. 1995); an historical cohort component (Schenker et al. 1995); and a prospective component (Eskenazi et al. 1995). Central to each of these studies was an exposure assessment (Hines et al. 1995; Hammond et al. 1995). The exposure assessment component assigned employees to a relative exposure group (i.e., high exposure, low exposure and so on).
In the historical component of the study, it was determined that the relative risk of fabrication workers, compared with non-fabrication workers, was 1.45 (i.e., 45% excess risk of miscarriage). The highest risk group identified in the historical component of the study were women who worked in photolithography or etching operations. Women performing etching operations experienced a relative risk of 2.15 (RR=2.15). In addition, a dose-response relationship was observed among women who worked with any photoresist or developer with respect to increased risk of miscarriage. These data supported a dose-response association for ethylene glycol ethers (EGE) but not for propylene glycol ethers (PGE).
Although an increased risk of miscarriage was observed among female wafer fabrication workers in the prospective component of the UC Davis study, the results were not statistically significant (p less than 0.05). A small number of pregnancies significantly reduced the power of the prospective component of the study. Analysis by exposure to chemical agent indicated an increased risk for those women who worked with ethylene glycol monoethyl ether, but was based on only 3 pregnancies. One important finding was the general support for, and not contradiction of, the findings of the historical component.
The cross-sectional component of the study noted an increase in upper respiratory symptoms primarily in the diffusion furnace and thin film groups of workers. An interesting finding was the apparent protective effects of various engineering controls related to ergonomics (e.g., footrests and the use of an adjustable chair to reduce back injuries).
Air measurements made in the wafer fabs found most solvent exposures were less than 1% of the permissible exposure limits (PEL) established by the US government.
A separate epidemiological study (Correa et al. 1996) was performed by the Johns Hopkins University (JHU), involving a group of IBM Corporation semiconductor employees in 1989. The overall miscarriage rate observed in the JHU study involving female cleanroom workers was 16.6%. The relative risk for miscarriage among female cleanroom workers with the highest potential exposure to ethylene glycol ethers was 2.8 (95% C.I. = 1.4-5.6).
Discussion of Reproductive Epidemiological Studies Involving Semiconductor Workers
The epidemiological studies were remarkable in the scope and similarity of results. These studies all produced similar findings. Each study documented an excess risk of spontaneous abortion (miscarriage) for female semiconductor wafer fabrication workers. Two of the studies (JHU and UC Davis) may indicate a causal association with exposures to ethylene-based glycol ethers. The UMass study found that the photo group (those exposed to glycol ether) had less risk than the diffusion group, which had no documented glycol ether exposure. While these studies indicate an increased risk of spontaneous abortions among wafer fabrication workers, the cause of such excess risk is unclear. The JHU study failed to document a significant role for glycol ethers, and the UC Davis study only marginally linked glycol ethers (through modelling of exposures and self-reported work practices) to reproductive effects. Little if any monitoring was performed in either study to determine exposures to glycol ethers. Following completion of these studies the semiconductor industry began switching from ethylene series glycol ethers to substitutes such as ethyl lactate and propylene series glycol ethers.
Conclusion
Based on the best available data concerning the annual incidence of work-related injuries and illnesses, semiconductor workers are at less risk than workers in other manufacturing sectors or throughout the private sector (including many non-manufacturing industries). On an international basis, it appears that work injury and illness statistical data associated with lost workday cases may be a fairly reliable indicator of the worldwide safety and health experience of semiconductor workers. The industry has sponsored several independent epidemiological studies in an attempt to find answers to questions of reproductive health consequences related to employment in the industry. Although a definitive association between observed miscarriages and exposures to ethylene-based glycol ethers was not established, the industry has begun to use alternative photoresist solvents.
Printed Circuit Board and Computer Assembly
Printed Wiring Boards
Printed wiring boards (PWBs) are the interconnective electrical framework and physical structure that hold together the various electronic components of a printed circuit board. The major categories of PWBs are single-sided, double-sided, multilayer and flexible. The complexity and spacing requirements of ever increasingly dense and smaller boards have required that both sides of the board be covered with underlying circuits. Single-sided boards met early calculator and simple consumer electronic devices requirements, but portable notebook computers, personal digital assistants and personal music systems have required double-sided and multilayer PWBs. The processing of the patterning of PWBs is essentially a photolithographic process that involves selectively depositing and removing layers of materials on a dielectric substrate that acts as the electrical “wiring” that is etched or deposited on the printed wiring board.
Multilayer boards contain two or more pieces of dielectric material with circuitry that are stacked up and bonded together. Electrical connections are established from one side to the other, and to the inner layer circuitry, by drilled holes which are subsequently plated through with copper. The dielectric substrate most commonly used is fibreglass sheets (epoxy/fibreglass laminate). Other materials are glass (with polyimide, Teflon or triazine resins) and paper covered with phenolic resin. In the United States, laminated boards are categorized based on their fire-extinguishing properties; drilling, punching and machining properties; properties of moisture absorption; chemical and heat resistance; and mechanical strength (Sober 1995). The FR-4 (epoxy resin and glass cloth substrate) is widely used for high-technology applications.
The actual PWB process involves numerous steps and a wide variety of chemical agents. Table 1 illustrates a typical multilayer process and the EHS issues associated with this process. The primary differences between a single-sided and double-sided board is that the single-sided starts with raw material clad only on one side with copper, and omits the electroless copper plating step. The standard double-sided board has a solder mask over bare copper and is plated through the holes; the board has gold-coated contacts and a component legend. The majority of PWBs are multilayer boards, which are double-sided with internal layers that have been fabricated and sandwiched inside the laminate package and then processed almost identically to a double-layer board.
Table 1. PWB process: Environmental, health and safety issues
|
Primary process steps |
Health and safety issues |
Environmental issues |
|
Material prep |
||
|
Purchase specific laminate, entry material and backup board in pre-cut size |
Computer aided design—VDU and ergonomics hazards |
None |
|
Stack and pin |
||
|
Copper-clad panels are stacked with entry material and backup board; holes drilled and |
Noise during drilling; drilling particulate containing copper, lead, gold and epoxy/fibreglass |
Waste particulate (copper, lead, gold and |
|
Drilling |
||
|
Numerically controlled (N/C) drilling machines |
Noise during drilling; drilling particulate containing copper, lead, gold and epoxy/fibreglass |
Waste particulate (copper, lead, gold and |
|
Deburr |
||
|
Drilled panels pass through brushes or abrasive wheel |
Noise during deburr; particulate containing copper, lead, gold and epoxy/fibreglass |
Waste particulate (copper, lead, gold and |
|
Electroless copper plating |
||
|
Adding thin copper layer to through holes |
Inhalation and dermal exposure to cleaners, conditioners, etchants, catalysts—H2SO4, H2O2, glycol ethers, KMnO4, NH4HF2, palladium, SnCl2, CuSO4, formaldehyde, NaOH |
Water effluents—acids, copper, caustics, |
|
Imaging |
||
|
Dry film resist—UV sensitive photopolymer |
Inhalation and dermal exposure to resists; developers; and |
Air emissions—solvents (VOCs), acid gases, |
|
Pattern plating |
||
|
Cleaning |
Inhalation and dermal hazards from cleaning; copper plating or tin/tin and lead plating and rack stripping—H3PO4, H2SO4; H2SO4 and CuSO4; fluoboric acid and Sn/Pb; concentrated HNO3 |
Air emissions—acid gases; water |
|
Strip, etch, strip |
||
|
Resist strip |
Inhalation and dermal hazards from resist strip; alkaline etch or copper strip—monoethanol amine (MEA); NH4OH; NH4Cl/NH4OH or NH4HF2 |
Air emissions—MEA, ammonia, fluorides; |
|
Solder mask |
||
|
Epoxy inks —screen printing |
Inhalation and dermal hazards from precleaning; epoxy inks and solvent carriers; developers—H2SO4; epichlorhydrin + bisphenol A, glycol ethers (PGMEA based); gamma-butyrolactone. UV light from curing process |
Air emissions—acid gases, glycol ethers |
|
Solder coating |
||
|
Solder levelling |
Inhalation and dermal hazards from flux, decomposition products and lead/tin solder residues—dilute glycol ethers + <1% HCl and <1% HBr; aldehydes, HCl, CO; lead and tin |
Air emissions—glycol ethers (VOC), acid gases, aldehydes, CO; waste—lead/tin solder, flux |
|
Gold and nickel plating |
||
|
Inhalation and dermal hazards from acids, metals and |
Air emissions—acid gases, cyanides; water |
|
|
Component legend |
||
|
Screen print |
Inhalation and dermal hazards from epoxy based inks and solvent carriers—glycol ether-based solvents, epichlorhydrin + bisphenol A |
Air emissions—glycol ethers (VOCs) waste — inks and solvents (small quantities) |
Cl2 = chlorine gas; CO = carboon monoxide; CuSO4 = copper sulphate; H2O2 = hydrogen peroxide;H2SO4 = sulphuric acid; H3PO4 = phosphoric acid; HBR = hydrobromic acid; HCl = hydrochloric acid; HNO3 = nitric acid; K2CO3 = potassium carbonate; KMNO4 = potassium permanganate; NA3PO4 = sodium phosphate; NH4Cl = ammonium chloride; NH4OH = ammonium hydroxide; NiSO4 = nickel sulphate; Pb = lead; Sn = tin; SnCl2 = stannous chloride; UV = ultraviolet; VOCs = volatile organic compounds.
Printed Circuit Board Assembly
Printed circuit board (PCB) assembly involves the hard attachment of electronic components to the PWB through the use of lead/tin solder (in a wave solder machine or applied as a paste and then reflowed in a low-temperature furnace) or epoxy resins (cured in a low-temperature furnace). The underlying PWB (single-sided, double-sided, multilayer or flexible) will determine the densities of components that can be attached. Numerous process and reliability issues form the basis for the selection of the PCB assembly processes that will be utilized. The major technological processes are: total surface mounting technology (SMT), mixed technology (includes both SMT and plated through hole (PTH)) and underside attachment.
Typically in modern electronics/computer assembly facilities, the mixed technology is utilized, with some components being surface mounted and other connectors/components being soldered on using through-hole technology or solder reflowing. A “typical” mixed technology process is discussed below, wherein a surface mount process involving adhesive attach, wave soldering and reflow soldering is utilized. With mixed technology, it is sometimes possible to reflow surface mount components (SMCs) on the top side of a double-sided board and wave solder the SMCs on the underside. Such a process is particularly useful when the surface mount and through-hole technologies must be mixed on a single board, which is the norm in current electronics manufacturing. The first step is to mount the SMCs to the top side of the board, using the solder reflow process. Next, the through-hole components are inserted. The board is then inverted, and the underside SMCs are mounted adhesively to the board. Wave soldering of both through-hole components and underside SMCs is the final step.
The major technical mixed technology process steps include:
- pre- and post-cleaning
- solder paste and adhesive application (screen print and placement (SMT and PTH))
- component insertion
- adhesive cure and solder reflow
- fluxing (PTH)
- wave soldering (PTH)
- inspection and touch-up
- testing
- reworking and repairing
- support operations—stencil cleaning.
A brief discussion of the important environmental, health and safety implications for each process step is provided below.
Pre- and post-cleaning
Commercial PWBs are typically purchased from a PWB supplier and have been pre-cleaned with de-ionized (DI) water solution to remove all surface contaminants. Prior to the concerns regarding stratospheric ozone layer depletion, an ozone depleting substance, such as a chlorofluorocarbon (CFC), would be used as a final clean, or even pre-clean by the electronic device manufacturer. At the end of the PCB assembly process, the use of a chlorofluorocarbon “vapour degreasing” operation to remove residues from the flux/wave soldering operation was typical. Again due to concerns about ozone depletion and tight regulatory controls on the production of CFCs, process changes were made that allowed the complete PWB assemblies to by-pass cleaning or use only a DI water cleaning.
Solder paste and adhesive application (stencil print and placement) and component insertion
The application of lead/tin solder paste to the PWB surface allows the surface mount component to be attached to the PWB and is key to the SMT process. The solder material acts as a mechanical linkage for electrical and thermal conduction and as a coating for surface protection and enhanced solderability. The solder paste is made up of approximately 70 to 90% non-volatile matter (on a weight per weight or weight per volume basis):
- lead/tin solder
- a blend of modified resins (rosin acids or mildly activated rosin)
- activators (in the case of “no clean” products, mixtures of amine hydrohalides and acids or just carboxylic acids).
Solvents (volatile matter) make-up the remainder of the product (typically an alcohol and glycol ether mixture that is a proprietary blend).
The solder paste is printed through a stencil, which is an exact pattern of the surface design that is to be added to the PWB surface. The solder paste is pushed through the apertures in the stencil onto the pad sites on the PWB by means of a squeegee that slowly traverses the stencil. The stencil is then lifted away, leaving the paste deposits on the appropriate pads on the board. The components are then inserted on the PWB. The primary EHS hazards relate to the housekeeping and personal hygiene of the operators that apply the solder paste to the stencil surface, clean the squeegee and clean the stencils. The concentration of lead in the solder and the tendency of the dried solder paste to adhere to the skin and equipment/facility work surfaces requires the use of protective gloves, good clean-up of work surfaces, safe disposal of contaminated clean-up materials (and environmental handling) and strict personal hygiene by the operators (e.g., handwashing with soap prior to eating, drinking or applying cosmetics). Airborne exposure levels are typically below the detection limit for lead, and if good housekeeping/personal hygiene is used, blood lead readings are at background levels.
The adhesive application involves the automated dispensing of small quantities of an epoxy resin (typically a bisphenol A-epichlorhydrin mixture) onto the PWB surface and then “picking and placing” the component and inserting it through the epoxy resin onto the PWB. The EHS hazards primarily relate to the mechanical safety hazards of the “pick and place” units, due to their automated mechanical assemblies, component shuttles on the rear of the units and potential for serious injury if appropriate guarding, light curtains and hardware interlocks are not present.
Adhesive cure and solder reflow
The components that were attached by stencil printing or adhesive application are then carried on a fixed-height mechanical conveyor to an in-line reflow furnace that “sets off” the solder by reflowing the solder paste at approximately 200 to 400°C. The components that were attached by the epoxy adhesive are also run through a furnace that is downline of the solder reflow and is typically run at 130 to 160oC. The solvent components of the solder paste and epoxy resin are driven off during the furnace process, but the lead/tin component is not volatilized. A spider-web type residue will build up in the exhaust duct of the reflow furnace, and a metal mesh filter can be used to prevent this. PWBs can occasionally get caught in the conveyor system and will overheat in the furnace, causing objectionable odours.
Fluxing
To form a reliable solder joint at the PWB surface and the component lead, both must be free of oxidation and must remain so even at the elevated temperatures used in soldering. Also, the molten solder alloy must wet the surfaces of the metals to be joined. This means the solder flux must react with and remove metal oxides from the surfaces to be joined and prevent the re-oxidation of the cleaned surfaces. It also requires that the residues be either non-corrosive or easily removable. Fluxes for soldering electronic equipment fall into three broad categories, commonly known as rosin-based fluxes, organic or water-soluble fluxes and solvent-removable synthetic fluxes. Newer, low-solids “no clean” or non-volatile organic compound (NVOC) fluxes fall into the middle category.
Rosin-based fluxes
The rosin-based fluxes are the most commonly used fluxes in the electronics industry, either as spray flux or foam flux. The fluxer may be contained either internal to the wave soldering equipment or as a stand-alone unit positioned at the infeed to the unit. As a base, rosin-based fluxes have natural rosin, or colophony, the translucent, amber-coloured rosin obtained after turpentine has been distilled from the oleoresin and canal resin of pine trees. The resin is collected, heated and distilled, which removes any solid particles, resulting in a purified form of the natural product. It is a homogeneous material with a single melting point.
Colophony is a mixture of approximately 90% resin acid, which is mostly abietic acid (a non-water soluble, organic acid) with 10% neutral materials such as stilbene derivatives and various hydrocarbons. Figure 1 provides the chemical structures for abietic and pimaric acids.
Figure 1. Abietic & pimaric acids
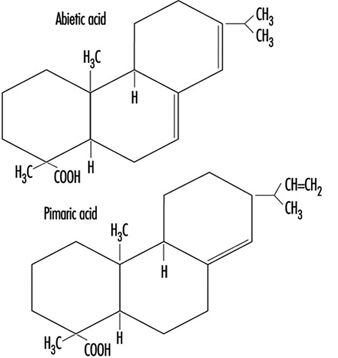
The active constituent is abietic acid, which at soldering temperature is chemically active and attacks the copper oxide on the PWB surface, forming copper abiet. Rosin-based fluxes have three components: the solvent or vehicle, the rosin and the activator. The solvent simply acts as a vehicle for the flux. To be effective the rosin must be applied to the board in a liquid state. This is accomplished by dissolving the rosin and activator in a solvent system, typically isopropyl alcohol (IPA) or multicomponent mixtures of alcohols (IPA, methanol or ethanol). Then the flux is either foamed onto the bottom surface of the PCB through the addition of air or nitrogen, or sprayed in a “low-solids” mixture which has a higher solvent content. These solvent components have different evaporation rates, and a thinner must be added to the flux mixture to maintain a constituent flux composition. The primary categories of rosin-based fluxes are: rosin mildly active (RMA), which are the typical fluxes in use, to which a mild activator is added; and rosin active (RA), to which a more aggressive activator has been added.
The primary EHS hazard of all the rosin-based fluxes is the alcohol solvent base. Safety hazards relate to flammability in storage and use, classification and handling as a hazardous waste, air emissions and treatment systems required to remove the VOCs and industrial hygiene issues related to inhalation and skin (dermal) exposure. Each of these items requires a different control strategy, employee education and training and permits/regulatory compliance (Association of the Electronics, Telecommunications and Business Equipment Industries 1991).
During the wave soldering process, the flux is heated to 183 to 399°C; airborne products generated include aliphatic aldehydes, such as formaldehyde. Many fluxes also contain an organic amine hydrochloride activator, which helps clean the area being soldered and releases hydrochloric acid when heated. Other gaseous components include benzene, toluene, styrene, phenol, chlorophenol and isopropyl alcohol. In addition to the gaseous components of heated flux, a significant amount of particulates are created, ranging in size from 0.01 micron to 1.0 micron, known as colophony fumes. These particulate materials have been found to be respiratory irritants and also respiratory sensitizers in sensitive individuals (Hausen, Krohn and Budianto 1990). In the United Kingdom, airborne exposure standards require that colophony fume levels be controlled to the lowest levels attainable (Health and Safety Commission 1992). Additionally, the American Conference of Governmental Industrial Hygienists (ACGIH) has established a separate threshold limit value for the pyrolysis products of rosin core solder of 0.1 mg/m3, measured as formaldehyde (ACGIH 1994). The Lead Industries Association, Inc. identifies acetone, methyl alcohol, aliphatic aldehydes (measured as formaldehyde), carbon dioxide, carbon monoxide, methane, ethane, abietic acid and related diterpene acids as typical decomposition products of rosin core soldering (Lead Industries Association 1990).
Organic fluxes
Organic fluxes, sometimes called intermediate fluxes or water-soluble fluxes, are composites that are more active than the rosin-based fluxes and less corrosive than acid fluxes used in the metal-working industries. The general active compounds of this class of fluxes fall into three groups:
- acids (e.g., stearic, glutamic, lactic, citric)
- halogens (e.g., hydrochlorides, bromides, hydrazine)
- amides and amines (e.g., urea, triethanolamine).
These materials and other parts of the formulation, such as surfactants to assist in reducing the solder surface tension, are dissolved in polyethylene glycol, organic solvents, water or usually a mixture of several of these. Organic fluxes must be considered corrosive, but can be cleaned off easily, with no more than hot water.
Synthetic activated (AS) fluxes
Whereas rosin-based fluxes are solid materials dissolved in a solvent, AS fluxes are usually totally liquid formulas (solvent + flux). The solvent carrier is driven off during the preheating phase of wave soldering, leaving a wet and oily residue on the PWB surface, which must be cleaned off immediately following soldering. The primary attribute of AS fluxes is their ability to be removed by the use of a suitable solvent, typically fluorocarbon based. With restrictions on the use of ozone-depleting substances such as fluorocarbons (Freon TF, Freon TMS and so on), the required use of these cleaning materials has severely restricted the use of this class of fluxes.
Low-solids “no clean” or non-VOC fluxes
The need for the elimination of the post-soldering cleaning of corrosive or tacky flux residues with fluorocarbon solvents has lead to the widespread usage of a new class of fluxes. These fluxes are similar in activity to the RMA fluxes and have a solids content of approximately 15%. The solids content is a measure of viscosity and equals the ratio of flux to solvent. The lower the solids contents, the higher the percentage of solvent. The higher the solids content, the more active the flux, and the more potential for needing a post-soldering cleaning step. Low-solids flux (LSF) is commonly used in the electronics industry and typically does not require the post-cleaning step. From an environmental air-emission perspective, the LSF eliminated the need for fluorocarbon vapour degreasing of wave soldered boards, but with their higher solvent content, they increased the quantity of alcohol-based solvents evaporated, resulting in higher VOC levels. VOC air-emission levels are tightly controlled in the United States, and in many locations worldwide. This situation was addressed by the introduction of “no clean” fluxes, which are water based (rather than solvent based) but contain similar activators and fluxing rosins. The primary active ingredients are dicarboxylic acid based (2 to 3%), typically glutaric, succinic and adipic acids. Surfactants and corrosion inhibitors (approximately 1%) are also included, resulting in a pH (acidity) of 3.0 to 3.5. These fluxes virtually eliminate VOC air emissions and other EHS hazards associated with using solvent-based fluxes. The decomposition products noted in rosin-based fluxes are still applicable, and the mild pH does require that the flux-handling equipment be acid resistant. Some anecdotal evidence points to potential dermal or respiratory problems from the dried, mildly acidic dicarboxylic acids and corrosion inhibitors that may become a residue on board carriers, carts and internal surfaces of wave soldering equipment utilizing these compounds. Also, the water component of these fluxes may not get adequately evaporated prior to hitting the molten solder pot, which can lead to splattering of the hot solder.
Wave soldering
The addition of flux to the bottom surface of the PWB can be accomplished either by a fluxer located internal to the wave soldering unit or a stand-alone unit at the entry to the wave soldering unit. Figure 2 provides a schematic representation of a standard wave soldering unit with the fluxer located internally. Either configuration is used to foam or spray the flux onto the PWB.
Figure 2. Wave solder unit schematic
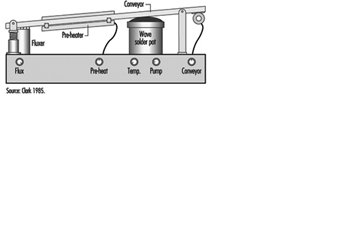
Preheating
The flux carriers must be evaporated prior to soldering. This is accomplished by using high-temperature preheaters to drive off the liquid components. Two basic types of preheaters are in use: radiant (hot rod) and volumetric (hot air). The radiant heaters are common in the United States and present the potential for ignition of excess flux or solvent or the decomposition of a PWB should it become immobilized under the preheater. Local exhaust ventilation is provided on the fluxer/preheater side of the wave soldering unit to capture and exhaust the solvent/flux materials evaporated during these operations.
Soldering
The solder alloy (typically 63% tin to 37% lead) is contained in a large reservoir called the solder pot, and is heated electrically to maintain the solder in a molten state. The heaters include a powerful bulk heater to do the initial melt and a smaller regulated heat supply to control the temperature thermostatically.
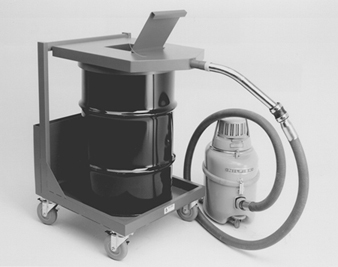
Successful board-level soldering requires that the design of the solder pot and recirculation pump systems continually provide a consistent “wave” of fresh solder. With soldering, the pure solder becomes contaminated with oxidized lead/tin compounds, metallic impurities and flux decomposition products. This dross forms on the surface of the molten solder, and the more dross formed, the more of a tendency for additional formation. Dross is harmful to the soldering process and the solder wave. If enough forms in the pot, it can get pulled into the recirculation pump and cause impeller abrasion. Wave solder operators are required to de-dross the wave on a routine basis. This process involves the operator straining the solidified dross from the molten solder and collecting the residues for reclaim/recycling. The process of de-drossing involves the operator physically opening up the rear access door (typically a gulf-wing configuration) adjacent to the solder pot and manually scooping out the hot dross. During this process, visible emissions are liberated from the pot which are highly irritating to the eyes, nose and throat of the operator. The operator is required to wear thermal gloves, an apron, safety glasses and a face shield and respiratory protection (for lead/tin particulate, corrosive gases (HCl) and aliphatic aldehyde (formaldehyde)). Local exhaust ventilation is provided from the interior of the wave soldering unit, but the solder pot is mechanically withdrawn from the main cabinet to allow the operator direct access to both sides of the hot pot. Once withdrawn, the local exhaust duct that is mounted in the cabinet becomes ineffective for removing the liberated materials. The primary health and safety hazards are: thermal burns from hot solder, respiratory exposure to materials noted above, back injuries from handling heavy solder ingots and dross drums and exposure to lead/tin solder residues/fine particulate during maintenance activities.
During the actual soldering process, the access doors are closed and the interior of the wave soldering unit is under a negative pressure due to the local exhaust ventilation provided on the flux and solder pot sides of the wave. This ventilation and the operating temperatures of the solder pot (typically 302 to 316°C, which is just above the melting point of solder), result in the minimal formation of lead fumes. The primary exposure to lead/tin particulate comes during the de-drossing and equipment maintenance activities, from the agitation of the dross in the pot, transfer to the reclaim vessel and clean-up of solder residues. Fine lead/tin particulate is formed during the de-drossing operation and can be released into the workroom and breathing zone of the wave solder operator. Various engineering control strategies have been devised to minimize these potential lead particulate exposures, including the incorporation of local exhaust ventilation to the reclaim vessel (see figure 3), use of HEPA vacuums for residue clean-up and flexible exhaust ducts with articulating arms to position ventilation at the hot pot during de-drossing. The use of brooms or brushes for sweeping up solder residues must be prohibited. Stringent housekeeping and personal hygiene practices must also be required. During wave solder equipment maintenance operations (which are done on a weekly, monthly, quarterly and annual basis), various components of the hot pot are either cleaned within the equipment or removed and cleaned in a locally exhausted hood. These cleaning operations may involve physically scraping or mechanically cleaning (using an electric drill and wire brush attachment) the solder pump and baffles. High levels of lead particulate are generated during the mechanical cleaning process, and the process should be performed in a locally exhausted enclosure.
Figure 3. Dross cart with vacuum cover
Inspection, touch-up and testing
Visual inspection and touch-up functions are conducted after wave soldering and involve the use of magnifying lenses/task lights for fine inspection and touch-up of imperfections. The touch-up function may involve the use of a stick-solder hand-held soldering iron and rosin core solder or brushing on a small amount of liquid flux and lead/tin wire solder. The visual fumes from the stick soldering involve breakdown products from the flux. Small quantities of lead/tin solder bead that did not adhere to the solder joint may present a housekeeping and personal hygiene issue. Either a fan adjacent to the workstation for general dilution ventilation away from the operator’s breathing zone or a more sophisticated fume exhaust system that captures the breakdown products at the tip of the soldering iron or adjacent to the operation should be provided. The fumes are then routed to an air scrubber exhaust system that incorporates HEPA filtration for particulates and activated carbon gas adsorption for the aliphatic aldehydes and hydrochloric acid gases. The effectiveness of these soldering exhaust systems is highly dependent on capture velocities, proximity to the point of fume generation and lack of cross drafts at the work surface. The electrical testing of the completed PCB requires specialized test equipment and software.
Reworking and repairing
Based on the results of the board testing, defective boards are evaluated for specific component failures and replaced. This reworking of the boards may involve stick soldering. If primary components on the PCB such as the microprocessor need replacement, a rework solder pot is used for immersing that portion of the board housing the defective component or joint in a small solder pot, removing the component and then inserting a new functional component back onto the board. If the component is smaller or more easily removed, an air vac system that uses hot air for heating the solder joint and vacuum for removing the solder is employed. The rework solder pot is housed within a locally exhausted enclosure that provides sufficient exhaust velocity to capture the flux decomposition products formed when the liquid solder is brushed on the board and solder contact made. This pot also forms dross and requires de-drossing equipment and procedures (on a much smaller scale). The air vac system does not require being housed within an enclosure, but the lead/tin solder removed must be handled as a hazardous waste and reclaimed/recycled.
Support operations—stencil cleaning
The first step in the PCB assembly process involved the use of a stencil for providing the pattern of bonding locations for the lead/tin solder paste to be squeegeed through. Typically, the stencil’s openings start to become clogged and the lead/tin solder paste residues must be removed on a per shift basis. A pre-cleaning is usually performed at the screen printer to capture gross contamination on the board, by wiping the board surface with a dilute alcohol mixture and disposable wipes. To completely remove the remaining residues a wet-cleaning process is required. In a system similar to a large dishwasher, hot water (57°C) and a chemical solution of dilute aliphatic amines (monoethanol amine) is used to chemically remove the solder paste from the stencil. Significant quantities of lead/tin solder are washed off the board and either deposited in the wash chamber or in solution in the water effluent. This effluent requires filtration or chemical removal of lead and pH adjustment for the corrosive aliphatic amines (using hydrochloric acid). Newer closed system stencil cleaners utilize the same wash solution until it is spent. The solution is transferred to a distillation unit, and the volatiles are distilled off until a semi-liquid residue is formed. This residue is then handled as a lead/tin-contaminated hazardous waste.
Computer Assembly Process
Once the final PCB is assembled, it is transferred to the systems assembly operation for incorporation into the final computer product. This operation is typically very labour intensive, with the component parts to be assembled supplied to the individual workstations on staging carts along the mechanized assembly line. The major health and safety hazards relate to materials movement and staging (fork-lifts, manual lifting), ergonomic implications of the assembly process (range of motion, insertion force required to “set” components, installation of screws and connectors) and final packaging, shrink wrapping and shipping. A typical computer assembly process involves:
- chassis/case preparation
- PCB (mother and daughter board) insertion
- primary component (floppy drive, hard drive, power supply, CD-ROM drive) insertion
- display assembly (portables only)
- mouse and keyboard insertion (portables only)
- cabling, connectors and speakers
- top cover assembly
- software downloading
- test
- rework
- battery charging (portables only) and packaging
- shrink wrapping and shipping.
The only chemicals that may be used in the assembly process involve the final cleaning of the computer case or monitor. Typically, a dilute solution of isopropyl alcohol and water or a commercial mixture of cleaners (e.g., Simple Green—a dilute butyl cellosolve and water solution) is used.
III-V Semiconductor Manufacturing
Silicon has historically dominated IC technology development as the primary semiconductor material. The principal focus in recent years on a silicon alternative has concentrated on III-V compounds, such as gallium arsenide (GaAs), as a substrate material. As a semiconductor material, GaAs exhibits increased capabilities over silicon, such as electron mobility 5 to 6 times that of silicon. This characteristic, coupled with the potential semi- insulating properties of GaAs, leads to increased performance in both speed and power consumption.
GaAs has a zinc blende-structure consisting of two interpenetrating face-centred cubic sublattices which relate to the growth of high quality ingot material. The technology involved in the growth of GaAs is considerably more complicated than that employed for silicon, as a more complicated two-phase equilibrium and a highly volatile component, arsenic (As), is involved. Precise control of the As vapour pressure in the ingot growth system is required to maintain exact stoichiometry of the GaAs compound during the growth process. Two primary categories of III-V semiconductor display and device production have economically feasible processing procedures—LED displays and microwave IC devices.
LEDs are fabricated from single-crystal GaAs in which p-n junctions are formed by the addition of suitable doping agents—typically tellurium, zinc or silicon. Epitaxial layers of ternary and quaternary III-V materials such as gallium arsenide phosphide (GaAsP) are grown on the substrate and result in an emission band of specific wavelengths in the visible spectrum for displays or in the infrared spectrum for emitters or detectors. For example, red light with a peak at about 650 nm comes from the direct recombination of the p-n electrons and holes. Green-emitting diodes are generally composed of gallium phosphide (GaP). The generalized LED processing steps are covered in this article.
Microwave IC devices are a specialized form of integrated circuit; they are used as high-frequency amplifiers (2 to 18 GHz) for radar, telecommunications and telemetry, as well as for octave and multi-octave amplifiers for use in electronic warfare systems. Microwave IC device manufacturers typically purchase single-crystal GaAs substrate, either with or without an epitaxial layer, from outside vendors (as do silicon device manufacturers). The major processing steps include liquid-phase epitaxial deposition, fabrication and non-fabrication processing similar to silicon device manufacturing. Processing steps which warrant description additional to that for LED processing are also discussed in this article.
Wafer Manufacturing
Similar to the silicon ingot growth process, elemental forms of gallium and arsenic, plus small quantities of dopant material—silicon, tellurium or zinc—are reacted at elevated temperatures to form ingots of doped single-crystal GaAs. Three generalized methods of ingot production are utilized:
- horizontal or vertical Bridgeman
- horizontal or vertical gradient freeze
- high- or low-pressure liquid encapsulated Czochralski (LEC).
The bulk polycrystalline GaAs compound is normally formed by the reaction of As vapour with Ga metal at elevated temperatures in sealed quartz ampoules. Typically, an As reservoir located at one end of the ampoule is heated to 618°C. This generates approximately 1 atmosphere of As vapour pressure in the ampoule, a prerequisite for obtaining stoichiometric GaAs. The As vapour reacts with the Ga metal maintained at 1,238°C and located at the other end of the ampoule in a quartz or pyrolytic boron nitride (PBN) boat. After the arsenic has been completely reacted, a polycrystalline charge is formed. This is used for single-crystal growth by programmed cooling (gradient freeze) or by physically moving either the ampoule or furnace to provide proper temperature gradients for growth (Bridgeman). This indirect approach (arsenic transport) for compounding and growth of GaAs is used because of the high vapour pressure of arsenic at the melting point of GaAs, about 20 atmospheres at 812°C and 60 atmospheres at 1,238°C, respectively.
Another approach to the commercial production of bulk single-crystal GaAs is the LEC technique. A Czochralski crystal puller is loaded with chunk GaAs in a crucible with an outer graphite susceptor. The bulk GaAs is then melted at temperatures close to 1,238°C, and the crystal is pulled in a pressurized atmosphere which could vary by manufacturer typically from a few atmospheres up to 100 atmospheres. The melt is completely encapsulated by a viscous glass, B2O3, which prevents melt dissociation as the As vapour pressure is matched or exceeded by the pressure of an inert gas (typically argon, or nitrogen) applied in the puller chamber. Alternatively, monocrystalline GaAs can be synthesized in situ by injecting the As into the molten Ga or combining As and Ga directly at high pressure.
GaAs wafer manufacturing represents the semiconductor manufacturing process with the greatest potential for significant, routine chemical exposures. While GaAs wafer manufacturing is done only by a small percentage of semiconductor manufacturers, particular emphasis is needed in this area. The large amounts of As used in the process, the numerous steps in the process and the low airborne exposure limit for arsenic make it difficult to control exposures. Articles by Harrison (1986); Lenihan, Sheehy and Jones (1989); McIntyre and Sherin (1989) and Sheehy and Jones (1993) provide additional information on the hazards and controls for this process.
Polycrystalline ingot synthesis
Ampoule load and seal
Elemental As (99.9999%) in chunk form is weighed and loaded into a quartz boat in an exhausted glove box. Pure liquid Ga (99.9999%) and the dopant material are also weighed and loaded into a quartz or pyrolytic boron nitride (PBN) boat(s) in the same manner. The boats are loaded into a long cylindrical quartz ampoule. (In the Bridgman and gradient freeze techniques, a seed crystal with the desired crystallographic orientation is also introduced, whereas in the two-stage LEC technique, where only poly GaAs is needed at this stage, a polycrystalline GaAs is synthesized without the seed crystal.)
The quartz ampoules are placed in a low-temperature furnace and heated while the ampoule is purged with hydrogen (H2), in a process known as hydrogen reduction reaction, to remove oxides. After purging with an inert gas such as argon, the quartz ampoules are attached to a vacuum pump assembly, evacuated, and the ampoule ends are heated and sealed with a hydrogen/oxygen torch. This creates a charged and sealed quartz ampoule ready for furnace growth. Hydrogen purging and the hydrogen/oxygen torch system is a potential fire/explosion hazard if proper safety devices and equipment are not in use (Wade et al. 1981).
Because the arsenic is being heated, this assembly is maintained under exhaust ventilation. Arsenic oxide deposits can form in the exhaust duct supporting this assembly. Care must be taken to prevent exposure and contamination should the ducts be disturbed in any way.
Storage and handling of arsenic chunks is a concern. For security, often the arsenic is kept under locked storage and with a tight inventory control. Typically the arsenic is also kept in a fire-rated storage cabinet to prevent its involvement in event of a fire.
Furnace growth
The Bridgeman and the gradient freeze methods of single-crystal ingot growth both utilize charged and sealed quartz ampoules in a high-temperature furnace enclosure which is vented to a wet scrubber system. The primary exposure hazards during furnace growth relate to the potential for the quartz ampoule to implode or explode during ingot growth. This situation occurs on a rather sporadic and infrequent basis, and is the result of one of the following:
- the partial pressure of the As vapour which results from the high temperatures used in the growth process
- devitrification of the quartz ampoule glass, which creates hairline cracks and the attendant potential for de-pressurization of the ampoule
- lack of accurate high-temperature control devices on the heating source—usually resistance type—with the resultant over-pressurization of the quartz ampoule
- thermocouple malfunction or failure, resulting in over-pressurization of the quartz ampoule
- excess As or too little Ga in the ampoule tube, resulting in extremely high As pressure, which can cause catastrophic depressurization of the ampoule.
The horizontal Bridgeman system consists of a multizone furnace in which the sealed quartz ampoule has separate temperature zones—the arsenic “cold” finger end at 618°C and the quartz gallium/dopant/seed crystal boat containing the melt at 1,238°C. The basic principle in the horizontal Bridgeman system involves traversing two heated zones (one above the melting point of GaAs, and one below the melting point) over a boat of GaAs to provide the precisely controlled freezing of molten GaAs. The seed crystal, maintained at all times in the freeze zone, provides the initial crystal starting structure, defining the direction and orientation of the crystalline structure within the boat. The quartz boat and ampoule of Ga and As are suspended within the heater chamber by a set of silicon carbide liners called support tubes, which are positioned within the resistance heater assembly to mechanically move the full distance of the ampoule. Additionally, the furnace assembly rests on a table which must be tilted during growth to provide the proper interface of the synthesized GaAs melt with the seed crystal.
In the gradient freeze method, a multizone high temperature furnace utilizing resistance heating is kept at 1,200 to 1,300 °C (1,237°C is the melt/freeze point of GaAs). The total ingot growth process duration is typically 3 days and comprises the following steps:
- furnace firing to temperature
- GaAs synthesis
- seeding the melt
- cool down/crystal growth.
The quartz ampoule is also tilted during the growth process by the use of a scissors-type manual jack.
Ampoule breakout
After the single-crystal GaAs ingot is grown within the sealed quartz ampoule, the ampoule must be opened and the quartz boat containing the ingot plus seed crystal removed. This is accomplished by one of the following methods:
- cutting off the sealed end of the ampoules with a wet circular saw
- heating and cracking the ampoule with a hydrogen/oxygen torch
- breaking the bagged ampoule with a hammer while under exhaust to control the airborne arsenic.
The quartz ampoules are recycled by wet etching the condensed arsenic on the interior surface with aqua regia (HCl,HNO3) or sulphuric acid/hydrogen peroxide (H2SO4/H2O2).
Ingot beadblasting/cleaning
In order to see polycrystalline defects and remove exterior oxides and contaminants, the single-crystal GaAs ingot must be beadblasted. The beadblasting is done in an exhausted glove-box unit utilizing either silicon carbide or calcined alumina blasting media. Wet cleaning is done in chemical baths provided with local exhaust ventilation and utilizing aqua regia or alcohol rinses (isopropyl alcohol and/or methanol).
Monocrystalline ingot growth
The polycrystalline GaAs ingot retrieved from the ampoule is broken into chunks, weighed and placed into a quartz or PBN crucible, and a boron oxide disc is placed on top of it. The crucible is then placed into a crystal grower (puller) pressurized in an inert gas, and heated to 1,238°C. At this temperature, the GaAs melts, with the lighter boron oxide becoming a liquid encapsulant to prevent the arsenic from dissociating from the melt. A seed crystal is introduced into the melt below the liquid cap and while counter-rotating, is slowly withdrawn from the melt, thereby solidifying as it leaves the “hot-zone”. This process takes approximately 24 hours, depending on the charge size and crystal diameter.
Once the growth cycle is completed, the grower is opened to retrieve the monocrystalline ingot and for cleaning. Some amount of arsenic escapes from the melt even with the liquid cap in place. There can be significant exposure to airborne arsenic during this step of the process. To control this exposure, the grower is cooled to below 100°C, which results in the deposition of fine arsenic particulate on the interior surface of the grower. This cooling helps minimize the amount of arsenic that becomes airborne.
Heavy deposits of arsenic-containing residues are left on the inside of the crystal grower. Removal of the residues during routine preventive maintenance can result in significant airborne concentrations of arsenic (Lenihan, Sheehy and Jones 1989; Baldwin and Stewart 1989; McIntyre and Sherin 1989). Controls used during this maintenance operation often include scavenger exhaust ventilation, disposable clothing and respirators.
When the ingot is removed, the grower is dismantled. A HEPA vacuum is utilized to pick up arsenic particulates on all parts of the grower. After vacuuming, the stainless steel parts are wiped with an ammonium hydroxide/hydrogen peroxide mixture to remove any residual arsenic, and the grower is assembled.
Wafer processing
X-ray diffraction
The crystalline orientation of the GaAs ingot is determined by the use of an x-ray diffraction unit, as in silicon ingot processing. A low-powered laser can be used to determine the crystalline orientation in a production setting; however, x-ray diffraction is more accurate and is the preferred method.
When x-ray diffraction is used, often the x-ray beam is totally enclosed in a protective cabinet that is periodically checked for radiation leakage. Under certain circumstances, it is not practical to fully contain the x-ray beam in an interlocked enclosure. In this instance operators may be required to wear radiation finger badges, and controls similar to those used for high-powered lasers are used (e.g., enclosed room with limited access, operator training, enclosing the beam as much as practical, etc.) (Baldwin and Williams 1996).
Ingot cropping, grinding and slicing
The ends or tails of the single-crystal ingot are removed, using a water-lubricated single-bladed diamond saw, with various coolants added to the water. The monocrystalline ingot is then placed on a lathe which shapes it into a cylindrical ingot of uniform diameter. This is the grinding process, which is also a wet process.
After cropping and grinding, GaAs ingots are epoxy or wax mounted to a graphite beam and sawed into individual wafers through the use of automatically operated inside diameter (ID) diamond-blade saws. This wet operation is done with the use of lubricants and generates a GaAs slurry, which is collected, centrifuged and treated with calcium fluoride to precipitate out the arsenic. The supernatant is tested to ensure that it does not contain excess arsenic, and the sludge is pressed into a cake and disposed of as hazardous waste. Some manufacturers send the collected slurry from the ingot cropping, grinding and slicing processes for Ga reclaim.
Arsine and phosphine may be formed from the reaction of GaAs and indium phosphide with moisture in the air, other arsenides and phosphides or when mixed with acids during the processing of gallium arsenide and indium phosphide; 92 ppb arsine and 176 ppb phosphine have been measured 2 inches away from the slicing blades used to cut GaAs and indium phosphide ingots (Mosovsky et al. 1992, Rainer et al. 1993).
Wafer washing
After GaAs wafers are dismounted from the graphite beam, they are cleaned by sequential dipping in wet chemical baths containing solutions of sulphuric acid/hydrogen peroxide or acetic acid and alcohols.
Edge profiling
Edge profiling is also a wet process performed on sliced wafers to form an edge around the wafer, which makes it less prone to breakage. Because only a thin cut is made on the surface of the wafer, only a small amount of slurry is generated.
Lapping and polishing
Wafers are wax mounted on a lapping or grinding plate, using a hotplate, and are lapped on a machine exerting a set rotational speed and pressure. A lapping solution is fed onto the lapping surface (a slurry of aluminium oxide, glycerine and water). After a brief lapping period, when the desired thickness is achieved, the wafers are rinsed and mounted on a mechanical polishing machine. Polishing is performed using a sodium bicarbonate, 5% chlorine, water (or sodium hypochlorite) and colloidal silica slurry. The wafers are then dismounted on a hotplate, the wax is removed using solvents and the wafers are cleaned.
Epitaxy
The single-crystal GaAs wafers are used as substrates for the growth of very thin layers of the same or other III-V compounds having the desired electronic or optical properties. This must be done in such a way as to continue, in the grown layer, the crystal structure of the substrate. Such crystal growth, in which the substrate determines the crystallinity and orientation of the grown layer, is called epitaxy, and a variety of epitaxial growth techniques are used in III-V display and device production. The most common techniques are:
- liquid-phase epitaxy (LPE)
- molecular-beam epitaxy (MBE)
- vapour-phase epitaxy (VPE)
- metallorganic chemical-vapour deposition (MOCVD)—also known as organometallic vapour-phase epitaxy (OMVPE).
Liquid-phase epitaxy
In LPE a layer of doped III-V material is grown directly on the surface of the GaAs substrate using a graphite holder that contains separate chambers for the material to be deposited on the wafers. Weighed quantities of deposition materials are added to the upper chamber of the holder, while the wafers are placed in a lower chamber. The assembly is placed within a quartz reaction tube under a hydrogen atmosphere. The tube is heated to melt the deposition materials, and when the melt equilibrates, the upper section of the holder is slid so that the melt is positioned over the wafer. The furnace temperature is then lowered to form the epitaxial layer.
LPE is primarily used in microwave IC epitaxy and for manufacturing LEDs of certain wavelengths. The major concern with this LPE process is the use of highly flammable hydrogen gas in the system, which is mitigated by good engineering controls and early warning systems.
Molecular-beam epitaxy
Vacuum epitaxy in the form of MBE has developed as a particularly versatile technique. MBE of GaAs consists of an ultrahigh-vacuum system containing sources for atomic or molecular beams of Ga and As and a heated substrate wafer. The molecular-beam sources are usually containers for liquid Ga or solid As. The sources have an orifice that faces the substrate wafer. When the effusion oven (or container) is heated, atoms of Ga or molecules of As effuse from the orifice. For GaAs, growth usually takes place with a substrate temperature above 450°C.
High exposures to arsine can occur during the maintenance of solid-source MBE systems. Room air concentrations of 0.08 ppm were detected in one study when the chamber of the MBE unit was opened for maintenance. The authors hypothesized that transient arsine generation may be caused by a reaction of very fine particulate arsenic with water vapour, with aluminium acting as a catalyst (Asom et al. 1991).
Vapour phase epitaxy
Degreased and polished wafers undergo an etch and clean step prior to epitaxy. This involves a sequential wet-chemical dipping operation utilizing sulphuric acid, hydrogen peroxide and water in a 5:1:1 ratio; a de-ionized water rinse; and an isopropyl alcohol clean/dry. A visual inspection is also performed.
Two major techniques of VPE are in use, based on two different chemistries:
- the III-halogens (GaCl3) and V-halogens (AsCl3) or V-hydrogen (AsH3 and PH3)
- the III metal-organics and V-hydrogen, such as Ga(CH3)3 and AsH3—OMVPE.
The thermochemistries of these techniques are very different. The halogen reactions are usually “hot” to “cold” ones, in which the III-halogen is generated in a hot zone by reaction of the III element with HCl, and then diffuses to the cold zone, where it reacts with the V species to form III-V material.The metal-organic chemistry is a “hot wall” process in which the III metal-organic compound “cracks” or pyrolyzes away the organic group and the remaining III and hydride V react to form III-V.
In VPE, GaAs substrate is placed in a heated chamber under a hydrogen atmosphere. The chamber is heated by either RF or resistance heating. HCl is bubbled through a Ga boat, forming gallium chloride, which then reacts with the AsH3 and PH3 near the surface of the wafers to form GaAsP, which is deposited as the epitaxial layer on the substrate. There are a number of dopants that can be added (depending on the product and the recipe). These include low concentrations of tellurides, selenides and sulphides.
A common technique used for VPE in LED processing is the III-halogen and V-hydrogen (hydride) system. It involves a two-cycle process—initially growing the epitaxial layer of GaAsP on the GaAs substrate and, lastly, an etch cycle to clean the graphite/quartz reactor chamber of impurities. During the epitaxial growth cycle, the pre-cleaned GaAs wafers are loaded onto a carousel located inside a quartz reactor chamber containing a reservoir of elemental liquid gallium through which anhydrous HCl gas is metered, forming GaCl3. The hydride/hydrogen gas mixtures (e.g., 7% AsH3/H2 and 10% PH3/H2) are also metered into the reactor chamber with the addition of ppm concentrations of organometallic dopants of tellurium and selenium. The chemical species in the hot zone, the upper part of the reaction chamber, react, and, in the cold zone, the lower part of the chamber, form the desired layer of GaAsP on the wafer substrate as well as on the interior of the reactor chamber.
Effluents from the reactor are routed to a hydrogen torch system (combustion chamber or burnbox) for pyrolysis and are vented to a wet scrubber system. Alternatively, the reactor effluents can be bubbled through a liquid medium to trap most of the particulates. The safety challenge is reliance on the reactors themselves to “crack” the gases. The efficiency of these reactors is approximately 98 to 99.5%; therefore, some unreacted gases may be coming off of the bubbler when they are taken out by the operators. There is off-gassing of various arsenic- and phosphorus-containing compounds from these bubblers, requiring that they be quickly transported to a vented sink for maintenance, where they are purged and cleaned, in order to keep personnel exposure low. The occupational hygiene challenge of this process is profiling the exhaust effluent, since most of the out-gassed compounds from various parts of the reactor, especially the bubbler, are unstable in air and the available conventional collection media and analytical techniques are not discriminatory towards the different species.
Another concern is prescrubbers for VPE reactors. They can contain high concentrations of arsine and phosphine. Exposures above occupational exposure limits can occur if these prescrubbers are indiscriminately opened (Baldwin and Stewart 1989).
The etch cycle is performed at the end of the growth cycle and on new reactor parts to clean the interior surface of impurities. Undiluted HCl gas is metered into the chamber for periods of approximately 30 minutes, and the reactor is heated to over 1,200°C. The effluents are vented to the wet scrubber system for neutralization.
At the end of both the growth and etch cycles, an extended N2 purge is used to flush the reactor chamber of toxic/flammable and corrosive gases.
Reactor cleaning
After each growth cycle, the VPE reactors must be opened, the wafers removed, and both the upper and the lower portion of the reactor physically cleaned. The cleaning process is performed by the operator.
The quartz prescrubber from the reactors is physically moved out of the reactor and placed in an exhausted sink where it is purged with N2, rinsed with water and then submerged in aqua regia. This is followed by another water rinse prior to drying the part. The intention of the N2 purge is to simply displace the oxygen due to the presence of unstable, pyrophoric phosphorus. Some residues containing various arsenicals and phosphorus-containing by-products are left on these parts even after the purge and water rinse. The reaction between these residues and the strong oxidizer/acid mixture could potentially generate significant amounts of AsH3 and some PH3. There is also exposure potential with other maintenance procedures in the area.
The bottom part of the quartz reaction chamber and the bottom plate (base plate) are scraped clean using a metal tool, and the particulate material (mixture of GaAs, GaAsP, arsenic oxides, phosphorus oxides and entrapped hydride gases) is collected in a metal container positioned below the vertical reactor. A high-efficiency vacuum is used for the final clean-up.
Another operation with potential for chemical exposure is cleaning the reactor’s trap. The trap cleaning is done by scraping the graphite parts from the upper chamber, which have a crust of all the previously mentioned by-products plus arsenic chloride. The scraping procedure generates dust and is performed in a ventilated sink to minimize exposure to the operators. The process exhaust line, which contains all the by-products plus moisture that forms a liquid waste, is opened and drained into a metal container. The HEPA vacuum is used to clean off any dust particles that may have escaped during the transfer of the graphite parts and from the raising and lowering of the bell jar, which knocks off any loose particles.
Metallorganic chemical-vapour deposition
MOCVD is widely used in the preparation of III-V devices. In addition to the hydride gases used as source materials in other CVD systems (e.g., arsine and phosphine), less toxic liquid alternatives (e.g., tertiary butyl arsine and tertiary butyl phosphine) are also used in MOCVD systems, along with other toxics such as cadmium alkyls and mercury (Content 1989; Rhoades, Sands and Mattera 1989; Roychowdhury 1991).
While VPE refers to a compound material deposition process, MOCVD refers to the parent chemistry sources used in the system. Two chemistries are used: halides and metallorganic. The VPE process described above is a halide process. A group III halide (gallium) is formed in the hot zone and the III-V compound is deposited in the cold zone. In the metallorganic process for GaAs, trimethylgallium is metered into the reaction chamber along with arsine, or a less toxic liquid alternative such as tertiary butyl arsine, to form gallium arsenide. An example of a typical MOCVD reaction is:
(CH3)3Ga + AsH3 → GaAs + 3CH4
There are other chemistries used in MOCVD processing of LEDs. Organometallics used as the group III elements include trimethyl gallium (TMGa), triethyl gallium (TEGa), TM indium, TE indium and TM aluminium. Hydride gases are also used in the process: 100% AsH3 and 100% PH3. The dopants used in the process are: dimethyl zinc (DMZ), bis-cyclopentadienyl magnesium and hydrogen selenide (H2Se). These materials are reacted within the reaction chamber under a low-pressure H2 atmosphere. The reaction produces epitaxial layers of AlGaAs, AlInGaP, InAsP and GaInP. This technique has been traditionally used in the manufacturing of semiconductor lasers and optical communication devices such as transmitters and receivers for fibre optics. The AlInGaP process is used to produce very bright LEDs.
Similar to the VPE process, MOCVD reactor and part cleaning presents challenges for both the process as well as the occupational hygienist, especially if large amounts of concentrated PH3 is used in the process. The “cracking” efficiency of these reactors is not as great as that of the VPE reactors. There is a significant amount of phosphorus generated, which is a fire hazard. The cleaning procedure involves the use of dilute hydrogen peroxide/ammonium hydroxide on various parts from these reactors, which is an explosion hazard if, due to operator error, a concentrated solution is used in the presence of a metal catalyst.
Device Fabrication
The GaAs wafer with an epitaxially grown layer of GaAsP on the upper surface proceeds to the device fabrication processing sequence.
Nitride deposition
A high-temperature CVD of silicon nitride (Si3N4) is performed, using a standard diffusion furnace. The gaseous sources are silane (SiH4) and ammonia (NH3) with a nitrogen carrier gas.
Photolithographic process
The standard photoresist, aligning/exposure, developing and stripping process is utilized as in silicon device processing (see the section on lithography in the article “Silicon semiconductor manufacturing”).
Wet etching
Various mixtures of wet-chemical acid solutions are used in plastic baths in locally exhausted etch stations, some provided with vertically mounted laminar HEPA filtered supply systems. The primary acids in use are sulphuric (H2SO4), hydrofluoric (HF), hydrochloric (HCl) and phosphoric (H3PO4). As in silicon processing, hydrogen peroxide (H2O2) is used with sulphuric acid, and ammonium hydroxide (NH4OH) provides a caustic etch. A cyanide solution (sodium or potassium) is also used for etching aluminium. However, cyanide etching is slowly being phased out as other etchants are developed for this process. As an alternative to wet etching, a plasma etching and ashing process is used. The reactor configurations and reactant gases are very similar to those utilized in silicon device processing.
Diffusion
A closed ampoule zinc diarsenide solid source diffusion is performed in a vacuum diffusion furnace at 720°C, utilizing a N2 carrier gas. Arsenic and zinc arsenide are used as dopants. They are weighed in a glove box in the same manner as in bulk substrate.
Metallization
An initial aluminium evaporation is performed utilizing an E-beam evaporator. After backlapping, a last step gold evaporation is performed utilizing a filament evaporator.
Alloying
A final alloying step is performed in a low-temperature diffusion furnace, utilizing a nitrogen inert atmosphere.
Backlapping
Backlapping is done to remove deposited materials (GaAsP, Si3N4 and so on) from the backside of the wafer. The wafers are wax mounted to a lapper plate and wet lapped with a colloidal silica slurry. Then the wax is removed by wet stripping the wafers in an organic stripper in a locally exhausted wet chemical etch station. Another alternative to wet lapping is dry lapping, which utilizes aluminium oxide “sand”.
There are a number of resists and resist strippers used, typically containing sulphonic acid (dodecyl benzene sulphonic acid), lactic acid, aromatic hydrocarbon, naphthalene and catechol. Some resist strippers contain butyl ethanoate, acetic acid and butyl ester. There are both negative and positive resists and resist strippers used, depending on the product.
Final test
As in silicon device processing, the completed LED circuits are computer tested and marked (see “Silicon semiconductor manufacturing”). Final inspection is performed and then the wafers are electrically tested to mark defective dies. A wet saw is then used to separate the individual dies, which are then sent for assembly.
Liquid Crystal Displays
Liquid crystal displays (LCDs) have been commercially available since the 1970s. They are commonly used in watches, calculators, radios and other products requiring indicators and three or four alphanumeric characters. Recent improvements in the liquid crystal materials allow large displays to be manufactured. While LCDs are only a small portion of the semiconductor industry, their importance has grown with their use in flat-panel displays for portable computers, very light laptop computers and dedicated word processors. The importance of LCDs is expected to continue to grow as they eventually replace the last vacuum tube commonly used in electronics—the cathode ray tube (CRT) (O’Mara 1993).
The manufacture of LCDs is a very specialized process. Industrial hygiene monitoring results indicate very low airborne contaminant levels for the various solvent exposures monitored (Wade et al. 1981). In general, the types and quantities of toxic, corrosive and flammable solid, liquid and gaseous chemicals and hazardous physical agents in use are limited in comparison with other types of semiconductor manufacturing.
Liquid crystal materials are rod-like molecules exemplified by the cyanobiphenyl molecules shown in figure 1. These molecules possess the property of rotating the direction of polarized light passing through. Although the molecules are transparent to visible light, a container of the liquid material appears milky or translucent instead of transparent. This occurs because the long axis of the molecules are aligned at random angles, so the light is scattered randomly. A liquid crystal display cell is arranged so that the molecules follow a specific alignment. This alignment can be changed with an external electric field, allowing the polarization of incoming light to be changed.
Figure 1. Basic liquid crystal polymer molecules
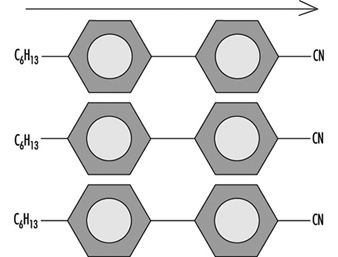
In the manufacture of flat panel displays, two glass substrates are processed separately, then joined together. The front substrate is patterned to create a colour filter array. The rear glass substrate is patterned to form thin film transistors and the metal interconnect lines. These two plates are mated in the assembly process and, if necessary, sliced and separated into individual displays. Liquid crystal material is injected into a gap between the two glass plates. The displays are inspected and tested and a polarizer film is applied to each glass plate.
Numerous individual processes are required to manufacture flat panel displays. They require specialized equipment, materials and processes. Certain key processes are outlined below.
Glass Substrate Preparation
The glass substrate is an essential and expensive component of the display. Very tight control of the optical and mechanical properties of the material is required at every stage of the process, especially when heating is involved.
Glass fabrication
Two processes are used to make very thin glass with very precise dimensions and reproducible mechanical properties. The fusion process, developed by Corning, utilizes a glass feed rod that melts in a wedge-shaped trough and flows up and over the sides of the trough. Flowing down both sides of the trough, the molten glass joins into a single sheet at the bottom of the trough and can be drawn downward as a uniform sheet. The thickness of the sheet is controlled by the speed of drawing down the glass. Widths of up to almost 1 m can be obtained.
Other manufacturers of glass with the appropriate dimensions for LCD substrates use the float method of manufacturing. In this method, the molten glass is allowed to flow out onto a bed of molten tin. The glass does not dissolve or react with the metallic tin, but floats on the surface. This allows gravity to smooth the surface and allow both sides to become parallel. (See the chapter Glass, ceramics and related materials.)
A variety of substrate sizes are available extending to 450 × 550 mm and larger. Typical glass thickness for flat panel displays is 1.1 mm. Thinner glass is used for some smaller displays, such as pagers, telephones, games and so on.
Cutting, bevelling and polishing
Glass substrates are trimmed to size after the fusion or float process, typically to about 1 m on a side. Various mechanical operations follow the forming process, depending on the ultimate application of the material.
Since glass is brittle and easily chipped or cracked at the edges, these are typically bevelled, chamfered or otherwise treated to reduce chipping during handling. Thermal stresses at edge cracks accumulate during substrate processing and lead to breakage. Glass breakage is a significant problem during production. Besides the possibility of employee cuts and lacerations, it represents a yield loss, and glass fragments might remain in equipment, causing particulate contamination or scratching of other substrates.
Increased substrate size results in increased difficulties for glass polishing. Large substrates are mounted to carriers using wax or other adhesive and polished using a slurry of abrasive material. This polishing process must be followed by a thorough chemical cleaning to remove any remaining wax or other organic residue, as well as the metallic contaminants contained in the abrasive or polishing medium.
Cleaning
Cleaning processes are used for bare glass substrates and for substrates covered with organic films, such as colour filters, polyimide orientation films and so on. Also, substrates with semiconductor, insulator and metal films require cleaning at certain points within the fabrication process. As a minimum, cleaning is required prior to each masking step in colour filter or thin film transistor fabrication.
Most flat panel cleaning employs a combination of physical and chemical methods, with selective use of dry methods. After chemical etching or cleaning, substrates are usually dried using isopropyl alcohol. (See table 1.)
Table 1. Cleaning of flat panel displays
|
Physical cleaning |
Dry cleaning |
Chemical cleaning |
|
Brush scrubbing |
Ultraviolet ozone |
Organic solvent* |
|
Jet spray |
Plasma (oxide) |
Neutral detergent |
|
Ultrasonic |
Plasma (non-oxide) |
|
|
Megasonic |
Laser |
Pure water |
* Common organic solvents used in the chemical cleaning include: acetone, methanol, ethanol, n-propanol, xylene isomers, trichloroethylene, tetrachloroethylene.
Colour Filter Formation
Colour filter formation on the front glass substrate includes some of the glass finishing and preparation steps common to both the front and rear panels, including the bevelling and lapping processes. Operations such as patterning, coating and curing are performed repeatedly on the substrate. Many points of similarity with silicon wafer processing exist. Glass substrates are normally handled in track systems for cleaning and coating.
Colour filter patterning
Various materials and application methods are used to create colour filters for various flat panel display types. Either a dyestuff or a pigment can be used, and either one can be deposited and patterned in several ways. In one approach, gelatin is deposited and dyed in successive photolithographic operations, using proximity printing equipment and standard photoresists. In another, pigments dispersed in photoresist are employed. Other methods for forming colour filters include electrodeposition, etching and printing.
ITO Deposition
After colour filter formation, the final step is the sputter deposition of a transparent electrode material. This is indium-tin oxide (ITO), which is actually a mixture of the oxides In2O3 and SnO2. This material is the only one suitable for the transparent conductor application for LCDs. A thin ITO film is required on both sides of the display. Typically, ITO films are made using vacuum evaporation and sputtering.
Thin films of ITO are easy to etch with wet chemicals such as hydrochloric acid, but, as the pitch of the electrodes becomes smaller and features become finer, dry etching may be necessary to prevent undercutting of the lines due to overetching.
Thin Film Transistor Formation
Thin film transistor formation is very similar to the fabrication of an integrated circuit.
Thin film deposition
The substrates begin the fabrication process with a thin film application step. Thin films are deposited by CVD or physical vapour deposition (PVD). Plasma-enhanced CVD, also known as glow discharge, is used for amorphous silicon, silicon nitride and silicon dioxide.
Device patterning
Once the thin film has been deposited, a photoresist is applied and imaged to allow etching of the thin film to the appropriate dimensions. A sequence of thin films is deposited and etched, as with integrated circuit fabrication.
Orientation Film Application and Rubbing
On both the upper and bottom substrate, a thin polymer film is deposited for orientation of the liquid crystal molecules at the glass surface. This orientation film, perhaps 0.1 μm thick, may be a polyimide or other “hard” polymer material. After deposition and baking, it is rubbed with fabric in a specific direction, leaving barely detectable grooves in the surface. Rubbing can be done with a once through cloth on a belt, fed from a roller on one side, passing under a roller which contacts the substrate, onto a roller on the other side. The substrate moves underneath the cloth in the same direction as the cloth. Other methods include a travelling brush that moves across the substrate. The nap of the rubbing material is important. The grooves serve to aid the liquid crystal molecules to align at the substrate surface and to assume the proper tilt angle.
The orientation film can be deposited by spin coating or by printing. The printing method is more efficient in material usage; 70 to 80% of the polyimide is transferred from the printing roll to the substrate surface.
Assembly
Once the substrate rubbing step is completed, an automated assembly line sequence is begun, which consists of:
- adhesive application (required for sealing the panels)
- spacer application
- location and optical alignment of one plate with respect to the other
- exposure (heat or UV) to cure the adhesive and bond the two glass plates together.
Automated transport of both top and bottom plates occurs through the line. One plate receives the adhesive, and the second plate is introduced at the spacer applicator station.
Liquid Crystal Injection
In the case where more than one display has been constructed on the substrate, the displays are now separated by slicing. At this point, the liquid crystal material can be introduced into the gap between the substrates, making use of a hole left in the seal material. This entrance hole is then sealed and prepared for final inspection. Liquid crystal materials are often delivered as two or three component systems which are mixed at injection. Injection systems provide mixing and purging of the cell to avoid trapping bubbles during the filling process.
Inspection and Test
Inspection and functional testing are performed after assembly and liquid crystal injection. Most defects are related to particles (including point and line defects) and cell gap problems.
Polarizer Attachment
The final manufacturing step for the liquid crystal display itself is the application of the polarizer to the outside of each glass plate. Polarizer films are composite films which contain the pressure-sensitive adhesive layer needed to attach the polarizer to the glass. They are applied by automated machines which dispense the material from rolls or pre-cut sheets. The machines are variants of labelling machines developed for other industries. The polarizing film is attached to both sides of the display.
In some cases, a compensation film is applied prior to the polarizer. Compensation films are polymer films (e.g., polycarbonate and polymethyl methacrylate) that are stretched in one direction. This stretching changes the optical properties of the film.
A completed display will ordinarily have driver integrated circuits mounted on or near one of the glass substrates, usually the thin film transistor side.
Hazards
Glass breakage is a significant hazard in LCD manufacturing. Cuts and lacerations can occur. Exposure to chemicals used for cleaning is another concern.
Reporting and Compiling Accident Statistics
The Need for Reporting and Compiling Accident Data
The primary purpose of assembling and analysing occupational accident data is to provide knowledge for use in the prevention of occupational injuries, fatalities and other forms of harm such as toxic exposures with long-term effects. These data are also useful in assessing needs for compensating victims for injuries previously incurred. Additional, more specific purposes for the compilation of accident statistics include the following:
- to estimate the causes and magnitude of accident problems
- to identify and prioritize the need for preventive measures
- to evaluate the effectiveness of preventive measures
- to monitor risks, issue warnings and conduct awareness campaigns
- to provide feedback for those involved in prevention.
Often, an overview of the number of accidents occurring on an annual basis is desired. A frequency is often used for this purpose, comparing the number of accidents to a measure relating to the risk group and expressed, for example, in terms of accidents per 100,000 workers or per 100,000 working hours. Such annual counts serve the purpose of revealing variations in an accident rate from one year to another. However, while they may indicate the sorts of accidents that require the most urgent preventive action, by themselves they do not furnish guidance as to the form that this action should take.
The need for accident information pertains to the following three levels of function that make use of it:
- At the workplace level within the individual enterprise, accident data are used in local safety activities. The best opportunities for tackling specific risk factors are to be found immediately at the workplace itself.
- At the level of authority responsible for legislation, accident data are used to regulate the working environment and to promote safety at the workplace. It is possible not only to exert control over the workplace at this level but also to carry out general statistical analyses for use in overall preventive work.
- At the level of authority responsible for payments of compensation to accident victims, accident data are used to help determine rates.
The Role of the Organization in Compiling Accident Information
In many countries it is a legal requirement that enterprises keep statistics of occupational accidents which result in injury, fatality or toxic exposure to a worker. The purpose of this is usually to call attention to risks that have actually led to these types of accidents, with safety activities focusing chiefly on the particular accident and the study of the event itself. However, it is more common for accident information to be collected and recorded systematically, a function that is ordinarily carried out at a higher level.
Since the actual circumstances of most accidents are special, wholly identical accidents seldom occur, and prevention based on the analysis of the individual accident very readily tends to become a highly specific matter. By systematically compiling accident information it is possible to obtain a broader view of those areas where specific risks are to be found, and to uncover the less obvious factors instrumental in the causation of the accident. Specific work processes, specific work teams or work with specific machinery can give rise to highly circumstantial accidents. However, a close study of the types of accidents associated with a given class of uniform work can disclose such factors as inexpedient work processes, incorrect use of materials, difficult working conditions, or lack of adequate worker instruction. An analysis of numerous recurring accidents will reveal the fundamental factors to be dealt with when preventive action is taken.
Reporting Accident Information to Safety Authorities
Legislation requiring the reporting of occupational accidents varies widely from country to country, with the differences chiefly relating to the classes of employers and others to whom the laws apply. Countries that place significant emphasis on safety at the workplace usually mandate that accident data be reported to the authority responsible for supervising compliance with safety legislation. (In some cases, legislation requires reporting of occupational accidents that result in absence from work, the duration of such absence varying from 1 to 3 days in addition to the day of the accident.) Common to most legislation is the fact that reporting is linked with some sort of penalty or compensation for the consequences of accidents.
For the purpose of supplying a sound foundation for the prevention of occupational accidents, it is necessary to secure accident information pertaining to all sectors and to all types of trades. A basis of comparison should be provided at the national level in order to allow prevention action to be prioritized and in order that knowledge of risks associated with tasks across different sectors may be turned to good account in preventive work. It is therefore recommended that the duty of compiling occupational accident information at the national level apply to all occupational accidents of a designated seriousness, no matter whether they concern employees of firms or the self-employed, persons working at temporary jobs or regular salary earners, or workers in the public or private sectors.
While employers, generally speaking, have a duty to report accidents, it is a duty carried out with varying degrees of enthusiasm. The extent of compliance with the obligation to report accidents depends on the incentives driving the employer to do so. Some countries have a rule, for instance, according to which employers will be compensated for an accident victim’s lost-time pay, an arrangement that gives them good reason to report occupational injuries. Other countries penalize employers who are found to be not reporting accidents. Where these sorts of incentives do not exist, the merely legal obligation binding upon the employer is not always observed. It is moreover recommended that occupational accident information intended for preventive applications be given to the authority responsible for preventive activities, and be kept separate from the compensating authority.
What Information is to be Compiled?
There are three basic classes of information obtainable by means of accident recording:
- Information identifying where the accidents occur - that is, sectors, trades, work processes and so on. This knowledge can be used to determine where preventive action is needed.
- Information showing how the accidents occur, the situations in which they occur and the ways in which the injuries come about. This knowledge can be used to determine the type of preventive action needed.
- Information relating to the nature and seriousness of the injuries, describing, for example, the parts of the body affected and the health consequences of the injuries. Such knowledge is to be used for prioritizing preventive action in order to ensure that action is taken where the risk is highest.
It is necessary to compile a certain basic complement of data to properly document when and where an accident occurs and to analyse how it occurs. At the enterprise level, the data that are collected are more detailed than those assembled at the national level, but reports generated at the local level will contain items of information valuable at all levels. Table 1 illustrates particular sorts of information that might be recorded by way of describing an individual accident. The items especially relevant to the task of preparing statistics relating to the accident are described more fully below.
Table 1. Informational variables characterizing an accident
|
Actions |
Items |
|
Step 1 |
|
|
Activity of the victim: e.g., operating a machine, performing maintenance, driving, walking, etc. |
Component related to the activity of the victim: e.g., power press, tool, vehicle, floor, etc. |
|
Step 2 |
|
|
Deviant action: e.g., explosion, structural failure, trip, lost control of, etc. |
Component related to deviant action: e.g., pressure vessel, wall, cable, vehicle, machine, tool, etc. |
|
Step 3 |
|
|
Action leading to injury: e.g., struck by, crushed, trapped, in contact with, bitten by, etc. |
Agent of injury: e.g., brick, ground, machine, etc. |
Accident identification number. All occupational accidents must be assigned a unique identifying number. It is especially advantageous to use a numerical identifier for the purpose of computerized filing and subsequent processing.
Personal identification number and date. Registration of the victim is an essential part of accident identification. The number can be the worker’s birthday, employment number, social security number or some other unique identifier. Recording both a personal identification number and the date of the accident will prevent duplicated registration of the same accident event, and also enables a check to be made as to whether the accident has been reported. The link between information contained in the accident report with the personal identification number can be protected for the purpose of security.
Nationality. The nationality of the victim may be an especially important item of information in countries with a significantly large foreign labour force. A double-digit code number can be selected from among those listed in the DS/ISO Standard 3166.
Occupation. An occupation registration number can be chosen from the list of four-digit international occupation codes supplied by the International Standard Classification of Occupations (ISCO).
Enterprise. The name, address and identification number of the enterprise are used in the recording of accidents at the national level (although the name and address cannot be used for computer recording). The production sector of the enterprise will usually have been registered with its industrial injury insurance carrier or recorded in connection with the registration of its workforce. A numerical sector identifier can be assigned according to the five-digit NACE international classification system.
The work process. A vital component of information relating to occupational accidents is a description of the work process carried out at the time the accident occurred. Identification of the work process is a prerequisite for accurately targeted prevention. It should be noted that the work process is the actual work function which the victim was performing at the time of the accident and may not necessarily be identical to the work process that caused the injury, fatality or exposure.
The accident event. An accident event normally comprises a chain of events. There is often a tendency on the part of investigators to focus on the part of the event cycle in which the injury actually occurred. From the point of view of prevention, however, a description of that part of the event cycle in which something went wrong, and of what the victim was doing when the event occurred, is just as important.
The consequences of the accident. After the injured part of the body is specified and the type of injury described (this is done partly by coding from a checklist and partly from the description in the event cycle), information is recorded describing the seriousness of the injury, whether it resulted in absence from work (and for how long), or whether it was fatal or involved invalidity. Detailed information in terms of longer-duration absence from work, hospitalization, or disablement is normally available from compensation offices and the social security system.
For recording purposes, the examination of accident events is therefore divided into the following three information components:
- The activity associated with an accident is that which was being carried out by the victim at the time of the accident. It is recorded by means of an action code and a technology code. In this connection, the concept of technology is a broad one, covering such instrumentalities as machines, materials, building components and even animals. At present, there exists no international classification for technology, although Denmark has developed a classification scheme for this purpose.
- The injury event is the deviant event which led to the accident. This is recorded by means of a code for the deviation and by one or two codes for the technology which formed part of the deviation.
- The mode of injury is recorded by using a code for the manner in which the victim came into contact with the injury-causing factor and another code for the technology which caused the injury.
The following examples illustrate the application of these categories of analysis:
- In the event that a worker trips over a hose-pipe while walking and falls, striking his or her head against a table, the activity is walking, the injury event is tripping over the hose-pipe, and the mode of injury is striking the head against the table.
- While a worker is standing near a wall, a tank explodes, causing the wall to collapse on the victim. The activity is merely standing near the wall, the injury event is the explosion of the tank, and the mode of injury is the impact of the wall upon the victim.
Reporting Accident Information
The information to be obtained for each accident can be recorded in a report form similar to that shown in figure 1.

The information from the report form can be recorded on a computer by using classification keys. (Where international classification systems can be recommended, these are mentioned in the description of the individual information variables, given above.) Classifications for the other variables used to record occupational injuries have been developed by the Danish Working Environment Service, and principles to be used in establishing a harmonized recording system form part of a proposal drafted by the European Union.
The Use of Accident Statistics
Accident statistics form a valuable instrument in a wide range of contexts: mapping, monitoring and warning, prioritization of areas for prevention, specific prevention measures, and information retrieval and research. One area may overlap with another, but the principles of application vary.
Mapping
Mapping of occupational accident data involves the extraction of predetermined sorts of information from an accumulation of registered data and the analysis of the interrelationships among them. The following examples will illustrate the utility of the mapping applications.
- Mapping of industrial sectors. Data relating to industrial sectors may be mapped by extracting an appropriate selection of the reports contained in a data register and carrying out the desired analysis. If a trade such as the building industry is of particular interest, reports registered with the International Standard Industrial Classification (ISIC) and coded from 50,000 to 50,199 (building and construction) can be selected. Reports for this trade can then be mapped to show, for example, the geographical location of the enterprises, and the age, sex and occupation of each accident victim.
- Mapping of injuries. If selection is based on a specific category of injuries, the reports can be extracted and mapped to show, for example, the trades in which these accidents occur, the occupational categories involved, the age groups affected, the activities in which the accidents occurred and the kind of technology most often involved.
- Mapping of enterprises. An evaluation on the enterprise level of accident trends (and thus of the internal work environment of the enterprise) can be carried out by mapping the notified occupational accidents that have occurred over a given time period. In addition, the enterprise will be able to compare its individual position with regard to technology, composition of personnel and other areas of concern with the trade as a whole, and thus determine whether its status in these respects is typical of the trade. Furthermore, if a trade proves to contain a number of typical work environment problems, it will be advisable to investigate whether these problems exist within the individual enterprise.
Monitoring and warning
Monitoring is an ongoing surveillance process accompanied by warning of major risks, and particularly of changes in such risks. Changes observed in incoming accident reports either may be indicative of changes in the pattern of reporting, or, more seriously, may reflect genuine changes in risk factors. Major risks may be said to exist where there is a high frequency of injuries, where many serious injuries occur and where there is a large human exposure group.
Establishment of priorities
Establishment of priorities is the selection of the most important risk areas or work-environment problems for preventive action. Through the results of mapping surveys and monitoring and warning activities, a register of occupational accidents can be built which can contribute to this establishment of priorities, the elements of which might include the following:
- risks involving serious consequences
- risks which carry a high probability of injury to a large proportion of the exposure group
- risks to which large groups of people are exposed.
Data drawn from a register of occupational accidents can be used in the establishment of priorities on several levels, perhaps at the overall national level or at the more particular enterprise level. Whatever the level, the analyses and assessments can be made on the basis of the same principles.
Prevention
Analyses and documentation which are used for preventive purposes are generally highly specific and concentrated in limited areas which are, however, treated in great depth. An example of such an analysis is the campaign against fatal accidents conducted by the Danish National Labour Inspection Service. Preliminary mapping surveys identified the trades and work functions in which fatal accidents occurred. Farm tractors were selected as a focal area for analysis. The purpose of the analysis was then to determine what it was that made tractors so dangerous. Questions were investigated as to who drove them, where they were operated, when the accidents occurred and, in particular, what types of situations and events led to the accidents. The analysis produced a description of seven typical situations which most frequently led to accidents. Based on this analysis a preventive programme was formulated.
The number of occupational accidents in a single enterprise is often too small to yield workable statistics for preventive analysis. An analysis of the pattern of accidents may be able to be used to prevent repetition of specific injuries, but can hardly be successful in preventing the occurrence of accidents which in one way or another differ from earlier instances. Unless the focus of investigation is quite a large enterprise, such analyses are therefore best performed on a group of enterprises of very similar nature or on a group of production processes of the same type. For example, an analysis of the lumber industry shows that accidents occurring with cutting machines principally involve finger injuries. Transport accidents predominantly consist of foot and leg injuries, and brain damage and eczema are the most common hazards in the surface-treatment trade. A more detailed analysis of the relevant work processes within the industry can reveal which situations typically cause accidents. Based on this information, experts in the relevant industry can then pinpoint when such situations are likely to arise, and the possibilities for prevention.
Information retrieval and research
One of the most common uses of such information systems as filing and library systems is the retrieval of information of a specific and well-defined nature for the purpose of safety research. For instance, in a study whose aim was to formulate regulations concerning work on roofs, the doubt was raised whether any particular risk was attached to such work. The prevailing belief was that people were very seldom injured by falling from roofs while working. However, in this instance, a register of occupational accidents was used to retrieve all reports in which people had been injured by falling from roofs, and a considerable number of cases were indeed discovered, confirming the importance of continuing to formulate regulations in this area.
Analysis and Reporting: Accident Investigation
It is a paradox that the prevention of work-related accidents did not emerge very early as an absolute necessity, since health and safety is fundamental to work itself. In fact it was not until the beginning of the twentieth century that accidents at work ceased to be considered inevitable and their causation became a subject to be investigated and used as a basis for prevention. However, accident investigation long remained cursory and empirical. Historically, accidents were first conceived of as simple phenomena—that is, as resulting from a single (or principal) cause and a small number of subsidiary causes. It is now recognized that accident investigation, which is aimed at identifying the causes of the phenomenon so as to avert its reoccurrence, depends both on the concept underlying the process of investigation and on the complexity of the situation to which it is applied.
Causes of Accidents
It is indeed true that in the most precarious situations, accidents are often the result of a fairly simple sequence of a few causes that can be rapidly traced to basic technical problems that even a summary analysis can reveal (equipment badly designed, working methods undefined, etc.). On the other hand, the more closely that the material elements of work (machines, installations, the arrangement of the workplace, etc.) conform with the requirements of safe work procedures, standards and regulations, the safer the work situation becomes. The result is that an accident can then occur only when a group of exceptional conditions are present simultaneously—conditions that are becoming ever more numerous. In such cases, the injury or damage appears as the final result of a frequently complex network of causes. This complexity is actually evidence of progress in prevention, and requires appropriate methods of investigation. Table 1 lists the principal concepts of the accident phenomenon, their characteristics and implications for prevention.
Table 1. Principal concepts of the accident phenomenon, their characteristics and the implications for prevention
|
Concept or “accident phenomenon” |
Significant elements (objectives, procedures, limits, etc.) |
Main consequences for prevention |
|
Basic concept (accident as |
The objective is to identify “the” single or main cause |
Simple prevention measures concerning the immediate antecedent of the injury (individual protection, instructions about taking care, protection of dangerous machines) |
|
Concept focused on regulatory measures |
Focus on looking for who is responsible; the “enquiry” essentially identifies infringements and faults Rarely concerned about the conditions generating the situations examined |
Prevention usually limited to reminders about existing regulatory requirements or formal instructions |
|
Linear (or quasi-linear) concept (“domino” model) |
Identification of a chronological succession of “dangerous conditions” and “dangerous acts” |
Conclusions generally concerned with the dangerous acts |
|
Multifactorial concept |
Exhaustive research to gather the facts (circumstances, causes, factors, etc.) |
Concept not conducive to the search for solutions case by case (clinical analysis) and better adapted to the identification of statistical aspects (trends, tables, graphs, etc.) |
|
Systematic concept |
Identification of the network of factors of each accident |
Methods centred on clinical analysis |
Nowadays, a work accident is generally viewed as an index (or symptom) of dysfunction in a system consisting of a single production unit, such as a factory, workshop, team or work position. It is the nature of a system that its analysis requires the investigator to examine not only the elements that make up the system but also their relationships with one another and with the work environment. Within the framework of a system, the accident investigation seeks to trace to its origins the sequence of basic dysfunctions that have resulted in the accident and, more generally, the network of antecedents of the undesired event (accident, near accident or incident).
The application of methods of this kind, such as the STEP method (sequentially timed events plotting procedures) and the “tree of causes” method (similar to fault or event trees analyses), allows the accident process to be visualized in the form of an adjusted graph that illustrates the multicausality of the phenomenon. Because these two methods are so similar, it would represent a duplication of effort to describe them both; accordingly, this article concentrates on the tree of causes method and, where applicable, notes its main differences from the STEP method.
Information Useful for the Investigation
The initial phase of the investigation, the gathering of information, must allow the course of the accident to be described in concrete, precise and objective terms. The investigation therefore sets out to ascertain the tangible facts, taking care not to interpret them or to express an opinion about them. These are the antecedents of the accident, of which there are two types:
- those of an unusual nature (changes or variations) in relation to the “normal” or expected course of the work
- those of a permanent nature that have played an active part in the occurrence of the accident through the medium of or in combination with the unusual antecedents.
For example, insufficient protection of a machine (a permanent antecedent) can turn out to be a factor in an accident if it allows the operator to take up a position in a dangerous area in order to deal with a particular incident (unusual antecedent).
The information gathering is carried out at the location of the accident itself as soon as possible after its occurrence. It is preferably carried out by persons who know the operation or process and who try to obtain a precise description of the work without limiting themselves to the immediate circumstances of the damage or injury. The investigation is initially effected mainly by means of interviews, if possible with the worker or operator, victims and eyewitnesses, other members of the work team, and the hierarchical supervisors. If appropriate it is completed by means of a technical investigation and the use of outside expertise.
The investigation seeks to identify, in order of priority, the unusual antecedents, and to determine their logical connections. An effort is made at the same time to reveal the permanent antecedents that have allowed the accident to occur. In this way the investigation is able to go back to a stage more remote than the immediate antecedents of the accident. These more remote antecedents may concern individuals, their tasks, the equipment that they use, the environment in which they function and the safety culture. By proceeding in the way just described, it is generally possible to draw up a lengthy list of antecedents, but it will usually be difficult to make immediate use of the data. The interpretation of the data is made possible thanks to a graphic representation of all the antecedents involved in the genesis of the accident—that is, a tree of causes.
Constructing a Tree of Causes
The tree of causes presents all the antecedents that have been gathered which have given rise to the accident, as well as the logical and chronological links that connect them; it is a representation of the network of antecedents that have directly or indirectly caused the injury. The tree of causes is constructed starting from the end-point of the event - that is, the injury or damage—and working backwards toward the cause by systematically asking the following questions for each antecedent that has been gathered:
- By which antecedent X was antecedent Y directly caused?
- Was antecedent X sufficient in itself to give rise to antecedent Y?
- If not, have there been other antecedents (X1, X2 Xn) that were equally necessary in order to give rise directly to antecedent Y?
This set of questions can reveal three types of logical connection, summarized in figure 1, among the antecedents.
Figure 1. Logical links used in the "tree of causes" method
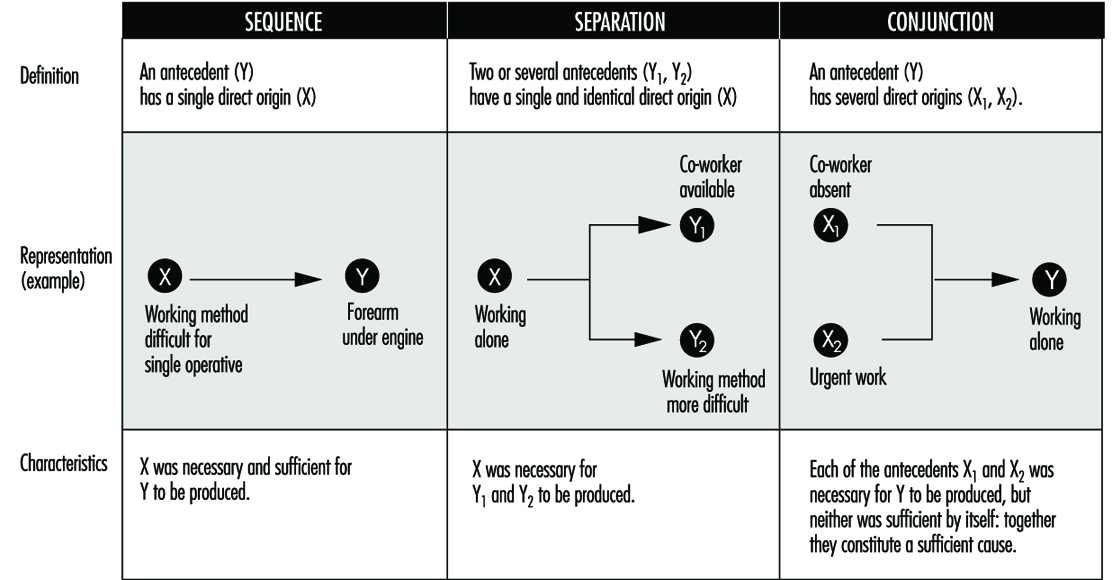
The logical coherence of the tree is checked by asking the following questions for each antecedent:
- If X had not taken place, would Y nevertheless have occurred?
- In order for Y to occur, was X, and only X, necessary?
Moreover, the construction of the tree of causes in itself induces the investigators to pursue the information-gathering, and therefore the investigation, to a point well before the accident occurred. When completed, the tree represents the network of antecedents that have given rise to the injury—they are in fact the accident factors. As an example, the accident summarized below produced the tree of causes shown in figure 2.
Figure 2. Tree of causes of an accident suffered by an apprentice mechanic when remounting an engine in a car
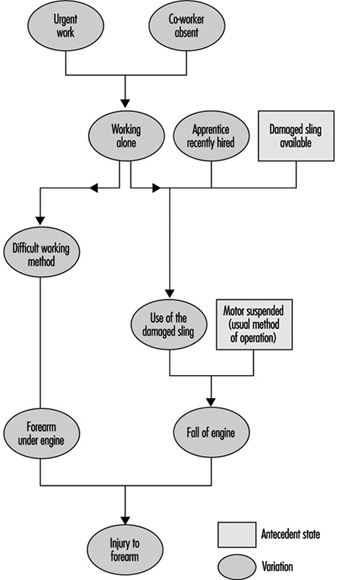
Accident Summary Report: An apprentice mechanic, recently recruited, had to work alone in an emergency. A worn sling was being used to suspend an engine that had to be remounted, and during this operation the sling broke and the engine fell and injured the mechanic’s arm.
Analysis by the STEP Method
According to the STEP method (figure 3), each event is set out graphically so as to show the chronological order of its appearance, keeping one line per “agent” concerned (an agent is the person or thing that determines the course of events constituting the accident process). Each event is described precisely by indicating its beginning, duration, starting and ending place and so on. When there are several plausible hypotheses, the investigator can show them in the network of events by using the logical relationship “or”.
Figure 3. Example of representation possible by the STEP method
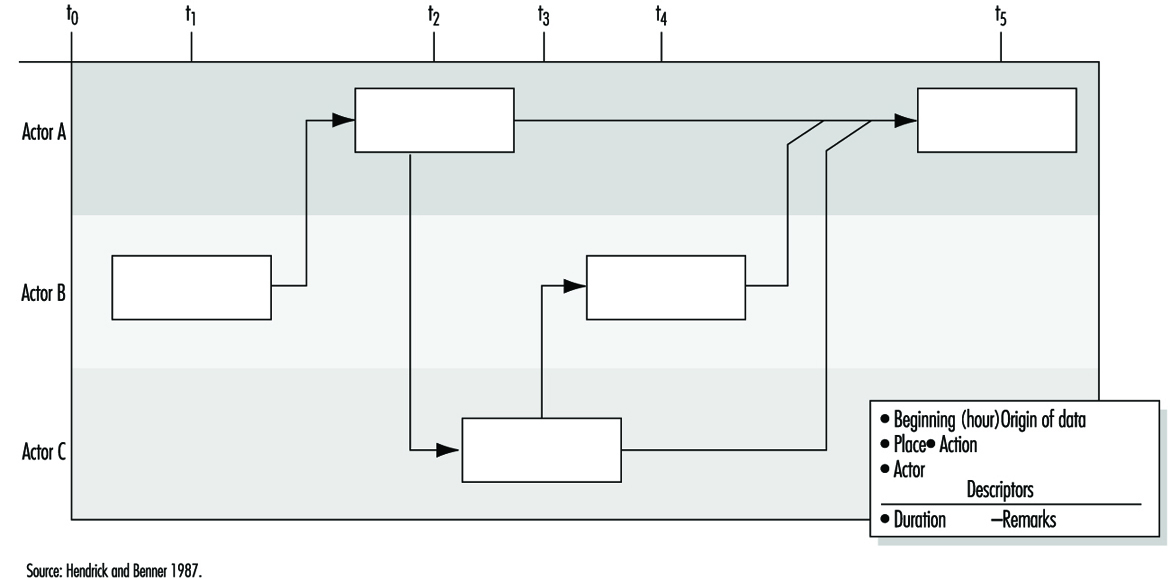
Analysis by the Tree of Causes Method
Making use of the tree of causes for the purposes of accident analysis has two objectives:
- making the reoccurrence of the same accident impossible
- averting the occurrence of more or less similar accidents - that is, accidents whose investigation would reveal common factors with the accidents that have already occurred.
Given the logical structure of the tree, the absence of a single antecedent would have prevented the occurrence of the accident. One judicious prevention measure would therefore suffice, in principle, to satisfy the first objective by preventing the reoccurrence of the same accident. The second objective would require that all the factors discovered should be eliminated, but in practice the antecedents are not all of equal importance for the purposes of prevention. It is therefore necessary to draw up a list of antecedents requiring reasonable and realistic preventive action. If this list is long, a choice has to be made. This choice has more chance of being appropriate if it is made within the framework of a debate between the partners concerned in the accident. Moreover, the debate will gain in clarity to the extent that it is possible to assess the cost-effectiveness of each measure proposed.
Effectiveness of Preventive Measures
The effectiveness of a preventive measure can be judged with the help of the following criteria:
The stability of the measure. The effects of a preventive measure must not disappear with time: informing the operators (in particular, reminding them of instructions) is not a very stable measure because its effects are often transient. The same is moreover true of some protective devices when they are easily removable.
The possibility of integrating safety. When a safety measure is added on - that is, when it does not contribute directly to production - it is said that safety is not integrated. Whenever this is so, it is observed that the measure tends to disappear. Generally speaking, any preventive measure entailing an additional cost for the operator should be avoided, whether it is a physiological cost (increasing the physical or nervous load), a psychological cost, a financial cost (in the case of salary or output) or even a simple loss of time.
The non-displacement of the risk. Some preventive measures may have indirect effects that are detrimental to safety. It is therefore always necessary to foresee the possible repercussions of a preventive measure on the system (job, team or workshop) in which it is inserted.
The possibility of general application (the notion of potential accident factor). This criterion reflects the concern that the same preventive action may be applicable to other jobs than the one affected by the accident under investigation. Whenever possible, an effort should be made to go beyond the particular case that has given rise to the investigation, an effort that often requires a reformulation of the problems discovered. The information obtained from an accident may thus lead to preventive action relating to factors that are unknown but present in other work situations where they have not yet given rise to accidents. For this reason they are called “potential accident factors”. This notion opens the way to the early detection of risks, mentioned later.
The effect on root “causes”. As a general rule, the prevention of accident factors near to the point of injury eliminates certain effects of dangerous situations, while prevention acting well upstream of the injury tends to eliminate the dangerous situations themselves. An in-depth investigation of accidents is justified to the extent that the preventive action is equally concerned with the upstream factors.
The time taken for application. The need to act as rapidly as possible after the occurrence of an accident so as to avoid its reoccurrence is often reflected in the application of a simple preventive measure (an instruction, for example), but this does not eliminate the need for other more lasting and more effective action. Every accident must therefore give rise to a series of proposals whose implementation is the subject of follow-up.
The above criteria are intended to give a better appreciation of the quality of preventive action proposed after each accident investigation. However, the final choice is not made solely on this basis, as other considerations, such as economic, cultural or social ones, must also be taken into account. Finally, the measures decided upon must obviously respect the regulations in force.
Accident Factors
The lessons drawn from each accident analysis deserve to be recorded systematically so as to facilitate passing from knowledge to action. Thus figure 4 consists of three columns. In the left-hand column are noted the accident factors requiring preventive measures. Possible preventive action is described in the middle column for each factor decided upon. After the discussion mentioned above, the action selected is recorded in this part of the document.
Figure 4. Lessons drawn from accidents and the use of these lessons
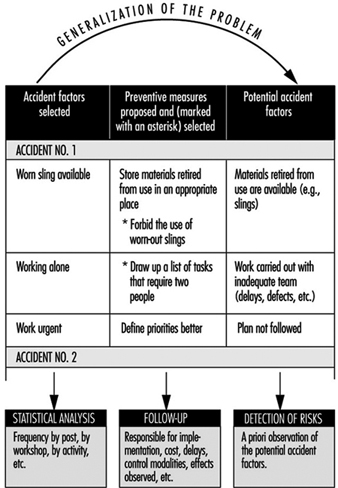
The right-hand column covers the potential accident factors suggested by the factors listed in the left-hand column: it is considered that each accident factor discovered is often only a particular case of a more general factor known as a potential accident factor. The passage from the particular case to the more general case is often made spontaneously. However, each time that an accident factor is expressed in such a fashion that it is not possible to encounter it elsewhere than in the situation in which it has appeared, a more general formulation must be considered. In doing this, it is necessary to avoid two opposite pitfalls so as to utilize the notion of potential accident factor effectively in the early detection of risks arising later. A formulation that is too circumscribed does not permit systematic detection of the factors, whereas one that is too wide makes the notion unworkable and is of no further practical interest. The detection of potential accident factors thus presupposes their being well formulated. This detection can then be carried out in two ways, which are moreover complementary:
- either by looking for the possible presence of potential factors already known at the level of a job or a wider area (workshop, service)
- or by looking for jobs where a factor already determined may be observed.
Usefulness, Effectiveness and Limitations of Accident Investigation
Usefulness. As compared to non-systematic investigations, methods of accident investigation based on a systematic concept have numerous advantages, which include the following:
- They allow the causal network of each accident to be defined collectively, from which it is easier to devise new preventive measures and foresee their impact without being limited to the direct causes of the injury.
- They provide those involved in the analysis with a richer and more realistic mental representation of the “accident phenomenon” that permits a global understanding of work situations.
- In-depth accident investigations (especially when they are extended to cover incidents and undesired events) can become a means and appropriate occasion for dialogue between management and operators.
Effectiveness. In order to be effective, accident investigation requires that four conditions are satisfied concurrently:
- an evident commitment on the part of the top management of the establishment, who must be able to ensure the systematic implementation of such procedures
- training of the investigators
- management, supervisors and workers fully informed concerning the aims of the investigation, its principles, the requirements of the method and the results expected
- real improvements in safety conditions that will encourage those involved in future investigations.
Limitations. Even when carried out very well, accident investigation suffers from a double limitation:
- It remains a procedure for investigating risks a posteriori (in the manner of systems analysis), with the aim of correcting existing situations. It does not therefore dispense with the need for a priori (prospective) investigations, such as the ergonomic investigation of jobs or, for complex systems, safety investigations.
- The usefulness of accident investigations also varies with the safety level of the establishment where they are applied. In particular, when the safety level is high (the accident rate is low or very low), it is evident that serious accidents result from the conjunction of numerous independent random factors that are relatively harmless from the safety viewpoint when considered outside the context under investigation.
Workplace Inspection and Regulatory Enforcement
Inspection Systems
Auditing has been defined as “the structured process of collecting independent information on the efficiency, effectiveness and reliability of the total safety management system and drawing up plans for corrective action” (Successful Health & Safety Management 1991).
The workplace inspection therefore is not only the final stage in setting up a safety management programme but is also a continuing process in its maintenance. It can be conducted only where a properly devised management system for safety has been established. Such a system first envisages a formal policy statement from management setting out its principles for creating a healthy and safe working environment and then establishing the mechanisms and the structures within the organization whereby these principles will be effectively implemented. Management must furthermore be committed to providing adequate resources, both human and financial, to support the system’s mechanisms and structures. Thereafter, there must be detailed planning for safety and health, and the defining of measurable goals. Systems must be devised to ensure that safety and health performance in practice can be measured against established norms and against previous achievements. Only when this structure is in place and is operating can an effective management audit system be applied.
Complete safety and health management systems can be devised, produced and implemented from within the resources of larger enterprises. Additionally, there are a number of safety management control systems which are available from consultants, insurance companies, government agencies, associations and specialist companies. It is a matter for the enterprise to decide whether it should produce its own system or obtain outside services. Both alternatives are capable of producing excellent results if there is a genuine commitment by management to apply them diligently and to make them work. But for their success, they do depend heavily on the quality of the audit system.
Management Inspections
The inspection procedure must be as painstaking and objective as the company’s financial inspection. The inspection must first determine whether the company’s statement of policy on safety and health is properly reflected in the structures and mechanisms created to implement it; if not, then the inspection may recommend that the fundamental policy be reappraised or suggest adjustments or alterations to the existing structures and mechanisms. A similar process must be applied to safety and health planning, to the validity of the goal-setting norms, and to the measurement of performance. The results of any inspection must be considered by the top management of the enterprise, and any correctives must be endorsed and implemented through that authority.
In practice it is undesirable, and often impractical, to undertake a complete inspection of all of a system’s features and their application throughout every department of the enterprise at one time. More usually, the inspection procedure concentrates on one feature of the total safety management system throughout the plant, or alternatively on the application of all the features in one department or even subdepartment. But the objective is to cover all the features in all departments over an agreed period in order to validate the results.
To this extent management inspection should be regarded as a continuous process of vigilance. The need for objectivity is clearly of considerable importance. If inspections are conducted in-house then there must be a standardized inspection procedure; inspections should be undertaken by staff who have been properly trained for this purpose; and those selected as inspectors must not assess the departments in which they normally work, nor should they assess any other work in which they have a personal involvement. Where reliance is placed on consultants this problem is minimized.
Many major companies have adopted this type of system, either devised internally or obtained as a proprietary scheme. When the systems have been carefully followed through from policy statement to inspection, feedback and corrective actions, a substantial reduction in accident rates, which is the prime justification for the procedure, and increased profitability, which is a welcome secondary outcome, should result.
Inspections by Inspectorates
The legal framework which is designed to afford protection to people at work must be properly administered and effectively applied if the purpose of the regulatory legislation is to be achieved. Most countries have therefore adopted the broad model of an inspection service which has the duty of ensuring that safety and health legislation is enforced. Many countries see safety and health issues as part of a complete labour relations package covering industrial relations, wages and holiday agreements, and social benefits. In this model, safety and health inspections are one element of the labour inspector’s duties. A different model also exists in which the state inspectorate is exclusively concerned with safety and health legislation, so that workplace inspections concentrate solely on this aspect. Further variations are evident in the division of the inspection functions between either a national inspectorate or a regional/provincial inspectorate, or indeed, as in Italy and the United Kingdom, for example, as a working combination of both national and regional inspectorates. But whichever model is adopted, the essential function of the inspectorate is to determine compliance with the legislation by a programme of planned inspections and investigations at the workplace.
There can be no effective inspection system unless those who undertake this work are given adequate powers to carry it out. There is much common ground among inspectorates as regards the powers given to them by their legislators. There must always be the right of entry to premises, which is clearly fundamental for inspection. Thereafter there is the legal right to examine relevant documents, registers and reports, to interview members of the workforce either individually or collectively, to have unrestricted access to trade union representatives at the workplace, to take samples of substances or materials at use in the workplace, to take photographs and, if appropriate, to take written statements from people working at the premises.
Additional powers are often provided to enable inspectors to rectify conditions which might be an immediate source of danger or ill health to the workforce. Again there is a wide variety of practices. Where standards are so poor that there is an imminent risk of danger to the workforce, then an inspector may be authorized to serve a legal document on the spot prohibiting the use of the machinery or plant, or stopping the process until the risk has been effectively controlled. For a lower order of risk, inspectors can issue a legal notice formally requiring that measures be taken within a given time to improve standards. These are effective ways of rapidly improving working conditions, and are often a form of enforcement preferable to formal court proceedings, which may be cumbersome and slow in securing remediation.
Legal proceedings have an important place in the hierarchy of enforcement. There is an argument that because court proceedings are simply punitive and do not necessarily result in changing attitudes to safety and health at work, they should therefore be invoked only as a last resort when all other attempts at securing improvements have failed. But this view has to be set against the fact that where legal requirements have been ignored or disregarded, and where people’s safety and health have been significantly put at risk, then the law must be enforced and the courts must decide the issue. There is the further argument that those enterprises which disregard safety and health legislation may thereby enjoy an economic advantage over their competitors, who provide adequate resources to comply with their legal duties. Prosecution of those who persistently disregard their duties is therefore a deterrent to the unscrupulous, and an encouragement to those who try to observe the law.
Every inspection service has to determine the proper balance between providing advice and enforcing the law in the course of inspection work. A special difficulty emerges in connection with the inspection of small enterprises. Local economies, and indeed national economies, are often underpinned by industrial premises each employing fewer than 20 people; in the case of agriculture, the employment figure per unit is very much less. The function of the inspectorate in these cases is to use the workplace inspection to provide information and advice not only on legal requirements, but on practical standards and effective ways of meeting those standards. The technique must be to encourage and stimulate, rather than to immediately enforce the law by punitive action. But even here the balance is a difficult one. People at work are entitled to safety and health standards irrespective of the size of the enterprise, and it would therefore be wholly misguided for an inspection service to ignore or minimize risks and to curtail or even forgo enforcement simply to nurture the existence of the economically fragile small enterprise.
Consistency of Inspections
In the view of the complex nature of their work - with its combined needs for legal, prudential, technical and scientific skills, inspectors do not - indeed should not - adopt a mechanistic approach to inspection. This constraint, combined with a difficult balance between the advisory and enforcement functions, creates yet another concern, that of the consistency of inspection services. Industrialists and trade unions have a right to expect a consistent application of standards, whether technical or legal, by inspectors across the country. In practice this is not always easy to achieve, but it is something for which the enforcing authorities must always strive.
There are ways of achieving an acceptable consistency. First, the inspectorate should be as open as possible in publishing its technical standards and in publicly setting out its enforcement policies. Second, through training, the application of peer review exercises, and internal instructions, it should be able both to recognize a problem and to provide systems to deal with it. Finally, it should ensure that there are procedures for industry, the workforce, the public and the social partners to secure redress if they have a legitimate grievance over inconsistency or other forms of maladministration associated with inspection.
Frequency of Inspections
How frequently should the inspectorates undertake inspections of the workplace? Again there is considerable variation in the way this question may be answered. The International Labour Organization (ILO) holds the view that the minimum requirement should be that every workplace should receive an inspection from the enforcing authorities at least once each year. In practice, few countries manage to produce a programme of work inspection which meets this objective. Indeed, since the major economic depression in the late 1980s some governments have been curtailing inspection services by budget limitations that result in cutbacks in the number of inspectors, or by restrictions on recruiting new staff to replace those who retire.
There are different approaches to determine how frequently inspections should be made. One approach has been purely cyclical. Resources are deployed to provide inspection of all premises on a 2-yearly, or more likely a 4-yearly, basis. But this approach, though possibly having the appearance of equity, treats all premises as the same regardless of size or risk. Yet enterprises are manifestly diverse as regards safety and health conditions, and to the extent that they differ, this system may be regarded as mechanistic and flawed.
A different approach, adopted by some inspectorates, has been to attempt to draw up a programme of work based on hazard; the greater the hazard either to safety or health, the more frequent the inspection. Hence resources are applied by the inspectorate to those places where the potential for harm to the workforce is the greatest. Although this approach has merits, there are still considerable problems associated with it. First, there are difficulties in accurately and objectively assessing hazard and risk. Second, it extends very considerably the intervals between inspections of those premises where hazards and risks are considered to be low. Therefore, extended periods may elapse during which many of the workforce may have to forgo that sense of security and assurance which inspection can provide. Furthermore, the system tends to presume that hazards and risks, once assessed, do not radically change. This is far from being the case, and there is the danger that a low-rated enterprise may change or develop its production in such a way as to increase hazards and risk without the inspectorate’s being aware of the development.
Other approaches include inspections based on facility injury rates which are higher than the national averages for the particular industry, or immediately following a fatal injury or major catastrophe. There are no short and easy answers to the problem of determining the frequency of inspection, but what seems to be happening is that inspection services in many countries are too often significantly under-resourced, with the result that the real protection to the workforce afforded by the service is being progressively eroded.
Inspection Goals
Inspection techniques in the workplace vary according to the size and complexity of the enterprise. In smaller companies, the inspection will be comprehensive and will assess all hazards and the extent to which the risks arising from the hazards have been minimized. The inspection will therefore ensure that the employer is fully aware of safety and health problems and is given practical guidance on how they may be addressed. But even in the smallest enterprise the inspectorate should not give the impression that fault-finding and the application of suitable remedies are the function of the inspectorate and not of the employer. Employers must be encouraged by inspection to control and effectively manage safety and health problems, and they must not abdicate their responsibilities by awaiting an inspection from the enforcement authorities before taking needed action.
In larger companies, the emphasis of inspection is rather different. These companies have the technical and financial resources to deal with safety and health problems. They should devise both effective management systems to resolve the problems, as well as management procedures to check that the systems are working. In these circumstances, the inspection emphasis should therefore be on checking and validating the management control systems found at the workplace. The inspection should therefore not be an exhaustive examination of all items of plant and equipment to determine their safety, but rather to use selected examples to test the effectiveness or otherwise of the management systems for ensuring safety and health at work.
Worker Involvement in Inspections
Whatever the premises, a critical element in any type of inspection is contact with the workforce. In many smaller premises, there may be no formal trade union structure or indeed any workforce organization at all. However, to ensure the objectivity and acceptance of the inspection service, contact with individual workers should be an integral part of the inspection. In larger enterprises, contact should always be made with trade union or other recognized worker representatives. Legislation in some countries (Sweden and the United Kingdom, for example) gives official recognition and powers to trade union safety representatives, including the right to make workplace inspections, to investigate accidents and dangerous occurrences and in some countries (though this is exceptional) to stop plant machinery or the production process if it is imminently dangerous. Much useful information can be gained from these contacts with the workers, which should feature in every inspection, and certainly whenever the inspectorate is conducting an inspection as the result of an accident or a complaint.
Inspection Findings
The final element in an inspection is to review the inspection findings with the most senior member of management on the site. Management has the prime responsibility to comply with legal requirements on safety and health, and therefore no inspection should be complete without management’s being fully aware of the extent to which it has met those duties, and what needs to be done to secure and maintain proper standards. Certainly if any legal notices are issued as a result of an inspection, or if legal proceedings are likely, then senior management must be aware of this state of affairs at the earliest possible stage.
Company Inspections
Company inspections are an important ingredient in maintaining sound standards of safety and health at work. They are appropriate to all enterprises and, in larger companies, may be an element in the management inspection procedure. For smaller companies, it is essential to adopt some form of regular company inspection. Reliance should not be placed on the inspection services provided by the inspectorates of the enforcing authorities. These are usually far too infrequent, and should serve largely as a stimulus to improve or maintain standards, rather than be the primary source for evaluating standards. Company inspections can be undertaken by consultants or by companies who specialize in this work, but the current discussion will concentrate on inspection by the enterprise’s own personnel.
How frequently should company inspections be made? To some degree the answer is dependent on the hazards associated with the work and the complexity of the plant. But even in low-risk premises there should be some form of inspection on a regular (monthly, quarterly, etc.) basis. If the company employs a safety professional, then clearly the organization and the conduct of the inspection must be an important part of this function. The inspection should usually be a team effort involving the safety professional, the departmental manager or foreman, and either a trade union representative or a qualified worker, such as a safety committee member. The inspection should be comprehensive; that is to say, a close examination should be made both of the safety software (for example, systems, procedures and work permits) and the hardware (for example, machinery guarding, fire-fighting equipment, exhaust ventilation and personal protective equipment). Particular attention should be paid to “near misses” - those incidents which do not result in damages or personal injury but which have the imminent potential for serious accidental injuries. There is an expectation that after an accident resulting in absence from work, the inspection team would immediately convene to investigate the circumstances, as a matter outside the normal cycle of inspection. But even during routine workshop inspection the team should also consider the extent of minor accidental injuries which have occurred in the department since the previous inspection.
It is important that company inspections should not seem to be consistently negative. Where faults exist it is important that they be identified and rectified, but it is equally important to commend the maintenance of good standards, to comment positively on tidiness and good housekeeping, and to reinforce by encouragement those who use personal protective equipment provided for their safety. To complete the inspection a formal written report should be made of the significant deficiencies found. Particular attention should be drawn to any shortcomings which have been identified in previous inspections but have not yet been corrected. Where there exists a works safety council, or a joint management-worker safety committee, the inspection report should be featured as a standing item on the council’s agenda. The report on the inspection must be sent to and discussed with the senior management of the enterprise, who should then determine whether action is required and, if so, authorize and support such action.
Even the smallest companies, where there is no safety professional, and where trade unions may not exist, should consider company inspections. Many inspectorates have produced very simple guidelines illustrating the basic concepts of safety and health, their application to a range of industries, and practical ways in which they can be applied in even the smallest enterprises. Many safety associations specifically target small businesses with publications (often free) which provide the basic information to establish safe and healthy working conditions. Armed with this sort of information and with the expenditure of very little time, the proprietor of a small business can establish reasonable standards, and can thus perhaps obviate the sort of accidents which can happen to the workforce in even the smallest business.
Hazard Analysis: Organizational Factors - mort
Through industrialization, workers became organized in factories as the utilization of energy sources such as the steam engine became possible. As compared to traditional handicraft, mechanized production, with sources of higher energy at its disposal, presented new risks of accidents. As the amount of energy increased, workers were removed from the direct control of these energies. Decisions that affected safety were often made at the management level rather than by those directly exposed to these risks. At this stage of industrialization, the need for safety management became evident.
In the late 1920s, Heinrich formulated the first comprehensive theoretical framework for safety management, which was that safety should be sought through management decisions based on identification and analysis of accident causes. At this point in the development of safety management, accidents were attributed to failures at the worker-machine system level - that is, to unsafe acts and unsafe conditions.
Subsequently, various methodologies were developed for the identification and assessment of accident risks. With MORT (Management Oversight and Risk Tree), the focus shifted to the higher orders of control of accident risks - that is, to the control of conditions at the management level. The initiative to develop MORT was taken in the late 1960s by the US Energy Research and Development Administration, which wanted to improve their safety programmes in order to reduce their losses due to accidents.
The MORT Diagram and Underlying Principles
The intent of MORT was to formulate an ideal safety management system based on a synthesis of the best safety programme elements and safety management techniques then available. As the principles underlying the MORT initiative were applied to the contemporary state of the art in safety management, the largely unstructured safety literature and expertise took on the form of an analytical tree. The first version of the tree was published in 1971. Figure 1 shows the basic elements of the version of the tree that was published by Johnson in 1980. The tree also appears in a modified form in later publications on the subject of the MORT concept (see, for example, Knox and Eicher 1992).
Figure 1. A version of the MORT analytical tree

The MORT Diagram
MORT is used as a practical tool in accident investigations and in evaluations of existing safety programmes. The top event of the tree in figure 1 (Johnson 1980) represents the losses (experienced or potential) due to an accident. Below this top event are three main branches: specific oversights and omissions (S), management oversights and omissions (M) and assumed risks (R). The R-branch consists of assumed risks, which are events and conditions that are known to management and that have been evaluated and accepted at the proper management level. Other events and conditions that are revealed through the evaluations following the S- and M-branches are denoted “less than adequate” (LTA).
The S-branch focuses on the events and conditions of the actual or potential occurrence. (In general, time is shown as one reads from left to right, and the sequence of causes is shown as one reads from bottom to top.) Haddon’s strategies (1980) for the prevention of accidents are key elements in this branch. An event is denoted an accident when a target (a person or object) is exposed to an uncontrolled transfer of energy and sustains damage. In the S-branch of MORT, accidents are prevented through barriers. There are three basic types of barriers: (1) barriers that surround and confine the energy source (the hazard), (2) barriers that protect the target and (3) barriers that separate the hazard and the target physically or in time or space. These different types of barriers are found in the development of the branches below the accidental event. Amelioration relates to the actions taken after the accident to limit the losses.
At the next level of the S-branch, factors are recognized which relate to the different phases of the life cycle of an industrial system. These are the project phase (design and plan), start up (operational readiness) and operation (supervision and maintenance).
The M-branch supports a process in which specific findings from an accident investigation or safety programme evaluation are made more general. Events and conditions of the S-branch thus often have their counterparts in the M-branch. When engaged with the system at the M-branch, the analyst’s thinking is expanded to the total management system. Thus, any recommendations will affect many other possible accident scenarios as well. The most important safety management functions can be found in the M-branch: the setting of policy, implementation and follow-up. These are the same basic elements that we find in the quality assurance principles of the ISO 9000 series published by the International Organization for Standardization (ISO).
When the branches of the MORT diagram are elaborated in detail, there are elements from such different fields as risk analysis, human factors analysis, safety information systems and organizational analysis. In total, about 1,500 basic events are covered by the MORT diagram.
Application of the MORT Diagram
As indicated, the MORT diagram has two immediate uses (Knox and Eicher 1992): (1) to analyse management and organizational factors relative to an accident that has happened and (2) to evaluate or audit a safety programme in relation to a significant accident that has the potential of occurring. The MORT diagram functions as a screening tool in planning the analyses and evaluations. It is also used as a checklist for comparison of actual conditions with the idealized system. In this application, MORT facilitates checking the completeness of the analysis and avoiding personal biases.
At bottom, MORT is made up of a collection of questions. Criteria that guide judgements as to whether specific events and conditions are satisfactory or less than adequate are derived from these questions. In spite of the directive design of the questions, the judgements made by the analyst are partly subjective. It has thus become important to ensure an adequate quality and degree of intersubjectivity among MORT analyses made by different analysts. For example, in the United States, a training programme is available for certification of MORT analysts.
Experiences with MORT
The literature on evaluations of MORT is sparse. Johnson reports significant improvements in the comprehensiveness of accident investigations after the introduction of MORT (Johnson 1980). Deficiencies at the supervisory and management levels were revealed more systematically. Experience has also been gained from evaluations of MORT applications within Finnish industry (Ruuhilehto 1993). Some limitations have been identified in the Finnish studies. MORT does not support the identification of immediate risks due to failures and disturbances. Furthermore, no capability for setting priorities is built into the MORT concept. Consequently, the results of MORT analyses need further evaluation to translate them into remedial actions. Finally, experience shows that MORT is time-consuming and requires expert participation.
Aside from its ability to focus on organizational and management factors, MORT has the further advantage of connecting safety with normal production activities and general management. The application of MORT will thus support general planning and control, and help reduce the frequency of production disturbances as well.
Associated Safety Management Methods and Techniques
With the introduction of the MORT concept in the early 1970s, a development programme started in the United States. The focal point for this programme has been the System Safety Development Center in Idaho Falls. Different MORT-associated methods and techniques in such areas as human factors analysis, safety information systems and safety analysis have resulted from this programme. An early example of a method arising from the MORT development programme is the Operational Readiness Program (Nertney 1975). This programme is introduced during the development of new industrial systems and modifications of existing ones. The aim is to ensure that, from the safety management point of view, the new or modified system is ready at the time of start-up. A condition of operational readiness presupposes that the necessary barriers and controls have been installed in the new system’s hardware, personnel and procedures. Another example of a MORT programme element is the MORT-based root cause analysis (Cornelison 1989). It is used to identify the basic safety management problems of an organization. This is done by relating the specific findings of the MORT analyses to 27 different generic safety management problems.
Although MORT is not intended for use directly in the collection of information during accident investigations and safety audits, in Scandinavia, the MORT questions have served as a basis for the development of a diagnostic tool used for this purpose. It is called the Safety Management and Organization Review Technique, or SMORT (Kjellén and Tinmannsvik 1989). A SMORT analysis advances backwards in steps, starting from the specific situation and ending at the general management level. The starting point (level 1) is an accident sequence or a risk situation. At level 2, the organization, system planning and technical factors related to daily operation are scrutinized. The subsequent levels include design of new systems (level 3) and higher management functions (level 4). Findings on one level are extended to the levels above. For example, results related to the accident sequence and to daily operations are used in the analysis of the company’s organization and routines for project work (level 3). Results at level 3 will not affect safety in existing operations but may be applied to the planning of new systems and modifications. SMORT also differs from MORT in the way findings are identified. At level 1, these are observable events and conditions that deviate from generally accepted norms. When organizational and management factors are brought into the analysis at levels 2 to 4, the findings are identified through value judgements made by an analysis group and verified through a quality control procedure. The aim is to ensure a mutually shared understanding of the organizational problems.
Summary
MORT has been instrumental in developments within safety management since the 1970s. It is possible to track the influence of MORT to such areas as safety research literature, literature on safety management and audit tools, and legislation on self-regulation and internal control. In spite of this impact, its limitations must be carefully considered. MORT and associated methods are normative in the sense that they prescribe how safety management programmes should be organized and executed. The ideal is a well-structured organization with clear and realistic goals and well-defined lines of responsibility and authority. MORT is thus best suited for large and bureaucratic organizations.
Hardware Hazards
This article addresses “machine” hazards, those which are specific to the appurtenances and hardware used in the industrial processes associated with pressure vessels, processing equipment, powerful machines and other intrinsically risky operations. This article does not address worker hazards, which implicate the actions and behaviour of individuals, such as slipping on working surfaces, falling from elevations and hazards from using ordinary tools. This article focuses on machine hazards, which are characteristic of an industrial job environment. Since these hazards threaten anyone present and may even be a threat to neighbours and the external environment, the analysis methods and the means for prevention and control are similar to the methods used to deal with risks to the environment from industrial activities.
Machine Hazards
Good quality hardware is very reliable, and most failures are caused by secondary effects like fire, corrosion, misuse and so on. Nevertheless, hardware may be highlighted in certain accidents, because a failing hardware component is often the most conspicuous or visibly prominent link of the chain of events. Although the term hardware is used in a broad sense, illustrative examples of hardware failures and their immediate “surroundings” in accident causation have been taken from industrial workplaces. Typical candidates for investigation of “machine” hazards include but are not limited to the following:
- pressure vessels and pipes
- motors, engines, turbines and other rotating machines
- chemical and nuclear reactors
- scaffolding, bridges, etc.
- lasers and other energy radiators
- cutting and drilling machinery, etc.
- welding equipment.
Effects of Energy
Hardware hazards can include wrong use, construction errors or frequent overload, and accordingly their analysis and mitigation or prevention can follow rather different directions. However, physical and chemical energy forms that elude human control often exist at the heart of hardware hazards. Therefore, one very general method to identify hardware hazards is to look for the energies that are normally controlled with the actual piece of equipment or machinery, such as a pressure vessel containing ammonia or chlorine. Other methods use the purpose or intended function of the actual hardware as a starting point and then look for the probable effects of malfunctions and failures. For example, a bridge failing to fulfil its primary function will expose subjects on the bridge to the risk of falling down; other effects of the collapse of a bridge will be the secondary ones of falling items, either structural parts of the bridge or objects situated on the bridge. Further down the chain of consequences, there may be derived effects related to functions in other parts of the system that were dependent on the bridge performing its function properly, such as the interruption of emergency response vehicular traffic to another incident.
Besides the concepts of “controlled energy” and “intended function”, dangerous substances must be addressed by asking questions such as, “How could agent X be released from vessels, tanks or pipe systems and how could agent Y be produced?” (either or both may be hazardous). Agent X might be a pressurized gas or a solvent, and agent Y might be an extremely toxic dioxin whose formation is favoured by the “right” temperatures in some chemical processes, or it could be produced by rapid oxidation, as the result of a fire. However, the possible hazards add up to much more than just the risks of dangerous substances. Conditions or influences might exist which allow the presence of a particular item of hardware to lead to harmful consequences to humans.
Industrial Work Environment
Machine hazards also involve load or stress factors that may be dangerous in the long run, such as the following:
- extreme working temperatures
- high intensities of light, noise or other stimuli
- inferior air quality
- extreme job demands or workloads.
These hazards can be recognized and precautions taken because the dangerous conditions are already there. They do not depend on some structural change in the hardware to come about and work a harmful result, or on some special event to effect damage or injury. Long-term hazards also have specific sources in the working environment, but they must be identified and evaluated through observing workers and the jobs, instead of just analysing hardware construction and functions.
Dangerous hardware or machine hazards are usually exceptional and rather seldom found in a sound working environment, but cannot be avoided completely. Several types of uncontrolled energy, such as the following risk agents, can be the immediate consequence of hardware malfunction:
- harmful releases of dangerous gas, liquids, dusts or other substances
- fire and explosion
- high voltages
- falling objects, missiles, etc.
- electric and magnetic fields
- cutting, trapping, etc.
- displacement of oxygen
- nuclear radiation, x rays and laser light
- flooding or drowning
- jets of hot liquid or steam.
Risk Agents
Moving objects. Falling and flying objects, liquid flows and jets of liquid or steam, such as listed, are often the first external consequences of hardware or equipment failure, and they account for a large proportion of accidents.
Chemical substances. Chemical hazards also contribute to worker accidents as well as affecting the environment and the public. The Seveso and Bhopal accidents involved chemical releases which affected numerous members of the public, and many industrial fires and explosions release chemicals and fumes to the atmosphere. Traffic accidents involving gasoline or chemical delivery trucks or other dangerous goods transports, unite two risk agents - moving objects and chemical substances.
Electromagnetic energy. Electric and magnetic fields, x rays and gamma rays are all manifestations of electromagnetism, but are often treated separately as they are encountered under rather different circumstances. However, the dangers of electromagnetism have some general traits: fields and radiation penetrate human bodies instead of just making contact on the application area, and they cannot be sensed directly, although very large intensities cause heating of the affected body parts. Magnetic fields are created by the flow of electric current, and intense magnetic fields are to be found in the vicinity of large electric motors, electric arc welding equipment, electrolysis apparatus, metal works and so forth. Electric fields accompany electric tension, and even the ordinary mains voltages of 200 to 300 volts cause the accumulation of dirt over several years, the visible sign of the field’s existence, an effect also known in connection with high-tension electrical lines, TV picture tubes, computer monitors and so on.
Electromagnetic fields are mostly found rather close to their sources, but electromagnetic radiation is a long-distance traveller, as radar and radio waves exemplify. Electromagnetic radiation is scattered, reflected and damped as it passes through space and meets intervening objects, surfaces, different substances and atmospheres, and the like; its intensity is therefore reduced in several ways.
The general character of the electromagnetic (EM) hazard sources are:
- Instruments are needed to detect the presence of EM fields or EM radiation.
- EM does not leave primary traces in the form of “contamination”.
- Dangerous effects are usually delayed or long-term, but immediate burns are caused in severe cases.
- X rays and gamma rays are damped, but not stopped, by lead and other heavy elements.
- Magnetic fields and x rays are stopped immediately when the source is de-energized or the equipment turned off.
- Electric fields can survive for long periods after turning the generating systems off.
- Gamma rays come from nuclear processes, and these radiation sources cannot be turned off as can many EM sources.
Nuclear radiation. The hazards associated with nuclear radiation are of special concern to workers in nuclear power plants and in plants working with nuclear materials such as fuel manufacturing and the reprocessing, transport and storage of radioactive matter. Nuclear radiation sources are also used in medicine and by some industries for measurement and control. One most common usage is in fire alarms/smoke detectors, which use an alpha-particle emitter like americium to monitor the atmosphere.
Nuclear hazards are principally centred around five factors:
- gamma rays
- neutrons
- beta particles (electrons)
- alpha particles (helium nuclei)
- contamination.
The hazards arise from the radioactive processes in nuclear fission and the decaying of radioactive materials. This sort of radiation is emitted from reactor processes, reactor fuel, reactor moderator material, from the gaseous fission products that may be developed, and from certain construction materials that become activated by exposure to radioactive emissions arising from reactor operation.
Other risk agents. Other classes of risk agents that release or emit energy include:
- UV radiance and laser light
- infrasound
- high-intensity sound
- vibration.
Triggering the Hardware Hazards
Both sudden and gradual shifts from the controlled - or “safe” - condition to one with increased danger can come about through the following circumstances, which can be controlled through appropriate organizational means such as user experience, education, skills, surveillance and equipment testing:
- wear and overloads
- external impact (fire or impact)
- ageing and failure
- wrong supply (energy, raw materials)
- insufficient maintenance and repair
- control or process error
- misuse or misapplication
- hardware breakdown
- barrier malfunction.
Since proper operations cannot reliably compensate for improper design and installation, it is important to consider the entire process, from selection and design through installation, use, maintenance and testing, in order to evaluate the actual state and conditions of the hardware item.
Hazard Case: The Pressurized Gas Tank
Gas can be contained in suitable vessels for storage or transport, like the gas and oxygen cylinders used by welders. Often, gas is handled at high pressure, affording a great increase in the storing capacity, but with higher accident risk. The key accidental phenomenon in pressurized gas storage is the sudden creation of a hole in the tank, with these results:
- the confinement function of the tank ceases
- the confined gas gets immediate access to the surrounding atmosphere.
The development of such an accident depends on these factors:
- the type and amount of gas in the tank
- the situation of the hole in relation to the tank’s contents
- the initial size and subsequent growth rate of the hole
- the temperature and pressure of the gas and the equipment
- the conditions in the immediate environment (sources of ignition, people, etc.).
The tank contents can be released almost immediately or over a period of time, and result in different scenarios, from the burst of free gas from a ruptured tank, to moderate and rather slow releases from small punctures.
The behaviour of various gases in the case of leakage
When developing release calculation models, it is most important to determine the following conditions affecting the system’s potential behaviour:
- the gas phase behind the hole (gaseous or liquid?)
- temperature and wind conditions
- the possible entry of other substances into the system or their possible presence in its surroundings
- barriers and other obstacles.
The exact calculations pertaining to a release process where liquefied gas escapes from a hole as a jet and then evaporates (or alternatively, first becomes a mist of droplets) are difficult. The specification of the later dispersion of the resultant clouds is also a difficult problem. Consideration must be given to the movements and dispersion of gas releases, whether the gas forms visible or invisible clouds and whether the gas rises or stays at ground level.
While hydrogen is a light gas compared to any atmosphere, ammonia gas (NH3, with a molecular weight of 17.0) will rise in an ordinary air-like, oxygen-nitrogen atmosphere at the same temperature and pressure. Chlorine (Cl2, with a molecular weight of 70.9) and butane (C4H10, mol. wt.58) are examples of chemicals whose gas phases are denser than air, even at ambient temperature. Acetylene (C2H2, mol. wt. 26.0) has a density of about 0.90g/l, approaching that of air (1.0g/l), which means that in a working environment, leaking welding gas will not have a pronounced tendency to float upwards or to sink downwards; therefore it can mix easily with the atmosphere.
But ammonia released from a pressure vessel as a liquid will at first cool as a consequence of its evaporation, and may then escape via several steps:
- Pressurized, liquid ammonia emanates from the hole in tank as jet or cloud.
- Seas of liquid ammonia can be formed on the nearest surfaces.
- The ammonia evaporates, thereby cooling itself and the near environment.
- Ammonia gas gradually exchanges heat with surroundings and equilibrates with ambient temperatures.
Even a cloud of light gas may not rise immediately from a liquid gas release; it may first form a fog - a cloud of droplets - and stay near the ground. The gas cloud’s movement and gradual mixing/dilution with the surrounding atmosphere depends on weather parameters and on the surrounding environment—enclosed area, open area, houses, traffic, presence of the public, workers and so on.
Tank Failure
Consequences of tank breakdown may involve fire and explosion, asphyxiation, poisoning and choking, as experience shows with gas production and gas handling systems (propane, methane, nitrogen, hydrogen, etc.), with ammonia or chlorine tanks, and with gas welding (using acetylene and oxygen). What actually initiates the formation of a hole in a tank has a strong influence on the hole “behaviour” - which in its turn influences the outflow of gas - and is crucial for the effectiveness of prevention efforts. A pressure vessel is designed and built to withstand certain conditions of use and environmental impact, and for handling a certain gas, or perhaps a choice of gases. The actual capabilities of a tank depend on its shape, materials, welding, protection, use and climate; therefore, evaluation of its adequacy as a container for dangerous gas must consider designer’s specifications, the tank’s history, inspections and tests. Critical areas include the welding seams used on most pressure vessels; the points where appurtenances such as inlets, outlets, supports and instruments are connected to the vessel; the flat ends of cylindrical tanks like railway tanks; and other aspects of even less optimal geometric shapes.
Welding seams are investigated visually, by x rays or by destructive test of samples, as these may reveal local defects, say, in the form of reduced strength that might endanger the overall strength of the vessel, or even be a triggering point for acute tank failure.
Tank strength is affected by the history of tank use - first of all by the normal wearing processes and the scratches and corrosion attacks typical of the particular industry and of the application. Other historical parameters of particular interest include:
- casual overpressure
- extreme heating or cooling (internal or external)
- mechanical impacts
- vibrations and stress
- substances that have been stored in or have passed through the tank
- substances used during cleansing, maintenance and repair.
The construction material - steel plate, aluminium plate, concrete for non-pressurized applications, and so on - can undergo deterioration from these influences in ways that are not always possible to check without overloading or destroying the equipment during testing.
Accident Case: Flixborough
The explosion of a large cloud of cyclohexane in Flixborough (UK) in 1974, which killed 28 persons and caused extensive plant damage, serves as a very instructive case. The triggering event was the breakdown of a temporary pipe serving as a substitute in a reactor unit. The accident was “caused” by a piece of hardware breaking down, but on closer investigation it was revealed that the breakdown followed from overload, and that the temporary construction was in fact inadequate for its intended use. After two months’ service, the pipe was exposed to bending forces due to a slight pressure rise of the 10-bar (106 Pa) cyclohexane content at about 150°C. The two bellows between the pipe and the nearby reactors broke and 30 to 50 tonnes of cyclohexane was released and soon ignited, probably by a furnace some distance from the leak. (See figure 1.) A very readable account of the case is found in Kletz (1988).
Figure 1. Temporary connection between tanks at Flixborough

Hazard Analysis
The methods that have been developed to find the risks that may be relevant to a piece of equipment, to a chemical process or to a certain operation are referred to as “hazard analysis”. These methods ask questions such as: “What may possibly go wrong?” “Could it be serious?” and “What can be done about it?” Different methods of conducting the analyses are often combined to achieve a reasonable coverage, but no such set can do more than guide or assist a clever team of analysts in their determinations. The main difficulties with hazard analysis are as follows:
- availability of relevant data
- limitations of models and calculations
- new and unfamiliar materials, constructions and processes
- system complexity
- limitations on human imagination
- limitations on practical tests.
To produce usable risk evaluations under these circumstances it is important to stringently define the scope and the level of “ambitiousness” appropriate to the analysis at hand; for example, it is clear that one does not need the same sort of information for insurance purposes as for design purposes, or for the planning of protection schemes and the construction of emergency arrangements. Generally speaking, the risk picture must be filled in by mixing empirical techniques (i.e., statistics) with deductive reasoning and a creative imagination.
Different risk evaluation tools - even computer programs for risk analysis—can be very helpful. The hazard and operability study (HAZOP) and the failure mode and effect analysis (FMEA ) are commonly used methods for investigating hazards, especially in the chemical industry. The point of departure for the HAZOP method is the tracing of possible risk scenarios based on a set of guide words; for each scenario one has to identify probable causes and consequences. In the second stage, one tries to find means for reducing the probabilities or mitigating the consequences of those scenarios judged to be unacceptable. A review of the HAZOP method can be found in Charsley (1995). The FMEA method asks a series of “what if” questions for every possible risk component in order to thoroughly determine whatever failure modes may exist and then to identify the effects that they may have on system performance; such an analysis will be illustrated in the demonstration example (for a gas system) presented later in this article.
Fault trees and event trees and the modes of logical analysis proper to accident causation structures and probability reasoning are in no way specific to the analysis of hardware hazards, as they are general tools for system risk evaluations.
Tracing hardware hazards in an industrial plant
To identify possible hazards, information on construction and function can be sought from:
- actual equipment and plant
- substitutes and models
- drawings, electrical diagrams, piping and instrumentation (P/I) diagrams, etc.
- process descriptions
- control schemes
- operation modes and phases
- work orders, change orders, maintenance reports, etc.
By selecting and digesting such information, analysts form a picture of the risk object itself, its functions and its actual use. Where things are not yet constructed - or unavailable for inspection - important observations cannot be made and the evaluation must be based entirely on descriptions, intentions and plans. Such evaluation might seem rather poor, but in fact, most practical risk evaluations are made this way, either in order to seek authoritative approval for applications to undertake new construction, or to compare the relative safety of alternative design solutions. Real life processes will be consulted for the information not shown on the formal diagrams or described verbally by interview, and to verify that the information gathered from these sources is factual and represents actual conditions. These include the following:
- actual practice and culture
- additional failure mechanisms/construction details
- “sneak paths” (see below)
- common error causes
- risks from external sources/missiles
- particular exposures or consequences
- past incidents, accidents and near accidents.
Most of this additional information, especially sneak paths, is detectable only by creative, skilled observers with considerable experience, and some of the information would be almost impossible to trace with maps and diagrams. Sneak paths denote unintended and unforeseen interactions between systems, where the operation of one system affects the condition or operation of another system through other ways than the functional ones. This typically happens where functionally different parts are situated near each other, or (for example) a leaking substance drips on equipment beneath and causes a failure. Another mode of a sneak path’s action may involve the introduction of wrong substances or parts into a system by means of instruments or tools during operation or maintenance: the intended structures and their intended functions are changed through the sneak paths. By common-mode failures one means that certain conditions - like flooding, lightning or power failure - can disturb several systems at once, perhaps leading to unexpectedly large blackouts or accidents. Generally, one tries to avoid sneak-path effects and common-mode failures through proper layouts and introducing distance, insulation and diversity in working operations.
A Hazards Analysis Case: Gas Delivery from a Ship to a Tank
Figure 2 shows a system for delivery of gas from a transport ship to a storage tank. A leak could appear anywhere in this system: ship, transmission line, tank or output line; given the two tank reservoirs, a leak somewhere on the line could remain active for hours.
Figure 2. Transmission line for delivery of liquid gas from ship to storage tank
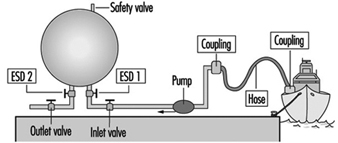
The most critical components of the system are the following:
- the storage tank
- the pipeline or hose between the tank and the ship
- other hoses, lines, valves and connections
- the safety valve on the storage tank
- the emergency shut-down valves ESD 1 and 2.
A storage tank with a large inventory of liquid gas is put at the top of this list, because it is difficult to stop a leak from a tank on short notice. The second item on the list - the connection to the ship - is critical because leaks in the pipe or hose and loose connections or couplings with worn gaskets, and variations among different ships, could release product. Flexible parts like hoses and bellows are more critical than rigid parts, and require regular maintenance and inspection. Safety devices like the pressure release valve on the top of the tank and the two emergency shut-down valves are critical, since they must be relied upon to reveal latent or developing failures.
Up to this point, the ranking of system components as to their importance with respect to reliability has been of a general nature only. Now, for analytical purposes, attention will be drawn to the particular functions of the system, the chief one of course being the movement of liquefied gas from the ship to the storage tank until the connected ship tank is empty. The overriding hazard is a gas leak, the possible contributory mechanisms being one of more of the following:
- leaking couplings or valves
- tank rupture
- rupture of pipe or hose
- tank breakdown.
Application of the FMEA method
The central idea of the FMEA approach, or “what if” analysis, is to record explicitly, for each component of the system, its failure modes, and for every failure to find the possible consequences to the system and to the environment. For standard components like a tank, pipe, valve, pump, flowmeter and so on, the failure modes follow general patterns. In the case of a valve, for instance, failure modes could include the following conditions:
- The valve cannot close on demand (there is reduced flow through an “open” valve).
- The valve leaks (there is residual flow through a “closed” valve).
- The valve cannot open on demand (the valve position oscillates).
For a pipeline, failure modes would consider items such as:
- a reduced flow
- a leak
- a flow stopped due to blockage
- a break in the line.
The effects of leaks seem obvious, but sometimes the most important effects may not be the first effects: what happens for example, if a valve is stuck in a half-open position? An on-off valve in the delivery line that does not open completely on demand will delay the tank filling process, a non-dangerous consequence. But if the “stuck half-open” condition arises at the same time that a closing demand is made, at a time when the tank is almost full, overfilling might result (unless the emergency shut-down valve is successfully activated). In a properly designed and operated system, the probability of both these valves being stuck simultaneously will be kept rather low.
Plainly a safety valve’s not operating on demand could mean disaster; in fact, one might justifiably state that latent failures are constantly threatening all safety devices. Pressure relief valves, for instance, can be defective due to corrosion, dirt or paint (typically due to bad maintenance), and in the case of liquid gas, such defects in combination with the temperature decrease at a gas leak could produce ice and thereby reduce or perhaps stop the flow of material through a safety valve. If a pressure relief valve does not operate on demand, pressure may build up in a tank or in connected systems of tanks, eventually causing other leaks or tank rupture.
For simplicity, instruments are not shown on figure 2; there will of course be instruments related to pressure, flow and temperature, which are essential parameters for monitoring the system state, relevant signals being transmitted to operator consoles or to a control room for control and monitoring purposes. Furthermore, there will be supply lines other than those intended for materials transport - for electricity, hydraulics and so forth - and extra safety devices. A comprehensive analysis must go through these systems as well and look for the failure modes and effects of these components also. In particular, the detective work on common-mode effects and sneak paths requires one to construct the integral picture of main system components, controls, instruments, supplies, operators, working schedules, maintenance and so on.
Examples of common-mode effects to consider in connection with gas systems are addressed by such questions as these:
- Are activation signals for delivery valves and emergency shut-down valves transmitted on a common line (cable, cabling channels)?
- Do two given valves share the same power line?
- Is maintenance performed by the same person according to a given schedule?
Even an excellently designed system with redundancy and independent power lines can suffer from inferior maintenance, where, for example, a valve and its back-up valve (the emergency shut-down valve in our case) have been left in a wrong state after a test. A prominent common-mode effect with an ammonia-handling system is the leak situation itself: a moderate leak can make all manual operations on plant components rather awkward - and delayed - due to the deployment of the required emergency protection.
Summary
The hardware components are very seldom the guilty parts in accident development; rather, there are root causes to be found in other links of the chain: wrong concepts, bad designs, maintenance errors, operator errors, management errors and so on. Several examples of the specific conditions and acts that may lead to failure development have already been given; a broad collection of such agents would take account of the following:
- collision
- corrosion, etching
- excessive loads
- failing support and aged or worn-out parts
- low-quality welding jobs
- missiles
- missing parts
- overheating or chilling
- vibration
- wrong construction material used.
Controlling the hardware hazards in a working environment requires the review of all possible causes and respect for the conditions that are found to be critical with the actual systems. The implications of this for the organization of risk management programmes are dealt with in other articles, but, as the foregoing list clearly indicates, the monitoring and control of hardware conditions can be necessary all the way back to the choice of concepts and designs for the selected systems and processes.
Hazard Analysis: The Accident Causation Model
This article examines the role of human factors in the accident causation process and reviews the various preventive measures (and their effectiveness) by which human error may be controlled, and their application to the accident causation model. Human error is an important contributing cause in at least 90 of all industrial accidents. While purely technical errors and uncontrollable physical circumstances may also contribute to accident causation, human error is the paramount source of failure. The increased sophistication and reliability of machinery means that the proportion of causes of accidents attributed to human error increases as the absolute number of accidents decreases. Human error is also the cause of many of those incidents that, although not resulting in injury or death, nevertheless result in considerable economic damage to a company. As such, it represents a major target for prevention, and it will become increasingly important. For effective safety management systems and risk identification programmes it is important to be able to identify the human component effectively through the use of general failure type analysis.
The Nature of Human Error
Human error can be viewed as the failure to reach a goal in the way that was planned, either from a local or wider perspective, due to unintentional or intentional behaviour. Those planned actions may fail to achieve the desired outcomes for the following four reasons:
1. Unintentional behaviour:
- The actions did not go as planned (slips).
- The action was not executed (lapses).
2. Intentional behaviour:
- The plan itself was inadequate (mistakes).
- There were deviations from the original plan (violations).
Deviations can be divided in three classes: skill-, rule- and knowledge-based errors.
- At the skill-based level, behaviour is guided by pre-programmed action schemes. The tasks are routine and continuous, and feedback is usually lacking.
- At the rule-based level, behaviour is guided by general rules. They are simple and can be applied many times in specific situations. The tasks consist of relatively frequent action sequences that start after a choice is made among rules or procedures. The user has a choice: the rules are not automatically activated, but are actively chosen.
- Knowledge-based behaviour is shown in completely new situations where no rules are available and where creative and analytical thinking is required.
In some situations, the term human limitation would be more appropriate than human error. There also are limits to the ability to foresee the future behaviour of complex systems (Gleick 1987; Casti 1990).
Reason and Embrey’s model, the Generic Error Modelling System (GEMS) (Reason 1990), takes into account the error-correcting mechanisms on the skill-, rule- and knowledge-based levels. A basic assumption of GEMS is that day-to-day behaviour implies routine behaviour. Routine behaviour is checked regularly, but between these feedback loops, behaviour is completely automatic. Since the behaviour is skill-based, the errors are slips. When the feedback shows a deviation from the desired goal, rule-based correction is applied. The problem is diagnosed on the basis of available symptoms, and a correction rule is automatically applied when the situation is diagnosed. When the wrong rule is applied there is a mistake.
When the situation is completely unknown, knowledge-based rules are applied. The symptoms are examined in the light of knowledge about the system and its components. This analysis can lead to a possible solution the implementation of which constitutes a case of knowledge-based behaviour. (It is also possible that the problem cannot be solved in a given way and that further knowledge-based rules have to be applied.) All errors on this level are mistakes. Violations are committed when a certain rule is applied that is known to be inappropriate: the thinking of the worker may be that application of an alternative rule will be less time-consuming or is possibly more suitable for the present, probably exceptional, situation. The more malevolent class of violations involves sabotage, a subject that is not within the scope of this article. When organizations are attempting to eliminate human error, they should take into account whether the errors are on the skill-, rule- or knowledge-based level, as each level requires its own techniques (Groeneweg 1996).
Influencing Human Behaviour: An Overview
A comment often made with regard to a particular accident is, “Maybe the person did not realize it at the time, but if he or she had not acted in a certain way, the accident would not have happened.” Much of accident prevention is aimed at influencing the crucial bit of human behaviour alluded to in this remark. In many safety management systems, the solutions and policies suggested are aimed at directly influencing human behaviour. However, it is very uncommon that organizations assess how effective such methods really are. Psychologists have devoted much thought to how human behaviour can best be influenced. In this respect, the following six ways of exercising control over human error will be set forth, and an evaluation will be performed of the relative effectiveness of these methods in controlling human behaviour on a long-term basis (Wagenaar 1992). (See table 1.)
Table 1. Six ways to induce safe behaviour and assessment of their cost-effectiveness
|
No. |
Way of influencing |
Cost |
Long-term effect |
Assessment |
|
1 |
Don’t induce safe behaviour, |
High |
Low |
Poor |
|
2 |
Tell those involved what to do. |
Low |
Low |
Medium |
|
3 |
Reward and punish. |
Medium |
Medium |
Medium |
|
4 |
Increase motivation and awareness. |
Medium |
Low |
Poor |
|
5 |
Select trained personnel. |
High |
Medium |
Medium |
|
6 |
Change the environment. |
High |
High |
Good |
Do not attempt to induce safe behaviour, but make the system “foolproof”
The first option is to do nothing to influence the behaviour of people but to design the workplace in such a way that whatever the employee does, it will not result in any kind of undesirable outcome. It must be acknowledged that, thanks to the influence of robotics and ergonomics, designers have considerably improved on the user-friendliness of workplace equipment. However, it is almost impossible to anticipate all the different kinds of behaviour that people may evince. Besides, workers often regard so-called foolproof designs as a challenge to “beat the system”. Finally, as designers are human themselves, even very carefully foolproof-designed equipment can have flaws (e.g., Petroski 1992). The additional benefit of this approach relative to existing hazard levels is marginal, and in any event initial design and installation costs may increase exponentially.
Tell those involved what to do
Another option is to instruct all workers about every single activity in order to bring their behaviour fully under the control of management. This will require an extensive and not very practical task inventory and instruction control system. As all behaviour is de-automated it will to a large extent eliminate slips and lapses until the instructions become part of the routine and the effect fades away.
It does not help very much to tell people that what they do is dangerous - most people know that very well - because they will make their own choices concerning risk regardless of attempts to persuade them otherwise. Their motivation to do so will be to make their work easier, to save time, to challenge authority and perhaps to enhance their own career prospects or claim some financial reward. Instructing people is relatively cheap, and most organizations have instruction sessions before the start of a job. But beyond such an instruction system the effectiveness of this approach is assessed to be low.
Reward and punish
Although reward and punishment schedules are powerful and very popular means for controlling human behaviour, they are not without problems. Reward works best only if the recipient perceives the reward to be of value at the time of receipt. Punishing behaviour that is beyond an employee’s control (a slip) will not be effective. For example, it is more cost-effective to improve traffic safety by changing the conditions underlying traffic behaviour than by public campaigns or punishment and reward programmes. Even an increase in the chances of being “caught” will not necessarily change a person’s behaviour, as the opportunities for violating a rule are still there, as is the challenge of successful violation. If the situations in which people work invite this kind of violation, people will automatically choose the undesired behaviour no matter how they are punished or rewarded. The effectiveness of this approach is rated as of medium quality, as it usually is of short-term effectiveness.
Increase motivation and awareness
Sometimes it is believed that people cause accidents because they lack motivation or are unaware of danger. This assumption is false, as studies have shown (e.g., Wagenaar and Groeneweg 1987). Furthermore, even if workers are capable of judging danger accurately, they do not necessarily act accordingly (Kruysse 1993). Accidents happen even to people with the best motivation and the highest degree of safety awareness. There are effective methods for improving motivation and awareness which are discussed below under “Change the environment”. This option is a delicate one: in contrast with the difficulty to further motivate people it is almost too easy to de-motivate employees to the extent that even sabotage is considered.
The effects of motivation enhancement programmes are positive only when coupled with behaviour modification techniques such as employee involvement.
Select trained personnel
The first reaction to an accident is often that those involved must have been incompetent. With hindsight, the accident scenarios appear straightforward and easily preventable to someone sufficiently intelligent and properly trained, but this appearance is a deceptive one: in actual fact the employees involved could not possibly have foreseen the accident. Therefore, better training and selection will not have the desirable effect. A base level of training is however a prerequisite for safe operations. The tendency in some industries to replace experienced personnel with inexperienced and inadequately trained people is to be discouraged, as increasingly complex situations call for rule- and knowledge-based thinking that requires a level of experience that such lower-cost personnel often do not possess.
A negative side-effect of instructing people very well and selecting only the highest-classified people is that behaviour can become automatic and slips occur. Selection is expensive, while the effect is not more than medium.
Change the environment
Most behaviour occurs as a reaction to factors in the working environment: work schedules, plans, and management expectations and demands. A change in the environment results in different behaviour. Before the working environment can be effectively changed, several problems must be solved. First, the environmental factors that cause the unwanted behaviour must be identified. Second, these factors must be controlled. Third, management must allow discussion about their role in creating the adverse working environment.
It is more practical to influence behaviour through creating the proper working environment. The problems that should be solved before this solution can be put into practice are (1) that it must be known which environmental factors cause the unwanted behaviour, (2) that these factors must be controlled and (3) that previous management decisions must be considered (Wagenaar 1992; Groeneweg 1996). All these conditions can indeed be met, as will be argued in the remainder of this article. The effectiveness of behaviour modification can be high, even though a change of environment may be quite costly.
The Accident Causation Model
In order to get more insight into the controllable parts of the accident causation process, an understanding of the possible feedback loops in a safety information system is necessary. In figure 1, the complete structure of a safety information system is presented that can form the basis of managerial control of human error. It is an adapted version of the system presented by Reason et al. (1989).
Figure 1. A safety information system
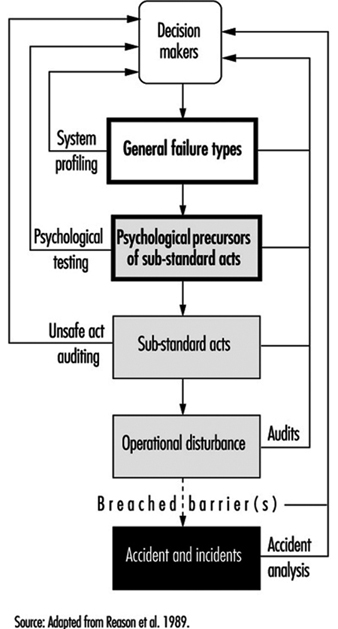
Accident investigation
When accidents are investigated, substantial reports are produced and decision-makers receive information about the human error component of the accident. Fortunately, this is becoming more and more obsolete in many companies. It is more effective to analyse the “operational disturbances” that precede the accidents and incidents. If an accident is described as an operational disturbance followed by its consequences, then sliding from the road is an operational disturbance and getting killed because the driver did not wear a safety belt is an accident. Barriers may have been placed between the operational disturbance and the accident, but they failed or were breached or circumvented.
Unsafe act auditing
A wrong act committed by an employee is called a “substandard act” and not an “unsafe act” in this article: the notion of “unsafe” seems to limit the applicability of the term to safety, whereas it can also be applied, for example, to environmental problems. Substandard acts are sometimes recorded, but detailed information as to which slips, mistakes and violations were performed and why they were performed is hardly ever fed back to higher management levels.
Investigating the employee’s state of mind
Before a substandard act is committed, the person involved was in a certain state of mind. If these psychological precursors, like being in a state of haste or feeling sad, could be adequately controlled, people would not find themselves in a state of mind in which they would commit a substandard act. Since these states of mind cannot be effectively controlled, such precursors are regarded as “black box” material (figure 1).
General failure types
The GFT (general failure type) box in figure 1 represents the generating mechanisms of an accident - the causes of substandard acts and situations. Because these substandard acts cannot be controlled directly, it is necessary to change the working environment. The working environment is determined by 11 such mechanisms (table 2). (In the Netherlands the abbreviation GFT already exists in a completely different context, and has to do with ecologically sound waste disposal, and to avoid confusion another term is used: basic risk factors (BRFs) (Roggeveen 1994).)
Table 2. General failure types and their definitions
|
General failures |
Definitions |
|
1. Design (DE) |
Failures due to poor design of a whole plant as well as individual |
|
2. Hardware (HW) |
Failures due to poor state or unavailability of equipment and tools |
|
3. Procedures (PR) |
Failures due to poor quality of the operating procedures with |
|
4. Error enforcing |
Failures due to poor quality of the working environment, with |
|
5. Housekeeping (HK) |
Failures due to poor housekeeping |
|
6. Training (TR) |
Failures due to inadequate training or insufficient experience |
|
7. Incompatible goals(IG) |
Failures due to the poor way safety and internal welfare are |
|
8. Communication (CO) |
Failures due to poor quality or absence of lines of communication |
|
9. Organization (OR) |
Failures due to the way the project is managed |
|
10. Maintenance |
Failures due to poor quality of the maintenance procedures |
|
11. Defences (DF) |
Failures due to the poor quality of the protection against hazardous |
The GFT box is preceded by a “decision-maker’s” box, as these people determine to a large extent how well a GFT is managed. It is management’s task to control the working environment by managing the 11 GFTs, thereby indirectly controlling the occurrence of human error.
All these GFTs can contribute to accidents in subtle ways by allowing undesirable combinations of situations and actions to come together, by increasing the chance that certain persons will commit substandard acts and by failing to provide the means to interrupt accident sequences already in progress.
There are two GFTs that require some further explanation: maintenance management and defences.
Maintenance management (MM)
Since maintenance management is a combination of factors that can be found in other GFTs, it is not, strictly speaking, a separate GFT: this type of management is not fundamentally different from other management functions. It may be treated as a separate issue because maintenance plays an important role in so many accident scenarios and because most organizations have a separate maintenance function.
Defences (DF)
The category of defences is also not a true GFT, as it is not related to the accident causation process itself. This GFT is related to what happens after an operational disturbance. It does not generate either psychological states of mind or substandard acts by itself. It is a reaction that follows a failure due to the action of one or more GFTs. While it is indeed true that a safety management system should focus on the controllable parts of the accident causation chain before and not after the unwanted incident, nevertheless the notion of defences can be used to describe the perceived effectiveness of safety barriers after a disturbance has occurred and to show how they failed to prevent the actual accident.
Managers need a structure that will enable them to relate identified problems to preventive actions. Measures taken at the levels of safety barriers or substandard acts are still necessary, although these measures can never be completely successful. To trust “last line” barriers is to trust factors that are to a large extent out of management control. Management should not attempt to manage such uncontrollable external devices, but instead must try to make their organizations inherently safer at every level.
Measuring the Level of Control over Human Error
Ascertaining the presence of the GFTs in an organization will enable accident investigators to identify the weak and strong points in the organization. Given such knowledge, one can analyse accidents and eliminate or mitigate their causes and identify the structural weaknesses within a company and fix them before they in fact contribute to an accident.
Accident investigation
The task of an accident analyst is to identify contributing factors and to categorize them. The number of times a contributing factor is identified and categorized in terms of a GFT indicates the extent to which this GFT is present. This is often done by means of a checklist or computer analysis program.
It is possible and desirable to combine profiles from different but similar types of accidents. Conclusions based upon an accumulation of accident investigations in a relatively short time are far more reliable than those drawn from a study in which the accident profile is based upon a single event. An example of such a combined profile is presented in figure 2, which shows data relating to four occurrences of one type of accident.
Figure 2. Profile of an accident type
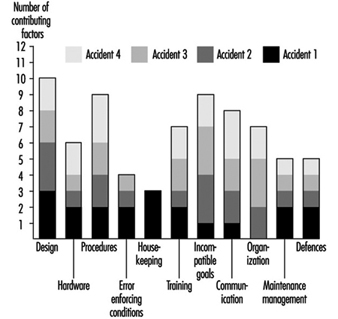
Some of the GFTs - design, procedures and incompatible goals - score consistently high in all four particular accidents. This means that in each accident, factors have been identified that were related to these GFTs. With respect to the profile of accident 1, design is a problem. Housekeeping, although a major problem area in accident 1, is only a minor problem if more than the first accident is analysed. It is suggested that about ten similar types of accidents be investigated and combined in a profile before far-reaching and possibly expensive corrective measures are taken. This way, the identification of the contributing factors and subsequent categorization of these factors can be done in a very reliable way (Van der Schrier, Groeneweg and van Amerongen 1994).
Identifying the GFTs within an organization pro-actively
It is possible to quantify the presence of GFTs pro-actively, regardless of the occurrence of accidents or incidents. This is done by looking for indicators of the presence of that GFT. The indicator used for this purpose is the answer to a straightforward yes or no question. If answered in the undesired way, it is an indication that something is not functioning properly. An example of an indicator question is: “In the past three months, did you go to a meeting that turned out to be cancelled?” If the employee answers the question in the affirmative, it does not necessarily signify danger, but it is indicative of a deficiency in one of the GFTs—communication. However, if enough questions that test for a given GFT are answered in a way that indicates an undesirable trend, it is a signal to management that it does not have sufficient control of that GFT.
To construct a system safety profile (SSP), 20 questions for each of the 11 GFTs have to be answered. Each GFT is assigned a score ranging from 0 (low level of control) to 100 (high level of control). The score is calculated relative to the industry average in a certain geographical area. An example of this scoring procedure is presented in the box.
The indicators are pseudo-randomly drawn from a database with a few hundred questions. No two subsequent checklists have questions in common, and questions are drawn in such a way that each aspect of the GFT is covered. Failing hardware could, for instance, be the result of either absent equipment or defective equipment. Both aspects should be covered in the checklist. The answering distributions of all questions are known, and checklists are balanced for equal difficulty.
It is possible to compare scores obtained with different checklists, as well as those obtained for different organizations or departments or the same units over a period of time. Extensive validation tests have been done to ensure that all questions in the database have validity and that they are all indicative of the GFT to be measured. Higher scores indicate a higher level of control - that is, more questions have been answered in the “desired” way. A score of 70 indicates that this organization is ranked among the best 30 (i.e., 100 minus 70) of comparable organizations in this kind of industry. Although a score of 100 does not necessarily mean that this organization has total control over a GFT, it does means that with regard to this GFT the organization is the best in the industry.
An example of an SSP is shown in figure 3. The weak areas of Organization 1, as exemplified by the bars in the chart, are procedures, incompatible goals, and error enforcing conditions, as they score below the industry average as shown by the dark grey area. The scores on housekeeping, hardware and defences are very good in Organization 1. On the surface, this well-equipped and tidy organization with all safety devices in place appears to be a safe place to work. Organization 2 scores exactly at the industry average. There are no major deficiencies, and although the scores on hardware, housekeeping and defences are lower, this company manages (on the average) the human error component in accidents better than Organization 1. According to the accident causation model, Organization 2 is safer than Organization 1, although this would not necessarily be apparent in comparing the organizations in “traditional” audits.
Figure 3. Example of a system safety profile
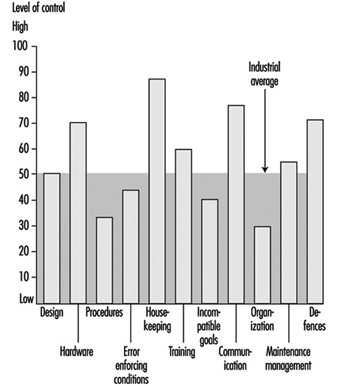
If these organizations had to decide where to allocate their limited resources, the four areas with below average GFTs would have priority. However, one cannot conclude that, since the other GFT scores are so favourable, resources may be safely withdrawn from their upkeep, since these resources are what have most probably kept them at so high a level in the first place.
Conclusions
This article has touched upon the subject of human error and accident prevention. The overview of the literature regarding control of the human error component in accidents yielded a set of six ways by which one can try to influence behaviour. Only one, restructuring the environment or modifying behaviour in order to reduce the number of situations in which people are liable to commit an error, has a reasonably favourable effect in a well-developed industrial organization where many other attempts have already been made. It will take courage on the part of management to recognize that these adverse situations exist and to mobilize the resources that are needed to effect a change in the company. The other five options do not represent helpful alternatives, as they will have little or no effect and will be quite costly.
“Controlling the controllable” is the key principle supporting the approach presented in this article. The GFTs must be discovered, attacked and eliminated. The 11 GFTs are mechanisms that have proven to be part of the accident causation process. Ten of them are aimed at preventing operational disturbances and one (defences) is aimed at the prevention of the operational disturbance’s turning into an accident. Eliminating the impact of the GFTs has a direct bearing upon the abatement of contributing causes of accidents. The questions in the checklists are aimed at measuring the “health state” of a given GFT, from both a general and a safety point of view. Safety is viewed as an integrated part of normal operations: doing the job the way it should be done. This view is in accordance with the recent “quality oriented” management approaches. The availability of policies, procedures and management tools is not the chief concern of safety management: the question is rather whether these methods are actually used, understood and adhered to.
The approach described in this article concentrates upon systemic factors and the way in which management decisions can be translated into unsafe conditions at the workplace, in contrast to the conventional belief that attention should be directed towards the individual workers who perform unsafe acts, their attitudes, motivations and perceptions of risk.
An indication of the level of control your organization has over the GFT “Communication”
In this box a list of 20 questions is presented. The questions in this list have been answered by employees of more than 250 organizations in Western Europe. These organizations were operating in different fields, ranging from chemical companies to refineries and construction companies. Normally, these questions would be tailor-made for each branch. This list serves as an example only to show how the tool works for one of the GFTs. Only those questions have been selected that have proved to be so “general” that they are applicable in at least 80% of the industries.
In “real life” employees would not only have to answer the questions (anonymously), they would also have to motivate their answers. It is not sufficient to answer “Yes” on, for example, the indicator “Did you have to work in the past 4 weeks with an outdated procedure?” The employee would have to indicate which procedure it was and under which conditions it had to be applied. This motivation serves two goals: it increases the reliability of the answers and it provides management with information it can act upon.
Caution is also necessary when interpreting the percentile score: in a real measurement, each organization would be matched against a representative sample of branch-related organizations for each of the 11 GFTs. The distribution of percentiles is from May 1995, and this distribution does change slightly over time.
How to measure the “level of control”
Answer all 20 indicators with your own situation in mind and beware of the time limits in the questions. Some of the questions might not be applicable for your situation; answer them with “n.a.” It might be impossible for you to answer some questions; answer them with a question mark“?”.
After you have answered all questions, compare your answers with the reference answers. You get a point for each “correctly” answered question.
Add the number of points together. Calculate the percentage of correctly answered questions by dividing the number of points by the number of questions you have answered with either “Yes” or “No”. The “n.a.” and “?” answers are not taken into account. The result is a percentage between 0 and 100.
The measurement can be made more reliable by having more people answering the questions and by averaging their scores over the levels or functions in the organization or comparable departments.
Twenty questions about the GFT “Communication”
Possible answers to the questions: Y = Yes; N = No; n.a. = not applicable; ? = don’t know.
- In the past 4 weeks has the telephone directory provided you with incorrect or insufficient information?
- In the past 2 weeks has your telephone conversation been interrupted due to a malfunctioning of the telephone system?
- Have you received mail in the past week that was not relevant to you?
- Has there been an internal or external audit in the past 9 months of your office paper trail?
- Was more than 20% of the information you received in the past 4 weeks labelled “urgent”?
- Did you have to work in the past 4 weeks with a procedure that was difficult to read (e.g., phrasing or language problems)?
- Have you gone to a meeting in the past 4 weeks that turned out not to be held at all?
- Has there been a day in the past 4 weeks that you had five or more meetings?
- Is there a “suggestion box” in your organization?
- Have you been asked to discuss a matter in the past 3 months that later turned out to be already decided upon?
- Have you sent any information in the past 4 weeks that was never received?
- Have you received information in the past 6 months about changes in policies or procedures more than a month after it had been put into effect?
- Have the minutes of the last three safety meetings been sent to your management?
- Has “office” management stayed at least 4 hours at the location when making the last site visit?
- Did you have to work in the past 4 weeks with procedures with conflicting information?
- Have you received within 3 days feedback on requests for information in the past 4 weeks?
- Do people in your organization speak different languages or dialects (different mother tongue)?
- Was more than 80% of the feedback you received (or gave) from management in the past 6 months of a “negative nature”?
- Are there parts of the location/workplace where it is difficult to understand each other due to extreme noise levels?
- In the past 4 weeks, have tools and/or equipment been delivered that not had been ordered?
Reference answers:
1 = N; 2 = N; 3 = N; 4 = Y; 5 = N; 6 = N; 7 = N; 8 = N; 9 = N; 10 = N; 11 = N; 12 = N; 13 = Y; 14 = N; 15 = N; 16 = Y; 17 = N; 18 = N; 19 = Y; 20 = N.
Scoring GFT “Communication”
Percent score = (a/b) x 100
where a = no. of questions answered correctly
where b = no. of questions answered “Y” or “N”.
|
Your score % |
Percentile |
% |
Equal or better |
|
0-10 |
0-1 |
100 |
99 |
|
11-20 |
2-6 |
98 |
94 |
|
21-30 |
7-14 |
93 |
86 |
|
31-40 |
15-22 |
85 |
78 |
|
41-50 |
23-50 |
79 |
50 |
|
51-60 |
51-69 |
49 |
31 |
|
61-70 |
70-85 |
30 |
15 |
|
71-80 |
86-97 |
14 |
3 |
|
81-90 |
98-99 |
2 |
1 |
|
91-100 |
99-100 |
More...
Helicopters
The helicopter is a very special type of aircraft. It is used in every part of the world and serves a variety of purposes and industries. Helicopters vary in size from the smallest single-seat helicopters to giant heavy-lift machines with gross weights in excess of 100,000 kg, which is about the same size as a Boeing 757. The purpose of this article is to discuss some of the safety and health challenges of the machine itself, the different missions it are used for, both civilian and military, and the helicopter’s operating environment.
The helicopter itself presents some very unique safety and health challenges. All helicopters use a main rotor system. This is the lifting body for the machine and serves the same purpose as the wings on a conventional airplane. Rotor blades are a significant hazard to people and property because of their size, mass and rotational speed, which also makes them difficult to see from certain angles and in different lighting conditions.
The tail rotor is also a hazard. It is usually much smaller than the main rotor and turns at a very high rate, so it too is very difficult to see. Unlike the main rotor system, which sits atop the helicopter’s mast, the tail rotor is often near ground level. People should approach a helicopter from the front, in view of the pilot, to avoid coming into contact with the tail rotor. Extra care should be taken to identify or remove obstacles (such as bushes or fences) in a temporary or unimproved helicopter landing area. Contact with the tail rotor can cause injury or death as well as serious damage to the property or helicopter.
Many people recognize the characteristic slap sound of a helicopter’s rotor system. This noise is encountered only when the helicopter is in forward flight, and is not considered a health problem. The compressor section of the engine produces extremely loud noise, often in excess of 140 dBA, and unprotected exposure must be avoided. Hearing protection (ear plugs and a noise attenuating headset or helmet) should be worn when working in and around helicopters.
There are several other hazards to consider when working with helicopters. One is flammable or combustible liquids. All helicopters require fuel to run the engine(s). The engine and the main and tail rotor transmissions use oil for lubrication and cooling. Some helicopters have one or more hydraulic systems and use hydraulic fluid.
Helicopters build a static electric charge when the rotor system is turning and/or the helicopter is flying. The static charge will dissipate when the helicopter touches the ground. If an individual is required to grab a line from a hovering helicopter, as during logging, external lifts or rescue efforts, that person should let the load or line touch the ground before grabbing it in order to avoid a shock.
Rescue/air ambulance. The helicopter was originally designed with rescue in mind, and one of its most widespread uses is as an ambulance. These are often found at the scene of an accident or disaster (see figure 2). They can land in confined areas with qualified medical teams on board who care for the injured at the scene while en route to a medical facility. Helicopters are also used for non-emergency flights when speed of transport or patient comfort is required.
Offshore oil support. Helicopters are used to help supply offshore oil operations. They transport people and supplies between land and platform and between platforms.
Executive/personal transport. The helicopter is used for point-to-point transportation. This is usually done over short distances where geography or sluggish traffic conditions prevent rapid ground transportation. Corporations build helipads on company property to allow easy access to airports or to facilitate transportation between facilities.
Sightseeing. The use of helicopters in the tourist industry has seen continuous growth. The excellent view from the helicopter combined with its ability to access remote areas make it a popular attraction.
Law enforcement. Many police departments and governmental agencies use helicopters for this type of work. The helicopter’s mobility in crowded urban areas and remote rural areas makes it invaluable. The largest rooftop helipad in the world is at the Los Angeles Police Department.
Film operations. Helicopters are a staple in action movies. Other types of movies and film-based entertainment are filmed from helicopters.
News gathering. Television and radio stations employ helicopters for traffic spotting and news gathering. Their ability to land at the place where the news is happening makes them a valuable asset. Many of them are also equipped with microwave transceivers so they can send their stories, live, over fairly long distances, while en route.
Heavy lift. Some helicopters are designed to carry heavy loads at the end of external lines. Aerial logging is one application of this concept. Construction and oil exploration crews make extensive use of the helicopter’s capacity for lifting large or bulky objects into place.
Aerial application. Helicopters can be fitted with spray booms and loaded to dispense herbicides, pesticides and fertilizers. Other devices can be added that allow helicopters to fight fires. They can drop either water or chemical retardants.
Military
Rescue/aerial ambulance. The helicopter is used widely in humanitarian efforts. Many nations around the world have coast guards that engage in maritime rescue work. Helicopters are used to transport the sick and wounded from battle areas. Still others are sent to rescue or recover people from behind enemy lines.
Attack. Helicopters can be armed and used as attack platforms over land or sea. Weapon systems include machine guns, rockets and torpedoes. Sophisticated targeting and guidance systems are used to lock on to and destroy targets at longe range.
Transport. Helicopters of all sizes are used to transport people and supplies over land or sea. Many ships are equipped with helipads to facilitate offshore operations.
The Helicopter Operating Environment
The helicopter is used all over the world in a variety of ways (see, for example, figure 1 and figure 2). In addition, it is often working very near the ground and other obstructions. This requires constant vigilance from the pilots and those who work with or ride on the aircraft. By contrast, the fixed-wing aircraft environment is more predictable, since they fly (especially the commercial airplanes) primarily from airports whose airspace is tightly controlled.
Figure 1. H-46 helicopter landing in the Arizona, US, desert.
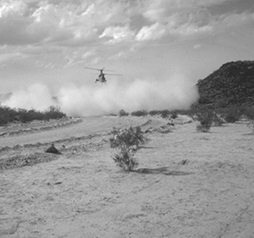
Figure 2. 5-76A Cougar helicopter landing in field at accident site.

The combat environment presents special dangers. The military helicopter also operates in a low-level environment and is subject to the same hazards. The proliferation of inexpensive, hand-carried, heat-seeking missiles represents another danger to rotorcraft. The military helicopter can use the terrain to hide itself or to mask its telltale signature, but when in the open it is vulnerable to small-arms fire and missiles.
Military forces also use night vision goggles (NVG) to enhance the pilot’s view of the area in low-light conditions. While the NVGs do increase the pilot’s ability to see, they have severe operating limitations. One major drawback is the lack of peripheral vision, which has contributed to mid-air collisions.
Accident Prevention Measures
Preventive measures can be grouped into several categories. Any one prevention category or item will not, in and of itself, prevent accidents. All of them must be used in concert to maximize their effectiveness.
Operational policies
Operational policies are formulated in advance of any operations. They are usually provided by the company with the operating certificate. They are crafted from governmental regulations, manufacturer’s recommended guidelines, industry standards, best practices and common sense. In general, they have proven to be effective in preventing incidents and accidents and include:
- Establishment of best practices and procedures. Procedures are essential for accident prevention. When not used, such as in early helicopter ambulance operations, there were extremely high accident rates. In the absence of regulatory guidance, pilots attempted to support humanitarian missions at night and/or in poor weather conditions with minimal training and helicopters that were ill equipped for such flights, leading to accidents.
- Crew resource management (CRM). CRM began as “cockpit resource management” but has since progressed to crew resource management. CRM is based on the idea that people in the crew should be free to discuss any situation among themselves to assure the successful completion of the flight. While many helicopters are flown by a single pilot, they are often working with other people who are either in the helicopter or on the ground. These people can provide information about the operation if consulted or allowed to speak. When such interaction occurs, CRM then becomes company resource management. Such collaboration is an acquired skill and should be taught to crews, company employees and others that work with and around helicopters.
- Provision of a threat-free company environment. Helicopter operations can be seasonal. This means long, tiring days. Crews should be able to end their duty day without fear of recrimination. If there are other, similar, operational deficiencies, crews should be permitted to openly identify, discuss and correct them.
- Physical hazards awareness. The helicopter presents an array of hazards. The aircraft’s dynamic components, its main and tail rotors, must be avoided. All passengers and crew members should be briefed on their location and on how to avoid coming into contact with them. The component’s surfaces should be painted to enhance their visibility. The helicopter should be positioned so that it is difficult for people to get to the tail rotor. Noise protection must be provided, especially to those with continuous exposure.
- Training for abnormal conditions. Training is often limited, if available at all, to practising autorotations for engine-out conditions. Simulators can provide exposure to a much wider range of atypical conditions without exposing the crew or machine to the real condition.
Crew practices
- Published procedures. One study of accidents has shown that, in more than half the cases, the accident would have been prevented had the pilot followed known, published procedures.
- Crew resource management. CRM should be used.
- Anticipating and avoiding known problems. Most helicopters are not equipped to fly in icing conditions and are prohibited from flying in moderate or severe turbulence, yet numerous accidents result from these circumstances. Pilots should anticipate and avoid these and other equally compromising conditions.
- Special or non-standard operations. Pilots must be thoroughly briefed for such circumstances.
Support operations
The following are crucial support operations for the safe use of helicopters:
- following published procedures
- briefing all passengers prior to boarding the helicopter
- keeping facilities free of obstructions
- keeping facilities well lit for night operations.
Aerospace Medicine: Effects of Gravity, Acceleration, and Microgravity in the Aerospace Environment
Since the first sustained flight of a powered aircraft at Kitty Hawk, North Carolina (United States), in 1903, aviation has become a major international activity. It is estimated that from 1960 to 1989, the annual number of air passengers of regularly scheduled flights increased from 20 million to over 900 million (Poitrast and deTreville 1994). Military aircraft have become indispensable weapons systems for the armed forces of many nations. Advances in aviation technology, in particular the design of life support systems, have contributed to the rapid development of space programmes with human crews. Orbital space flights occur relatively frequently, and astronauts and cosmonauts work in space vehicles and space stations for extended periods of time.
In the aerospace environment, physical stressors that may affect the health of aircrew, passengers and astronauts to some degree include reduced concentrations of oxygen in the air, decreased barometric pressure, thermal stress, acceleration, weightlessness and a variety of other potential hazards (DeHart 1992). This article describes aeromedical implications of exposure to gravity and acceleration during flight in the atmosphere and the effects of microgravity experienced in space.
Gravity and Acceleration
The combination of gravity and acceleration encountered during flight in the atmosphere produces a variety of physiological effects experienced by aircrew and passengers. At the surface of the earth, the forces of gravity affect virtually all forms of human physical activity. The weight of a person corresponds to the force exerted upon the mass of the human body by the earth’s gravitational field. The symbol used to express the magnitude of the acceleration of an object in free fall when it is dropped near the earth’s surface is referred to as g, which corresponds to an acceleration of approximately 9.8 m/s2 (Glaister 1988a; Leverett and Whinnery 1985).
Acceleration occurs whenever an object in motion increases its velocity. Velocity describes the rate of movement (speed) and direction of motion of an object. Deceleration refers to acceleration that involves a reduction in established velocity. Acceleration (as well as deceleration) is a vector quantity (it has magnitude and direction). There are three types of acceleration: linear acceleration, a change of speed without change in direction; radial acceleration, a change in direction without a change of speed; and angular acceleration, a change in speed and direction. During flight, aircraft are capable of manoeuvring in all three directions, and crew and passengers may experience linear, radial and angular accelerations. In aviation, applied accelerations are commonly expressed as multiples of the acceleration due to gravity. By convention, G is the unit expressing the ratio of an applied acceleration to the gravitational constant (Glaister 1988a; Leverett and Whinnery 1985).
Biodynamics
Biodynamics is the science dealing with the force or energy of living matter and is a major area of interest within the field of aerospace medicine. Modern aircraft are highly manoeuvrable and capable of flying at very high speeds, causing accelerative forces upon the occupants. The influence of acceleration upon the human body depends upon the intensity, rate of onset and direction of acceleration. The direction of acceleration is generally described by the use of a three-axis coordinate system (x, y, z) in which the vertical (z) axis is parallel to the long axis of the body, the x axis is oriented from front to back, and the y axis oriented side to side (Glaister 1988a). These accelerations can be categorized into two general types: sustained and transitory.
Sustained acceleration
The occupants of aircraft (and spacecraft operating in the atmosphere under the influence of gravity during launch and re-entry) commonly experience accelerations in response to aerodynamic forces of flight. Prolonged changes in velocity involving accelerations lasting longer than 2 seconds may result from changes in an aircraft’s speed or direction of flight. The physiological effects of sustained acceleration result from the sustained distortion of tissues and organs of the body and changes in the flow of blood and distribution of body fluids (Glaister 1988a).
Positive or headward acceleration along the z axis (+Gz) represents the major physiological concern. In civil air transportation, Gz accelerations are infrequent, but may occasionally occur to a mild degree during some take-offs and landings, and while flying in conditions of air turbulence. Passengers may experience brief sensations of weightlessness when subject to sudden drops (negative Gz accelerations), if unrestrained in their seats. An unexpected abrupt acceleration may cause unrestrained aircrew or passengers to be thrown against internal surfaces of the aircraft cabin, resulting in injuries.
In contrast to civil transport aviation, the operation of high- performance military aircraft and stunt and aerial spray planes may generate significantly higher linear, radial and angular accelerations. Substantial positive accelerations may be generated as a high-performance aircraft changes its flight path during a turn or a pull-up manoeuvre from a steep dive. The +Gz performance characteristics of current combat aircraft may expose occupants to positive accelerations of 5 to 7 G for 10 to 40 seconds (Glaister 1988a). Aircrew may experience an increase in the weight of tissues and of the extremities at relatively low levels of acceleration of only +2 Gz. As an example, a pilot weighing 70 kg who performed an aircraft manoeuvre which generated +2 Gz would experience an increase of body weight from 70 kg to 140 kg.
The cardiovascular system is the most important organ system for determining the overall tolerance and response to +Gz stress (Glaister 1988a). The effects of positive acceleration on vision and mental performance are due to decreases in blood flow and delivery of oxygen to eye and brain. The capability of the heart to pump blood to the eyes and brain is dependent upon its capability to exceed the hydrostatic pressure of blood at any point along the circulatory system and the inertial forces generated by the positive Gz acceleration. The situation may be likened to that of pulling upward a balloon partially full of water and observing the downward distension of the balloon because of the resultant inertial force acting upon the mass of water. Exposure to positive accelerations may cause temporary loss of peripheral vision or complete loss of consciousness. Military pilots of high- performance aircraft may risk development of G-induced blackouts when exposed to rapid onset or extended periods of positive acceleration in the +Gz axis. Benign cardiac arrhythmias frequently occur following exposure to high sustained levels of +Gz acceleration, but usually are of minimal clinical significance unless pre-existing disease is present; –Gz acceleration seldom occurs because of limitations in aircraft design and performance, but may occur during inverted flight, outside loops and spins and other similar manoeuvres. The physiological effects associated with exposure to –Gz acceleration primarily involve increased vascular pressures in the upper body, head and neck (Glaister 1988a).
Accelerations of sustained duration which act at right angles to the long axis of the body are termed transverse accelerations and are relatively uncommon in most aviation situations, with the exception of catapult and jet- or rocket-assisted take-offs from aircraft carriers, and during launch of rocket systems such as the space shuttle. The accelerations encountered in such military operations are relatively small, and usually do not affect the body in a major fashion because the inertial forces act at right angles to the long axis of the body. In general, the effects are less pronounced than in Gz accelerations. Lateral acceleration in ±Gy axis are uncommon, except with experimental aircraft.
Transitory acceleration
The physiological responses of individuals to transitory accelerations of short duration are a major consideration in the science of aircraft accident prevention and crew and passenger protection. Transitory accelerations are of such brief duration (considerably less than 1 second) that the body is unable to attain a steady-state status. The most common cause of injury in aircraft accidents results from the abrupt deceleration that occurs when an aircraft impacts the ground or water (Anton 1988).
When an aircraft impacts the ground, a tremendous amount of kinetic energy applies damaging forces to the aircraft and its occupants. The human body responds to these applied forces by a combination of acceleration and strain. Injuries result from deformation of tissues and organs and trauma to anatomic parts caused by collision with structural components of the aircraft cockpit and/or cabin.
Human tolerance to abrupt deceleration is variable. The nature of injuries will depend on the nature of the applied force (whether it primarily involves penetrating or blunt impact). At impact, the forces which are generated are dependent on the longitudinal and horizontal decelerations which are generally applied to an occupant. Abrupt decelerative forces are often categorized into tolerable, injurious and fatal. Tolerable forces produce traumatic injuries such as abrasions and bruises; injurious forces produce moderate to severe trauma which may not be incapacitating. It is estimated that an acceleration pulse of approximately 25 G maintained for 0.1 second is the limit of tolerability along the +Gz axis, and that about 15 G for 0.1 sec is the limit for the –Gz axis (Anton 1988).
Multiple factors affect human tolerance to short-duration acceleration. These factors include the magnitude and duration of the applied force, the rate of onset of the applied force, its direction and the site of application. It should be noted that people can withstand much greater forces perpendicular to the long axis of the body.
Protective Countermeasures
Physical screening of crew members to identify serious pre- existing diseases which might put them at increased risk in the aerospace environment is a key function of aeromedical programmes. In addition, countermeasures are available to crew of high-performance aircraft to protect against the adverse effects of extreme accelerations during flight. Crew members must be trained to recognize that multiple physiological factors may decrease their tolerance to G stress. These risk factors include fatigue, dehydration, heat stress, hypoglycemia and hypoxia (Glaister 1988b).
Three types of manoeuvres which crew members of high- performance aircraft employ to minimize adverse effects of sustained acceleration during flight are muscle tensing, forced expiration against a closed or partially closed glottis (back of the tongue) and positive-pressure breathing (Glaister 1988b; DeHart 1992). Forced muscle contractions exert increased pressure on blood vessels to decrease venous pooling and increase venous return and cardiac output, resulting in increased blood flow to the heart and upper body. While effective, the procedure requires extreme, active effort and may rapidly result in fatigue. Expiration against a closed glottis, termed the Valsalva manoeuver (or M-1 procedure) can increase pressure in the upper body and raise the intrathoracic pressure (inside the chest); however, the result is short lived and may be detrimental if prolonged, because it reduces venous blood return and cardiac output. Forcibly exhaling against a partially closed glottis is a more effective anti-G straining manoeuver. Breathing under positive pressure represents another method to increase intrathoracic pressure. Positive pressures are transmitted to the small artery system, resulting in increased blood flow to the eyes and brain. Positive-pressure breathing must be combined with the use of anti-G suits to prevent excessive pooling in the lower body and limbs.
Military aircrew practise a variety of training methods to enhance G tolerance. Crews frequently train in a centrifuge consisting of a gondola attached to a rotating arm which spins and generates +Gz acceleration. Aircrew become familiar with the spectrum of physiological symptoms which may develop and learn the proper procedures to control them. Physical fitness training, particularly whole-body strength training, also has been found to be effective. One of the most common mechanical devices used as protective equipment to reduce the effects of +G exposure consists of pneumatically inflated anti-G suits (Glaister 1988b). The typical trouser-like garment consists of bladders over the abdomen, thighs and calves which automatically inflate by means of an anti-G valve in the aircraft. The anti-G valve inflates in reaction to an applied acceleration upon the aircraft. Upon inflation, the anti-G suit produces a rise in the tissue pressures of the lower extremities. This maintains peripheral vascular resistance, reduces the pooling of blood in the abdomen and lower limbs and minimizes downward displacement of the diaphragm to prevent the increase in the vertical distance between the heart and brain that may be caused by positive acceleration (Glaister 1988b).
Surviving transitory accelerations associated with aircraft crashes is dependent on effective restraint systems and the maintenance of the cockpit/cabin integrity to minimize intrusion of damaged aircraft components into the living space (Anton 1988). The function of lap belts, harnesses and other types of restraint systems are to limit the movement of the aircrew or passengers and to attenuate the effects of sudden deceleration during impact. The effectiveness of the restraint system depends on how well it transmits loads between the body and the seat or vehicle structure. Energy-attenuating seating and rearward facing seats are other features in aircraft design which limit injury. Other accident-protection technology includes the design of airframe components to absorb energy and improvements in seat structures to reduce mechanical failure (DeHart 1992; DeHart and Beers 1985).
Microgravity
Since the 1960s, astronauts and cosmonauts have flown numerous missions into space, including 6 lunar landings by Americans. Mission duration has been from several days to a number of months, with a few Russian cosmonauts logging approximately 1-year flights. Subsequent to these space flights, a large body of literature has been written by physicians and scientists describing in-flight and post-flight physiological aberrations. For the most part, these aberrations have been attributed to exposure to weightlessness or microgravity. Although these changes are transient, with total recovery within several days to several months after returning to Earth, nobody can say with complete certitude whether astronauts would be so fortunate after missions lasting 2 to 3 years, as envisioned for a round trip to Mars. The major physiological aberrations (and countermeasures) can be categorized as cardiovascular, musculoskeletal, neurovestibular, haematological and endocrinological (Nicogossian, Huntoon and Pool 1994).
Cardiovascular hazards
Thus far, there have been no serious cardiac problems in space, such as heart attacks or heart failure, although several astronauts have developed abnormal heart rhythms of a transient nature, particularly during extra-vehicular activity (EVA). In one case, a Russian cosmonaut had to return to Earth earlier than planned, as a precautionary measure.
On the other hand, microgravity seems to induce a lability of blood pressure and pulse. Although this does not cause impaired health or crew performance during flight, approximately half of astronauts immediately post-flight do become extremely dizzy and giddy, with some experiencing fainting (syncope) or near fainting (pre-syncope). The cause of this intolerance to being vertical is thought to be a drop in blood pressure upon re-entering the earth’s gravitational field, combined with the dysfunction of the body’s compensatory mechanisms. Hence, a low blood pressure and decreasing pulse unopposed by the body’s normal response to such physiological aberrations results in these symptoms.
Although these pre-syncopal and syncopal episodes are transient and without sequelae, there remains great concern for several reasons. First, in the event that a returning space vehicle were to have an emergency, such as a fire, upon landing, it would be extremely difficult for astronauts to rapidly escape. Second, astronauts landing on the moon after periods of time in space would be prone to some extent to pre-fainting and fainting, even though the moon’s gravitational field is one-sixth that of Earth. And finally, these cardiovascular symptoms might be far worse or even lethal after very long missions.
It is for these reasons that there has been an aggressive search for countermeasures to prevent or at least ameliorate the microgravity effects upon the cardiovascular system. Although there are a number of countermeasures now being studied that show some promise, none so far has been proven truly effective. Research has focused on in-flight exercise utilizing a treadmill, bicycle ergometer and rowing machine. In addition, studies are also being conducted with lower body negative pressure (LBNP). There is some evidence that lowering the pressure around the lower body (using compact special equipment) will enhance the body’s ability to compensate (i.e., raise blood pressure and pulse when they fall too low). The LBNP countermeasure might be even more effective if the astronaut drinks moderate amounts of specially constituted salt water simultaneously.
If the cardiovascular problem is to be solved, not only is more work needed on these countermeasures, but also new ones must be found.
Musculoskeletal hazards
All astronauts returning from space have some degree of muscle wasting or atrophy, regardless of mission duration. Muscles at particular risk are those of the arms and legs, resulting in decreased size as well as strength, endurance and work capacity. Although the mechanism for these muscle changes is still ill-defined, a partial explanation is prolonged disuse; work, activity and movement in microgravity are almost effortless, since nothing has any weight. This may be a boon for astronauts working in space, but is clearly a liability when returning to a gravitational field, whether it be that of the moon or Earth. Not only could a weakened condition impede post-flight activities (including work on the lunar surface), it could also compromise rapid ground emergency escape, if required upon landing. Another factor is the possible requirement during EVA to do space vehicle repairs, which can be very strenuous. Countermeasures under study include in-flight exercises, electrical stimulation and anabolic medication (testosterone or testosterone-like steroids). Unfortunately, these modalities at best only retard muscle dysfunction.
In addition to muscle wasting, there is also a slow but inexorable loss of bone in space (about 300 mg per day, or 0.5% of total bone calcium per month) experienced by all astronauts. This has been documented by post-flight x rays of bones, particularly of those that bear weight (i.e., the axial skeleton). This is due to a slow but unremitting loss of calcium into the urine and faeces. Of great concern is the continuing loss of calcium, regardless of flight duration. Consequently, this calcium loss and bone erosion could be a limiting factor of flight, unless an effective countermeasure can be found. Although the precise mechanism of this very significant physiological aberration is not fully understood, it undoubtedly is due in part to the absence of gravitational forces on bone, as well as disuse, similar to muscle wasting. If bone loss were to continue indefinitely, particularly over long missions, bones would become so brittle that eventually there would be risk of fractures with even low levels of stress. Furthermore, with a constant flow of calcium into the urine via the kidneys, a possibility of renal stone formation exists, with accompanying severe pain, bleeding and infection. Clearly, any of these complications would be a very serious matter were they to occur in space.
Unfortunately, there are no known countermeasures that effectively prevent calcium loss during space flight. A number of modalities are being tested, including exercise (treadmill, bicycle ergometer and rowing machine), the theory being that such voluntary physical stresses would normalize bone metabolism, thereby preventing or at least ameliorating bone loss. Other countermeasures under investigation are calcium supplements, vitamins and various medications (such as diphosphonates—a class of medications that has been shown to prevent bone loss in patients with osteoporosis). If none of these simpler countermeasures prove to be effective, it is possible that the solution lies in artificial gravity that could be produced by continuous or intermittent rotation of the space vehicle. Although such motion could generate gravitational forces similar to that of the earth, it would represent an engineering “nightmare”, in addition to major add-on costs.
Neurovestibular hazards
More than half of the astronauts and cosmonauts suffer from space motion sickness (SMS). Although the symptoms vary somewhat from individual to individual, most suffer from stomach awareness, nausea, vomiting, headache and drowsiness. Often there is an exacerbation of symptoms with rapid head movement. If an astronaut develops SMS, it usually occurs within a few minutes to a few hours after launch, with complete remission within 72 hours. Interestingly, the symptoms sometimes recur after returning to the earth.
SMS, particularly vomiting, can not only be disconcerting to the crew members, it also has the potential to cause performance decrement in an astronaut who is ill. Furthermore, the risk of vomiting while in a pressure suit doing EVA cannot be ignored, as the vomitus could cause the life-support system to malfunction. It is for these reasons that no EVA activities are ever scheduled during the first 3 days of a space mission. If an EVA becomes necessary, for example, to do emergency repairs on the space vehicle, the crew would have to take that risk.
Much neurovestibular research has been directed toward finding a way to prevent as well as to treat SMS. Various modalities, including anti-motion-sickness pills and patches, as well as using pre-flight adaptation trainers such as rotating chairs to habituate astronauts, have been attempted with very limited success. However, in recent years it has been discovered that the antihistamine phenergan, given by injection, is an extremely effective treatment. Hence, it is carried onboard all flights and given as required. Its efficacy as a preventive has yet to be demonstrated.
Other neurovestibular symptoms reported by astronauts include dizziness, vertigo, dysequilibrium and illusions of self-motion and motion of the surrounding environment, sometimes making walking difficult for a short time post-flight. The mechanisms for these phenomena are very complex and are not completely understood. They could be problematical, particularly after a lunar landing following several days or weeks in space. As of now, there are no known effective countermeasures.
Neurovestibular phenomena are most likely caused by dysfunction of the inner ear (the semicircular canals and utricle-saccule), because of microgravity. Either erroneous signals are sent to the central nervous system or signals are misinterpreted. In any event, the results are the aforementioned symptoms. Once the mechanism is better understood, effective countermeasures can be identified.
Haematological hazards
Microgravity has an effect upon the body’s red and white blood cells. The former serve as a conveyor of oxygen to the tissues, and the latter as an immunological system to protect the body from invading organisms. Hence, any dysfunction could cause deleterious effects. For reasons not understood, astronauts lose approximately 7 to 17% of their red blood cell mass early in flight. This loss appears to plateau within a few months, returning to normal 4 to 8 weeks post-flight.
So far, this phenomenon has not been clinically significant, but, rather, a curious laboratory finding. However, there is clear potential for this loss of red blood cell mass to be a very serious aberration. Of concern is the possibility that with very long missions envisioned for the twenty-first century, red blood cells could be lost at an accelerated rate and in far greater quantities. If this were to occur, anaemia could develop to the point that an astronaut could become seriously ill. It is hoped that this will not be the case, and that the red blood cell loss will remain very small, regardless of mission duration.
In addition, several components of the white blood cell system are affected by microgravity. For example, there is an overall increase in the white blood cells, mainly neutrophils, but a decrease in lymphocytes. There is also evidence that some white blood cells do not function normally.
As of now, in spite of these changes, no illness has been attributed to these white blood cell changes. It is unknown whether or not a long mission will cause further decrease in numbers as well as further dysfunction. Should this occur, the body’s immune system would be compromised, making astronauts very susceptible to infectious disease, and possibly incapacitated by even minor illness that would otherwise easily be fended off by a normally functioning immunological system.
As with the red blood cell changes, the white blood cell changes, at least on missions of approximately one year, are not of clinical significance. Because of the potential risk of serious illness in-flight or post-flight, it is critical that research continue on the effects of microgravity on the haematological system.
Endocrinological hazards
During space flight, it has been noted that there are a number of fluid and mineral changes within the body due in part to changes in the endocrine system. In general, there is a loss of total body fluids, as well as calcium, potassium and calcium. A precise mechanism for these phenomena has eluded definition, although changes in various hormonal levels offer a partial explanation. To further confound matters, laboratory findings are often inconsistent among the astronauts who have been studied, making it impossible to discern a unitary hypothesis as to the cause of these physiological aberrations. In spite of this confusion, these changes have caused no known impairment of health of astronauts and no performance decrement in flight. What the significance of these endocrine changes are for very long flight, as well as the possibility that they may be harbingers of very serious sequelae, is unknown.
Acknowledgements: The authors would like to recognize the work of the Aerospace Medical Association in this area.
Aircraft Flight Operations
Adapted from the 3rd edition Encyclopaedia article “Aviation - flying personnel” authored by H. Gartmann.
This article deals with the occupational safety and health of the crew members of civil aviation aircraft; see also the articles “Airport and flight control operations”, “Aircraft maintenance operations” and “Helicopters” for additional information.
Technical Crew Members
The technical personnel, or flight crew members, are responsible for the operation of the aircraft. Depending on aircraft type, the technical crew includes the pilot-in-command (PIC), the co-pilot (or first officer), and the flight engineer or a second officer (a pilot).
The PIC (or captain) has the responsibility for the safety of the aircraft, the passengers and the other crew members. The captain is the legal representative of the air carrier and is vested by the air carrier and the national aviation authority with the authority to carry out all actions necessary to fulfil this mandate. The PIC directs all duties on the flight deck and is in command of the entire aircraft.
The co-pilot takes his or her orders directly from the PIC and acts as the captain’s deputy upon delegation or in the latter’s absence. The co-pilot is the primary assistant to the PIC in a flight crew; in newer generation, two-person flight deck operations and in older two-engine aircraft, he or she is the only assistant.
Many older generation aircraft carry a third technical crew member. This person may be a flight engineer or a third pilot (usually called the second officer). The flight engineer, when present, is responsible for the mechanical condition of the aircraft and its equipment. New generation aircraft have automated many of the functions of the flight engineer; in these two-person operations, the pilots perform such duties as a flight engineer might otherwise perform that have not been automated by design.
On certain long-distance flights, the crew may be supplemented by a pilot with the qualifications of the PIC, an additional first officer and, when required, an additional flight engineer.
National and international laws stipulate that aircraft technical personnel may operate aircraft only when in possession of a valid licence issued by the national authority. In order to maintain their licences, technical crew members are given ground school training once every year; they are also tested in a flight simulator (a device that simulates real flight and flight emergency conditions) twice a year and in actual operations at least once a year.
Another condition for the receipt and renewal of a valid licence is a medical examination every 6 months for airline transport and commercial pilots over 40 years old, or every 12 months for commercial pilots under 40 years old and for flight engineers. The minimum requirements for these examinations are specified by the ICAO and by national regulations. A certain number of physicians experienced in aviation medicine may be authorized to provide such examinations by the national authorities concerned. These may include air ministry physicians, airforce flight surgeons, airline medical officers or private practitioners designated by the national authority.
Cabin Crew Members
The cabin crew (or flight attendants) are primarily responsible for passenger safety. Flight attendants perform routine safety duties; in addition, they are responsible for monitoring the aircraft cabin for security and safety hazards. In the event of an emergency, the cabin crew members are responsible for the organization of emergency procedures and for the safe evacuation of the passengers. In flight, cabin crew may need to respond to emergencies such as smoke and fire in the cabin, turbulence, medical trauma, aircraft decompressions, and hijackings or other terrorist threats. In addition to their emergency responsibilities, flight attendants also provide passenger service.
The minimum cabin crew ranges from 1 to 14 flight attendants, depending on the type of aircraft, the aircraft’s passenger capacity and national regulations. Additional staffing requirements may be determined by labour agreements. The cabin crew may be supplemented by a purser or service manager. The cabin crew is usually under the supervision of a lead or “in-charge” flight attendant, who, in turn, is responsible and reports directly to the PIC.
National regulations do not usually stipulate that the cabin crew should hold licences in the same way as the technical crew; however, cabin crew are required by all national regulations to have received appropriate instruction and training in emergency procedures. Periodic medical examinations are not usually required by law, but some air carriers require medical examinations for the purposes of health maintenance.
Hazards and Their Prevention
All air crew members are exposed to a wide variety of stress factors, both physical and psychological, to the hazards of an aircraft accident or other flight incident and to the possible contraction of a number of diseases.
Physical stress
Lack of oxygen, one of the main concerns of aviation medicine in the early days of flying, had until recently become a minor consideration in modern air transport. In the case of a jet aircraft flying at 12,000 m altitude, the equivalent altitude in the pressurized cabin is only 2,300 m and, consequently, symptoms of oxygen deficiency or hypoxia will not normally be encountered in healthy persons. Oxygen deficiency tolerance varies from individual to individual, but for a healthy, non-trained subject the presumed altitude threshold at which the first symptoms of hypoxia occur is 3,000 m.
With the advent of new generation aircraft, however, concerns about cabin air quality have resurfaced. Aircraft cabin air consists of air drawn from compressors in the engine and often also contains recirculated air from within the cabin. The flow rate of outside air within an aircraft cabin can vary from as little as 0.2 m3 per minute per person to 1.42 m3 per minute per person, depending upon aircraft type and age, and depending on location within the cabin. New aircraft use recirculated cabin air to a much greater degree than do older models. This air quality issue is specific to the cabin environment. The flight deck compartment air flow rates are often as high as 4.25 m3 per minute per crew member. These higher air flow rates are provided on the flight deck to meet the cooling requirements of the avionic and electronic equipment.
Complaints of poor cabin air quality from cabin crew and passengers have increased in recent years, prompting some national authorities to investigate. Minimal ventilation rates for aircraft cabins are not defined in national regulations. Actual cabin airflow is seldom measured once an aircraft is put into service, since there is no requirement to do so. Minimal air flow and the use of recirculated air, combined with other issues of air quality, such as the presence of chemical contaminants, micro-organisms, other allergens, tobacco smoke and ozone, require further evaluation and study.
Maintaining a comfortable air temperature in the cabin does not represent a problem in modern aircraft; however, the humidity of this air cannot be raised to a comfortable level, due to the large temperature difference between the aircraft interior and exterior. Consequently, both crew and passengers are exposed to extremely dry air, especially on long-distance flights. Cabin humidity depends on the cabin ventilation rate, passenger load, temperature and pressure. The relative humidity found on aircraft today varies from about 25% to less than 2%. Some passengers and crew members experience discomfort, such as dryness of the eyes, nose and throat, on flights that exceed 3 or 4 hours. There is no conclusive evidence of extensive or serious adverse health effects of low relative humidity on flight personnel. However, precautions should be taken to avoid dehydration; adequate intake of liquids such as water and juices should be sufficient to prevent discomfort.
Motion sickness (dizziness, malaise and vomiting due to the abnormal movements and altitudes of the aircraft) was a problem for civil aviation crews and passengers for many decades; the problem still exists today in the case of small sports aircraft, military aircraft and aerial acrobatics. In modern jet transport aircraft, it is much less serious and occurs less frequently due to higher aircraft speeds and take-off weights, higher cruising altitudes (which take the aircraft above the turbulence zones) and the use of airborne radar (which enables squalls and storms to be located and circumnavigated). Additionally, the lack of motion sickness also may be attributed to the more spacious, open design of today’s aircraft cabin, which provides a greater feeling of security, stability and comfort.
Other physical and chemical hazards
Aircraft noise, while a significant problem for ground personnel, is less serious for the crew members of a modern jet aircraft than was the case with the piston-engined plane. The efficiency of noise control measures such as insulation in modern aircraft have helped to eliminate this hazard in most flight environments. Additionally, improvements in communications equipment have minimized background noise levels from these sources.
Ozone exposure is a known but poorly monitored hazard for air crew and passengers. Ozone is present in the upper atmosphere as a result of the photochemical conversion of oxygen by solar ultraviolet radiation at altitudes used by commercial jet aircraft. The mean ambient ozone concentration increases with increasing latitude and is most prevalent during spring. It can also vary with weather systems, with the result of high ozone plumes descending down to lower altitudes.
Symptoms of ozone exposure include cough, upper airway irritation, tickle in the throat, chest discomfort, substantial pain or soreness, difficulty or pain in taking a deep breath, shortness of breath, wheezing, headache, fatigue, nasal congestion and eye irritation. Most people can detect ozone at 0.02 ppm, and studies have shown that ozone exposure at 0.5 ppm or more causes significant decrements in pulmonary function. The effects of ozone contamination are felt more readily by persons engaged in moderate to heavy activity than those who are at rest or engaged in light activity. Thus flight attendants (who are physically active in flight) have experienced the effects of ozone earlier and more frequently than technical crew or passengers on the same flight when ozone contamination was present.
In one study conducted in the late 1970s by the aviation authority in the United States (Rogers 1980), several flights (mostly at 9,150 to 12,200 m) were monitored for ozone contamination. Eleven per cent of the flights monitored were found to exceed that authority’s permissible ozone concentration limits. Methods of minimizing ozone exposure include choice of routes and altitudes that avoid areas of high ozone concentration and the use of air treatment equipment (usually a catalytic converter). The catalytic converters, however, are subject to contamination and loss of efficiency. Regulations (when they exist) do not require their periodic removal for efficiency testing, nor do they require monitoring of ozone levels in actual flight operations. Crew members, especially cabin crew, have requested that better monitoring and control of ozone contamination be implemented.
Another serious concern for technical and cabin crew members is cosmic radiation, which includes radiation forms that are transmitted through space from the sun and other sources in the universe. Most cosmic radiation that travels through space is absorbed by the earth’s atmosphere; however, the higher the altitude, the less the protection. The earth’s magnetic field also provides some shielding, which is greatest near the equator and decreases at the higher latitudes. Air crew members are exposed to cosmic radiation levels inflight that are higher than those received on the ground.
The amount of radiation exposure depends on the type and the amount of flying; for example, a crew member who flies many hours at high altitudes and high latitudes (e.g., polar routes) will receive the greatest amount of radiation exposure. The civil aviation authority in the United States (the FAA) has estimated that the long-term average cosmic radiation dose for air crew members ranges from 0.025 to 0.93 millisieverts (mSv) per 100 block hours (Friedberg et al. 1992). Based on FAA estimates, a crew member flying 960 block hours per year (or an average of 80 hours/month) would receive an estimated annual radiation dose of between 0.24 and 8.928 mSv. These levels of exposure are lower than the recommended occupational limit of 20 millisieverts per year (5-year average) established by the International Commission on Radiological Protection (ICRP).
The ICRP, however, recommends that occupational exposure to ionizing radiation should not exceed 2 mSv during pregnancy. In addition, the US National Council on Radiation Protection and Measurements (NCRP) recommends that exposure not exceed 0.5 mSv in any month once a pregnancy is known. If a crew member worked an entire month on flights with the highest exposures, the monthly dose rate could exceed the recommended limit. Such a pattern of flying over 5 or 6 months could result in an exposure which also would exceed the recommended pregnancy limit of 2 mSv.
The health effects of low-level radiation exposure over a period of years include cancer, genetic defects and birth defects to a child exposed in the womb. The FAA estimates that the added risk of fatal cancer resulting from exposure to inflight radiation would range from 1 in 1,500 to 1 in 94, depending on the type of routes and number of hours flown; the level of added risk of a serious genetic defect resulting from one parent’s exposure to cosmic radiation ranges from 1 in 220,000 live births to 1 in 4,600 live births; and the risk of mental retardation and childhood cancer in a child exposed in utero to cosmic radiation would range between 1 in 20,000 to 1 in 680, depending upon the type and amount of flying the mother did while pregnant.
The FAA report concludes that “radiation exposure is not likely to be a factor that would limit flying for a non-pregnant crew member” because even the largest amount of radiation received annually by a crew member working as much as 1,000 block hours a year is less than half the ICRP recommended average annual limit. However, for a pregnant crew member, the situation is different. The FAA calculates that a pregnant crew member working 70 block hours per month would exceed the recommended 5-month limit on about one-third of the flights they studied (Friedberg et al. 1992).
It should be stressed that these exposure and risk estimates are not universally accepted. Estimates are dependent upon assumptions about the types and mix of radioactive particles encountered at altitude and the weight or quality factor used to determine dose estimates for some of these forms of radiation. Some scientists believe that the actual radiation hazard to air crew members may be greater than described above. Additional monitoring of the flight environment with reliable instrumentation is needed to more clearly determine the extent of inflight radiation exposure.
Until more is known about exposure levels, air crew members should keep their exposure to all types of radiation as low as possible. With respect to inflight radiation exposure, minimizing the amount of flight time and maximizing the distance from the source of radiation can have a direct effect on the dose received. Reducing monthly and yearly flight time and/or selecting flights which fly at lower altitudes and latitudes will reduce exposure. An air crew member who has the ability to control his or her flight assignments might choose to fly fewer hours per month, to bid for a mix of domestic and international flights or to request leaves periodically. A pregnant air crew member might choose to take a leave for the duration of the pregnancy. Since the first trimester is the most crucial time to guard against radiation exposure, an air crew member planning a pregnancy also may want to consider a leave especially if she is flying long-distance polar routes on a regular basis and has no control over her flight assignments.
Ergonomic problems
The main ergonomic problem for technical crew is the need to work for many hours in a sitting but unsettled position and in a very limited working area. In this position (restrained by lap and shoulder harness), it is necessary to carry out a variety of tasks such as movements of the arms, legs and head in different directions, consulting instruments at a distance of about 1 m above, below, to the front and to the side, scanning the far distance, reading a map or manual at close distance (30 cm), listening through earphones or talking through a microphone. Seating, instrumentation, lighting, cockpit microclimate and radio communications equipment comfort have been and still remain the object of continuous improvement. Today’s modern flight deck, often referred to as the “glass cockpit”, has created yet another challenge with its use of leading-edge technology and automation; maintaining vigilance and situational awareness under these conditions has created new concerns for both the designers of aircraft and the technical personnel who fly them.
Cabin crew have an entirely different set of ergonomic problems. One main problem is that of standing and moving around during flight. During climb and descent, and in turbulence, the cabin crew is required to walk on an inclined floor; in some aircraft the cabin incline may remain at approximately 3% during cruise as well. Also, many cabin floors are designed in a manner that creates a rebound effect while walking, putting an additional stress on the flight attendants who are constantly moving about during a flight. Another important ergonomic problem for flight attendants has been the use of mobile carts. These carts can weigh up to 100 to 140 kg and must be pushed and pulled up and down the length of the cabin. Additionally, the poor design and maintenance of the braking mechanisms on many of these carts have caused an increase in repetitive-strain injuries (RSIs) among flight attendants. Air carriers and cart manufacturers are now taking a more serious look at this equipment, and new designs have resulted in ergonomic improvements. Additional ergonomic problems result from the need to lift and carry heavy or bulky items in restricted spaces or while maintaining uncomfortable body posture.
Workload
The workload for air crew members depends on the task, the ergonomic layout, the hours of work/duty and many other factors. The additional factors affecting the technical crew include:
- duration of rest time between present and last flight and the duration of sleep time during the rest period
- the pre-flight briefing and problems encountered during the pre-flight briefing
- delays preceding departure
- timing of flights
- meteorological conditions at the point of departure, en route and at the destination
- number of flight segments
- type of equipment being flown
- quality and quantity of radio communications
- visibility during descent, glare and protection from the sun
- turbulence
- technical problems with the aircraft
- experience of other crew members
- air traffic (especially at point of departure and destination)
- presence of air carrier or national authority personnel for purposes of checking crew competency.
Certain of these factors may be equally important for the cabin crew. In addition, the latter are subject to the following specific factors:
- pressure of time due to short duration of flight, high number of passengers and extensive service requirements
- extra services demanded by passengers, the character of certain passengers and, occasionally, verbal or physical abuse by passengers
- passengers requiring special care and attention (e.g., children, the disabled, the elderly, a medical emergency)
- extent of preparatory work
- lack of necessary service items (e.g., insufficient meals, beverages and so on) and equipment.
The measures taken by air carrier managements and government administrations to keep crew workload within reasonable limits include: improvement and extension of air-traffic control; reasonable limits on hours of duty and requirements for minimum rest provisions; execution of preparatory work by dispatchers, maintenance, catering and cleaning personnel; automation of cockpit equipment and tasks; the standardization of service procedures; adequate staffing; and the provision of efficient and easy-to-handle equipment.
Hours of work
One of the most important factors affecting both technical and cabin crew member occupational health and safety (and certainly the most widely discussed and controversial) is the issue of flight fatigue and recovery. This issue covers the broad spectrum of activity encompassing crew scheduling practices—length of duty periods, amount of flight time (daily, monthly and yearly), reserve or standby duty periods and availability of time for rest both while on flight assignment and at domicile. Circadian rhythms, especially sleep intervals and duration, with all their physiological and psychological implications, are especially significant for air crew members. Time shifts due either to night flights or to east/west or west/east travel across a number of time zones create the greatest problems. Newer generation aircraft, which have the capability of remaining aloft for up to 15 to 16 hours at a time, have exacerbated the conflict between airline schedules and human limitations.
National regulations to limit duty and flight periods and to provide minimum rest limitations exist on a nation by nation basis. In some instances, these regulations have not kept pace with technology or science, nor do they necessarily guarantee flight safety. Until recently there has been little attempt to standardize these regulations. Current attempts at harmonization have given rise to concerns among air crew members that those countries with more protective regulations may be required to accept lower and less adequate standards. In addition to national regulations, many air crew members have been able to negotiate more protective hours of service requirements in their labour agreements. While these negotiated agreements are important, most crew members feel that hours of service standards are essential to their health and safety (and to that of the flying public), and thus minimum standards should be adequately regulated by the national authorities.
Psychological stress
In recent years, aircraft crew have been confronted with a serious mental stress factor: the likelihood of hijacking, bombs and armed attacks on aircraft. Although security measures in civil aviation worldwide have been considerably increased and upgraded, the sophistication of terrorists has likewise increased. Air piracy, terrorism and other criminal acts remain a real threat to all air crew members. The commitment and cooperation of all national authorities as well as the force of worldwide public opinion are needed to prevent these acts. Additionally, air crew members must continue to receive special training and information on security measures and must be informed on a timely basis of suspected threats of air piracy and terrorism.
Air crew members understand the importance of starting flight duty in a sufficiently good mental and physical state to ensure that the fatigue and stresses occasioned by the flight itself will not affect safety. Fitness for flight duty may occasionally be impaired by psychological and physical stress, and it is the responsibility of the crew member to recognize whether or not he or she is fit for duty. Sometimes, however, these effects may not be readily apparent to the person under duress. For this reason, most airlines and air crew member associations and labour unions have professional standards committees to assist crew members in this area.
Accidents
Fortunately, catastrophic aircraft accidents are rare events; nonetheless, they do represent a hazard for air crew members. An aircraft accident is practically never a hazard resulting from a single, well-defined cause; in almost every instance, a number of technical and human factors coincide in the causal process.
Defective equipment design or equipment failure, especially as a result of inadequate maintenance, are two mechanical causes of aircraft accidents. One important, although relatively rare, type of human failure is sudden death due, for example, to myocardial infarction; other failures include sudden loss of consciousness (e.g., epileptic fit, cardiac syncope and fainting due to food poisoning or other intoxication). Human failure may also result from the slow deterioration of certain functions such as hearing or vision, although no major aircraft accident has been attributed to such a cause. Preventing accidents from medical causes is one of the most important tasks of aviation medicine. Careful personnel selection, regular medical examinations, surveys of absence due to illness and accidents, continuous medical contact with working conditions and industrial hygiene surveys can considerably decrease the danger of sudden incapacitation or slow deterioration in technical crew. Medical personnel should also routinely monitor flight scheduling practices to prevent fatigue-related incidents and accidents. A well-operated, modern airline of significant size should have its own medical service for these purposes.
Advances in aircraft accident prevention are often made as a result of careful investigation of accidents and incidents. Systematic screening of all, even minor, accidents and incidents by an accident investigation board comprising technical, operational, structural, medical and other experts is essential to determine all causal factors in an accident or incident and to make recommendations for preventing future occurrences.
A number of strict regulations exist in aviation to prevent accidents caused by use of alcohol or other drugs. Crew members should not consume quantities of alcohol in excess of what is compatible with professional requirements, and no alcohol at all should be consumed during and for at least 8 hours prior to flight duty. Illegal drug use is strictly prohibited. Drug use for medicinal purposes is strictly controlled; such drugs are generally not allowed during or immediately preceding flight, although exceptions may be allowed by a recognized flight physician.
The transport of hazardous materials by air is yet another cause of aircraft accident and incidents. A recent survey covering a 2-year period (1992 to 1993) identified over 1,000 aircraft incidents involving hazardous materials on passenger and cargo air carriers in one nation alone. More recently, an accident in the United States which resulted in the deaths of 110 passengers and crew involved the carriage of hazardous cargo. Hazardous materials incidents in air transportation occur for a number of reasons. Shippers and passengers may be unaware of the dangers presented by the materials they bring aboard aircraft in their baggage or offer for transport. Occasionally, unscrupulous persons may choose to illegally ship forbidden hazardous materials. Additional restrictions on the carriage of hazardous materials by air and improved training for air crew members, passengers, shippers and loaders may help to prevent future incidents. Other accident prevention regulations deal with oxygen supply, crew meals and procedures in case of illness.
Diseases
Specific occupational disease of crew members are not known or documented. However, certain diseases may be more prevalent among crew members than among persons in other occupations. Common colds and upper respiratory system infections are frequent; this may be due in part to the low humidity during flight, irregularities of schedules, exposure to att large number of people in a confined space and so on. A common cold, especially with upper respiratory congestion, that is not significant for an office worker may incapacitate a crew member if it prevents the clearing of pressure on the middle ear during ascent and, particularly, during descent. Additionally, illnesses that require some form of drug therapy may also preclude the crew member from engaging in work for a period of time. Frequent travel to tropical areas may also entail increased exposure to infectious diseases, the most important being malaria and infections of the digestive system.
The close confines of an aircraft for extended periods of time also carry an excess risk of airborne infectious diseases like tuberculosis, if a passenger or crew member has such a disease in its contagious stage.
Aircraft Maintenance Operations
Aircraft maintenance operations are broadly distributed within and across nations and are performed by both military and civilian mechanics. Mechanics work at airports, maintenance bases, private fields, military installations and aboard aircraft carriers. Mechanics are employed by passenger and freight carriers, by maintenance contractors, by operators of private fields, by agricultural operations and by public and private fleet owners. Small airports may provide employment for a few mechanics, while major hub airports and maintenance bases may employ thousands. Maintenance work is divided between that which is necessary to maintain ongoing daily operations (line maintenance) and those procedures that periodically check, maintain and refurbish the aircraft (base maintenance). Line maintenance comprises en route (between landing and takeoff) and overnight maintenance. En route maintenance consists of operational checks and flight-essential repairs to address discrepancies noted during flight. These repairs are typically minor, such as replacing warning lights, tyres and avionic components, but may be as extensive as replacing an engine. Overnight maintenance is more extensive and includes making any repairs deferred during the day’s flights.
The timing, distribution and nature of aircraft maintenance is controlled by each airline company and is documented in its maintenance manual, which in most jurisdictions must be submitted for approval to the appropriate aviation authority. Maintenance is performed during regular checks, designated as A through D checks, specified by the maintenance manual. These scheduled maintenance activities ensure that the entire aircraft has been inspected, maintained and refurbished at appropriate intervals. Lower level maintenance checks may be incorporated into line maintenance work, but more extensive work is performed at a maintenance base. Aircraft damage and component failures are repaired as required.
Line Maintenance Operations and Hazards
En route maintenance is typically performed under a great time constraint at active and crowded flight lines. Mechanics are exposed to prevailing conditions of noise, weather and vehicular and aircraft traffic, each of which may amplify the hazards intrinsic to maintenance work. Climatic conditions may include extremes of cold and heat, high winds, rain, snow and ice. Lightning is a significant hazard in some areas.
Although the current generation of commercial aircraft engines are significantly quieter than previous models, they can still produce sound levels well above those set by regulatory authorities, particularly if the aircraft are required to use engine power in order to exit gate positions. Older jet and turboprop engines can produce sound level exposures in excess of 115 dBA. Aircraft auxiliary-power units (APUs), ground-based power and air-conditioning equipment, tugs, fuel trucks and cargo-handling equipment add to the background noise. Noise levels in the ramp or aircraft parking area are seldom below 80 dBA, thus necessitating the careful selection and routine use of hearing protectors. Protectors must be selected that provide excellent noise attenuation while being reasonably comfortable and permitting essential communication. Dual systems (ear plugs plus ear muffs) provide enhanced protection and allow accom-modation for higher and lower noise levels.
Mobile equipment, in addition to aircraft, may include baggage carts, personnel buses, catering vehicles, ground support equipment and jetways. To maintain departure schedules and customer satisfaction, this equipment must move quickly within often congested ramp areas, even under adverse ambient conditions. Aircraft engines pose the danger of ramp personel being ingested into jet engines or being struck by a propeller or exhaust blasts. Reduced visibility during night and inclement weather increase the risk that mechanics and other ramp personnel might be struck by mobile equipment. Reflective materials on work clothing help to improve visibility, but it is essential that all ramp personnel be well trained in ramp traffic rules, which must be rigorously enforced. Falls, the most frequent cause of serious injuries among mechanics, are discussed elsewhere in this Encyclopaedia.
Chemical exposures in the ramp area include de-icing fluids (usually containing ethylene or propylene glycol), oils and lubricants. Kerosene is the standard commercial jet fuel (Jet A). Hydraulic fluids containing tributyl phosphate cause severe but transient eye irritation. Fuel tank entry, while relatively rare on the ramp, must be included in a comprehensive confined- space-entry programme. Exposure to resin systems used for patching composite areas such as cargo hold panelling may also occur.
Overnight maintenance is typically performed under more controlled circumstances, either in line-service hangers or on inactive flight lines. Lighting, work stands and traction are far better than on the flight line but are likely to be inferior to those found in maintenance bases. Several mechanics may be working on an aircraft simultaneously, necessitating careful planning and coordination to control personnel movement, aircraft component activation (drives, flight control surfaces and so on) and chemical usage. Good housekeeping is essential to prevent clutter from air lines, parts and tools, and to clean spills and drips. These requirements are of even greater importance during base maintenance.
Base Maintenance Operations and Hazards
Maintenance hangars are very large structures capable of accommodating numerous aircraft. The largest hangars can simultaneously accommodate several wide-body aircraft, such as the Boeing 747. Separate work areas, or bays, are assigned to each aircraft undergoing maintenance. Specialized shops for the repair and refitting of components are associated with the hangars. Shop areas typically include sheet metal, interiors, hydraulics, plastics, wheels and brakes, electrical and avionics and emergency equipment. Separate welding areas, paint shops and non-destructive testing areas may be established. Parts-cleaning operations are likely to be found throughout the facility.
Paint hangars with high ventilation rates for workplace air contaminant controls and environmental pollution protection should be available if painting or paint stripping is to be performed. Paint strippers often contain methylene chloride and corrosives, including hydrofluoric acid. Aircraft primers typically contain a chromate component for corrosion protection. Top coats may be epoxy or polyurethane based. Toluene diisocyanate (TDI) is now seldom used in these paints, having been replaced with higher molecular weight isocyanates such as 4,4-diphenylmethane diisocyanate (MDI) or by prepolymers. These still present a risk of asthma if inhaled.
Engine maintenance may be performed within the maintenance base, at a specialized engine overhaul facility or by a sub-contractor. Engine overhaul requires the use of metalworking techniques including grinding, blasting, chemical cleaning, plating and plasma spray. Silica has in most cases been replaced with less hazardous materials in parts cleaners, but the base materials or coatings may create toxic dusts when blasted or ground. Numerous materials of worker health and environmental concern are used in metal cleaning and plating. These include corrosives, organic solvents and heavy metals. Cyanide is generally of the greatest immediate concern, requiring special emphasis in emergency preparedness planning. Plasma spray operations also merit particular attention. Finely divided metals are fed into a plasma stream generated using high-voltage electrical sources and plated onto parts with the concomitant generation of very high noise levels and light energies. Physical hazards include work at height, lifting and work in uncomfortable positions. Precautions include local exhaust ventilation, PPE, fall protection, training in proper lifting and use of mechanized lifting equipment when possible and ergonomic redesign. For example, repetitive motions involved in tasks such as wire tying may be reduced by use of specialized tools.
Military and Agricultural Applications
Military aircraft operations may present unique hazards. JP4, a more volatile jet fuel that Jet A, may be contaminated with n-hexane. Aviation gasoline, used in some propeller-driven aircraft, is highly flammable. Military aircraft engines, including those on transport aircraft, may use less noise abatement than those on commercial aircraft and may be augmented by afterburners. Aboard aircraft carriers the many hazards are significantly increased. Engine noise is augmented by steam catapults and afterburners, flight deck space is extremely limited, and the deck itself is in motion. Because of combat demands, asbestos insulation is present in some cockpits and around hot areas.
The need for lowered radar visibility (stealth) has resulted in the increased use of composite materials on fuselage, wings and flight control structures. These areas may be damaged in combat or from exposure to extremes of climate, requiring extensive repair. Repairs performed under field conditions may result in heavy exposures to resins and composite dusts. Beryllium is also common in military applications. Hydrazide may be present as part of auxiliary-power units, and anti-tank armament may include radioactive depleted uranium rounds. Precautions include appropriate PPE, including respiratory protection. Where possible, portable exhaust systems should be used.
Maintenance work on agricultural aircraft (crop dusters) may result in exposures to pesticides either as a single product or, more likely, as a mixture of products contaminating a single or multiple aircraft. Degradation products of some pesticides are more hazardous than the parent product. Dermal routes of exposure may be significant and may be enhanced by perspiration. Agricultural aircraft and external parts should be thoroughly cleaned before repair, and/or PPE, including skin and respiratory protection, should be used.
" DISCLAIMER: The ILO does not take responsibility for content presented on this web portal that is presented in any language other than English, which is the language used for the initial production and peer-review of original content. Certain statistics have not been updated since the production of the 4th edition of the Encyclopaedia (1998)."