- You are here:
-
Home

- k2 Feed
Skin Problems
The first reports of skin complaints among people working with or near VDUs came from Norway as early as 1981. A few cases have also been reported from the United Kingdom, the United States and Japan. Sweden, however, has provided many case reports and public discussion on the health effects of exposure to VDUs was intensified when one case of skin disease in a VDU worker was accepted as an occupational disease by the Swedish National Insurance Board in late 1985. The acceptance of this case for compensation coincided with a marked increase in the number of cases of skin disease that were suspected to be related to work with VDUs. At the Department of Occupational Dermatology at Karolinska Hospital, Stockholm, the caseload increased from seven cases referred between 1979 and 1985, to 100 new referrals from November 1985 to May 1986.
Despite the relatively large number of people who sought medical treatment for what they believed to be VDU-related skin problems, no conclusive evidence is available which shows that the VDUs themselves lead to the development of occupational skin disease. The occurrence of skin disease in VDU-exposed people appears to be coincidental or possibly related to other workplace factors. Evidence for this conclusion is strengthened by the observation that the increased incidence of skin complaints made by Swedish VDU workers has not been observed in other countries, where the mass media debate on the issue has not been as intense. Further, scientific data collected from provocation studies, in which patients have been purposely exposed to VDU-related electromagnetic fields to determine whether a skin effect could be induced, have not produced any meaningful data demonstrating a possible mechanism for development of skin problems which could be related to the fields surrounding a VDU.
Case Studies: Skin Problems and VDUs
Sweden: 450 patients were referred and examined for skin problems which they attributed to work at VDUs. Only common facial dermatoses were found and no patients had specific dermatoses that could be related to work with VDUs. While most patients felt that they had pronounced symptoms, their visible skin lesions were, in fact, mild according to standard medical definitions and most of the patients reported improvement without drug therapy even though they continued to work with VDUs . Many of the patients were suffering from identifiable contact allergies, which explained their skin symptoms . Epidemiological studies comparing the VDU-work patients to a non-exposed control population with a similar skin status showed no relationship between skin status and VDU work. Finally, a provocation study did not yield any relation between the patient symptoms and electrostatic or magnetic fields from the VDUs (Wahlberg and Lidén 1988; Berg 1988; Lidén 1990; Berg, Hedblad and Erhardt 1990; Swanbeck and Bleeker 1989).In contrast to a few early nonconclusive epidemiological studies (Murray et al. 1981; Frank 1983; Lidén and Wahlberg 1985), a large-scale epidemiological study (Berg, Lidén, and Axelson 1990; Berg 1989) of 3,745 randomly selected office employees, of whom 809 persons were medically examined, showed that while the VDU-exposed employees reported significantly more skin problems than a nonexposed control population of office employees, upon examination, they were not actually found to have no more visible signs or more skin disease.
Wales (UK): A questionnaire study found no difference between reports of skin problems in VDU workers and a control population (Carmichael and Roberts 1992).
Singapore: A control population of teachers reported significantly more skin complaints than did the VDU users (Koh et al. 1991).
It is, however, possible that work-related stress could be an important factor that can explain VDU-associated skin complaints. For example, follow-up studies in the office environment of a subgroup of the VDU-exposed office employees being studied for skin problems showed that significantly more people in the group with skin symptoms experienced extreme occupational stress than people without the skin symptoms. A correlation between levels of the stress-sensitive hormones testosterone, prolactin and thyroxin and skin symptoms were observed during work, but not during days off. Thus, one possible explanation for VDU-associated facial skin sensations could be the effects of thyroxin, which causes the blood vessels to dilate (Berg et al. 1992).
Musculoskeletal Disorders
Introduction
VDU operators commonly report musculoskeletal problems in the neck, shoulders and upper limbs. These problems are not unique to VDU operators and are also reported by other workers performing tasks which are repetitive or which involve holding the body in a fixed posture (static load). Tasks which involve force are also commonly associated with musculoskeletal problems, but such tasks are not generally an important health and safety consideration for VDU operators.
Among clerical workers, whose jobs are generally sedentary and not commonly associated with physical stress, the introduction into workplaces of VDUs caused work-related musculoskeletal problems to gain in recognition and prominence. Indeed, an epidemic-like increase in reporting of problems in Australia in the mid 1980s and, to a lesser extent, in the United States and the United Kingdom in the early 1990s, has led to a debate about whether or not the symptoms have a physiological basis and whether or not they are work-related.
Those who dispute that musculoskeletal problems associated with VDU (and other) work have a physiological basis generally put forward one of four alternative views: workers are malingering; workers are unconsciously motivated by various possible secondary gains, such as workers’ compensation payments or the psychological benefits of being sick, known as compensation neurosis; workers are converting unresolved psychological conflict or emotional disturbance into physical symptoms, that is, conversion disorders; and finally, that normal fatigue is being blown out of proportion by a social process which labels such fatigue as a problem, termed social iatrogenesis. Rigorous examination of the evidence for these alternative explanations shows that they are not as well supported as explanations which posit a physiological basis for these disorders (Bammer and Martin 1988). Despite the growing evidence that there is a physiological basis for musculoskeletal complaints, the exact nature of the complaints is not well understood (Quintner and Elvey 1990; Cohen et al. 1992; Fry 1992; Helme, LeVasseur and Gibson 1992).
Symptom Prevalence
A large number of studies have documented the prevalence of musculoskeletal problems among VDU operators and these have been predominantly conducted in western industrialized countries. There is also growing interest in these problems in the rapidly industrializing nations of Asia and Latin America. There is considerable inter-country variation in how musculoskeletal disorders are described and in the types of studies carried out. Most studies have relied on symptoms reported by workers, rather than on the results of medical examinations. The studies can be usefully divided into three groups: those which have examined what can be called composite problems, those which have looked at specific disorders and those which have concentrated on problems in a single area or small group of areas.
Composite problems
Composite problems are a mixture of problems, which can include pain, loss of strength and sensory disturbance, in various parts of the upper body. They are treated as a single entity, which in Australia and the United Kingdom is referred to as repetitive strain injuries (RSI), in the United States as cumulative trauma disorders (CTD) and in Japan as occupational cervicobrachial disorders (OCD). A 1990 review (Bammer 1990) of problems among office workers (75% of the studies were of office workers who used VDUs) found that 70 studies had examined composite problems and 25 had found them to occur in a frequency range of between 10 and 29% of the workers studied. At the extremes, three studies had found no problems, while three found that 80% of workers suffer from musculoskeletal complaints. Half of the studies also reported on severe or frequent problems, with 19 finding a prevalence between 10 and 19%. One study found no problems and one found problems in 59%. The highest prevalences were found in Australia and Japan.
Specific disorders
Specific disorders cover relatively well-defined problems such as epicondylitis and carpal tunnel syndrome. Specific disorders have been less frequently studied and found to occur less frequently. Of 43 studies, 20 found them to occur in between 0.2 and 4% of workers. Five studies found no evidence of specific disorders and one found them in between 40–49% of workers.
Particular body parts
Other studies focus on particular areas of the body, such as the neck or the wrists. Neck problems are the most common and have been examined in 72 studies, with 15 finding them to occur in between 40 and 49% of workers. Three studies found them to occur in between 5 and 9% of workers and one found them in more than 80% of workers. Just under half the studies examined severe problems and they were commonly found in frequencies that ranged between 5% and 39%. Such high levels of neck problems have been found internationally, including Australia, Finland, France, Germany, Japan, Norway, Singapore, Sweden, Switzerland, the United Kingdom and the United States. In contrast, only 18 studies examined wrist problems, and seven found them to occur in between 10% and 19% of workers. One found them to occur in between 0.5 and 4% of workers and one in between 40% and 49%.
Causes
It is generally agreed that the introduction of VDUs is often associated with increased repetitive movements and increased static load through increased keystroke rates and (compared with typewriting) reduction in non-keying tasks such as changing paper, waiting for the carriage return and use of correction tape or fluid. The need to watch a screen can also lead to increased static load, and poor placement of the screen, keyboard or function keys can lead to postures which may contribute to problems. There is also evidence that the introduction of VDUs can be associated with reductions in staff numbers and increased workloads. It can also lead to changes in the psychosocial aspects of work, including social and power relationships, workers’ responsibilities, career prospects and mental workload. In some workplaces such changes have been in directions which are beneficial to workers.
In other workplaces they have led to reduced worker control over the job, lack of social support on the job, “de-skilling”, lack of career opportunities, role ambiguity, mental stress and electronic monitoring (see review by Bammer 1987b and also WHO 1989 for a report on a World Health Organization meeting). The association between some of these psychosocial changes and musculoskeletal problems is outlined below. It also seems that the introduction of VDUs helped stimulate a social movement in Australia which led to the recognition and prominence of these problems (Bammer and Martin 1992).
Causes can therefore be examined at individual, workplace and social levels. At the individual level, the possible causes of these disorders can be divided into three categories: factors not related to work, biomechanical factors and work organization factors (see table 1). Various approaches have been used to study causes but the overall results are similar to those obtained in empirical field studies which have used multivariate analyses (Bammer 1990). The results of these studies are summarized in table 1 and table 2. More recent studies also support these general findings.
Table 1. Summary of empirical fieldwork studies which have used multivariate analyses to study the causes of musculoskeletal problems among office workers
|
Factors |
||||
|
|
|
|
|
Work organisation |
|
Blignault (1985) |
146/90% |
ο |
ο |
● |
|
South Australian Health Commission Epidemiology Branch (1984) |
456/81% |
●
|
●
|
●
|
|
Ryan, Mullerworth and Pimble (1984) |
52/100% |
● |
●
|
●
|
|
Ryan and |
143 |
|||
|
Ellinger et al. (1982) |
280 |
● |
●
|
● |
|
Pot, Padmos and |
222/100% |
not studied |
● |
● |
|
Sauter et al. (1983b) |
251/74% |
ο |
●
|
● |
|
Stellman et al. (1987a) |
1, 032/42% |
not studied |
●
|
● |
ο = non-factor ●= factor.
Source: Adapted from Bammer 1990.
Table 2. Summary of studies showing involvement of factors thought to cause musculoskeletal problems among office workers
|
Non-work |
Biomechanical |
Work organization |
|||||||||||||
|
Country |
No./% VDU |
Age |
Biol. |
Neuro ticism |
Joint |
Furn. |
Furn. |
Visual |
Visual |
Years |
Pressure |
Autonomy |
Peer |
Variety |
Key- |
|
Australia |
146/ |
Ø |
Ø |
Ø |
Ø |
Ο |
● |
● |
● |
Ø |
|||||
|
Australia |
456/ |
● |
Ο |
❚ |
Ø |
Ο |
● |
Ο |
|||||||
|
Australia |
52/143/ |
▲ |
❚ |
❚ |
Ο |
Ο |
● |
Ο |
|||||||
|
Germany |
280 |
Ο |
Ο |
❚ |
Ø |
❚ |
Ο |
Ο |
● |
● |
Ο |
||||
|
Netherlands |
222/ |
❚ |
❚ |
Ø |
Ø |
Ο |
● |
(Ø) |
Ο |
||||||
|
United States |
251/ |
Ø |
Ø |
❚ |
❚ |
Ο |
● |
(Ø) |
●
|
||||||
|
United States |
1,032/ |
Ø |
❚ |
❚ |
Ο |
● |
● |
||||||||
Ο = positive association, statistically significant. ● = negative association, statistically significant. ❚ = statistically significant association. Ø = no statistically significant association. (Ø) = no variability in the factor in this study. ▲ = the youngest and the oldest had more symptoms.
Empty box implies that the factor was not included in this study.
1 Matches references in table 52.7.
Source: adapted from Bammer 1990.
Factors not related to work
There is very little evidence that factors not related to work are important causes of these disorders, although there is some evidence that people with a previous injury to the relevant area or with problems in another part of the body may be more likely to develop problems. There is no clear evidence for involvement of age and the one study which examined neuroticism found that it was not related.
Biomechanical factors
There is some evidence that working with certain joints of the body at extreme angles is associated with musculoskeletal problems. The effects of other biomechanical factors are less clear-cut, with some studies finding them to be important and others not. These factors are: assessment of the adequacy of the furniture and/or equipment by the investigators; assessment of the adequacy of the furniture and/or equipment by the workers; visual factors in the workplace, such as glare; personal visual factors, such as the use of spectacles; and years on the job or as an office worker (table 2).
Organizational factors
A number of factors related to work organization are clearly associated with musculoskeletal problems and are discussed more fully elsewhere is this chapter. Factors include: high work pressure, low autonomy (i.e., low levels of control over work), low peer cohesion (i.e., low levels of support from other workers) which may mean that other workers cannot or do not help out in times of pressure, and low task variety.
The only factor which was studied for which results were mixed was hours using a keyboard (table 2). Overall it can be seen that the causes of musculoskeletal problems on the individual level are multifactorial. Work-related factors, particularly work organization, but also biomechanical factors, have a clear role. The specific factors of importance may vary from workplace to workplace and person to person, depending on individual circumstances. For example, the large-scale introduction of wrist rests into a workplace when high pressure and low task variety are hallmarks is unlikely to be a successful strategy. Alternatively, a worker with satisfactory delineation and variety of tasks may still develop problems if the VDU screen is placed at an awkward angle.
The Australian experience, where there was a decline in prevalence of reporting of musculoskeletal problems in the late 1980s, is instructive in indicating how the causes of these problems can be dealt with. Although this has not been documented or researched in detail, it is likely that a number of factors were associated with the decline in prevalence. One is the widespread introduction into workplaces of “ergonomically” designed furniture and equipment. There were also improved work practices including multiskilling and restructuring to reduce pressure and increase autonomy and variety. These often occurred in conjunction with the implementation of equal employment opportunity and industrial democracy strategies. There was also widespread implementation of prevention and early intervention strategies. Less positively, some workplaces seem to have increased their reliance on casual contract workers for repetitive keyboard work. This means that any problems would not be linked to the employer, but would be solely the worker’s responsibility.
In addition, the intensity of the controversy surrounding these problems led to their stigmatization, so that many workers have become more reluctant to report and claim compensation when they develop symptoms. This was further exacerbated when workers lost cases brought against employers in well-publicized legal proceedings. A decrease in research funding, cessation in publication of incidence and prevalence statistics and of research papers about these disorders, as well as greatly reduced media attention to the problem all helped shape a perception that the problem had gone away.
Conclusion
Work-related musculoskeletal problems are a significant problem throughout the world. They represent enormous costs at the individual and social levels. There are no internationally accepted criteria for these disorders and there is a need for an international system of classification. There needs to be an emphasis on prevention and early intervention and this needs to be multifactorial. Ergonomics should be taught at all levels from elementary school to university and there need to be guidelines and laws based on minimum requirements. Implementation requires commitment from employers and active participation from employees (Hagberg et al. 1993).
Despite the many recorded cases of people with severe and chronic problems, there is little available evidence of successful treatments. There is also little evidence of how rehabilitation back into the workforce of workers with these disorders can be most successfully undertaken. This highlights that prevention and early intervention strategies are paramount to the control of work-related musculoskeletal problems.
Reproductive Effects - Human Evidence
The safety of visual display units (VDUs) in terms of reproductive outcomes has been questioned since the widespread introduction of VDUs in the work environment during the 1970s. Concern for adverse pregnancy outcomes was first raised as a result of numerous reports of apparent clusters of spontaneous abortion or congenital malformations among pregnant VDU operators (Blackwell and Chang 1988). While these reported clusters were determined to be no more than what could be expected by chance, given the widespread use of VDUs in the modern workplace (Bergqvist 1986), epidemiologic studies were undertaken to explore this question further.
From the published studies reviewed here, a safe conclusion would be that, in general, working with VDUs does not appear to be associated with an excess risk of adverse pregnancy outcomes. However, this generalized conclusion applies to VDUs as they are typically found and used in offices by female workers. If, however, for some technical reason, there existed a small proportion of VDUs which did induce a strong magnetic field, then this general conclusion of safety could not be applied to that special situation since it is unlikely that the published studies would have had the statistical ability to detect such an effect. In order to be able to have generalizable statements of safety, it is essential that future studies be carried out on the risk of adverse pregnancy outcomes associated with VDUs using more refined exposure measures.
The most frequently studied reproductive outcomes have been:
- Spontaneous abortion (10 studies): usually defined as a hospitalized unintentional cessation of pregnancy occurring before 20 weeks of gestation.
- Congenital malformation (8 studies): many different types were assessed, but in general, they were diagnosed at birth.
- Other outcomes (8 studies) such as low birthweight (under 2,500 g), very low birthweight (under 1,500 g), and fecundability (time to pregnancy from cessation of birth control use) have also been assessed. See table 1.
Table 1. VDU use as a factor in adverse pregnancy outcomes
|
Objectives |
Methods |
Results |
|||||
|
Study |
Outcome |
Design |
Cases |
Controls |
Exposure |
OR/RR (95% CI) |
Conclusion |
|
Kurppa et al. |
Congenital malformation |
Case-control |
1, 475 |
1, 475 same age, same delivery date |
Job titles, |
235 cases, |
No evidence of increased risk among women who reported exposure to VDU or among women whose job titles indicated possible exposure |
|
Ericson and Källén (1986) |
Spontaneous abortion, |
Case-case |
412 |
1, 032 similar age and from same registry |
Job titles |
1.2 (0.6-2.3) |
The effect of VDU use was not statistically significant |
|
Westerholm and Ericson |
Stillbirth, |
Cohort |
7 |
4, 117 |
Job titles |
1.1 (0.8-1.4) |
No excesses were found for any of the studied outcomes. |
|
Bjerkedal and Egenaes (1986) |
Stillbirth, |
Cohort |
17 |
1, 820 |
Employment records |
NR(NS) |
The study concluded that there was no indication that introduction of VDUs in the centre has led to any increase in the rate of adverse pregnancy outcomes. |
|
Goldhaber, Polen and Hiatt |
Spontaneous abortion, |
Case-control |
460 |
1, 123 20% of all normal births, same region, same time |
Postal questionnaire |
1.8 (1.2-2.8) |
Statistically increased risk for spontaneous abortions for VDU exposure. No excess risk for congenital malformations associates with VDU exposure. |
|
McDonald et al. (1988) |
Spontaneous abortion, |
Cohort |
776 |
Face-to-face interviews |
1.19 (1.09-1.38) |
No increase in risk was found among women exposed to VDUs. |
|
|
Nurminen and Kurppa (1988) |
Threatened abortion, |
Cohort |
239 |
Face-to-face interviews |
0.9 |
The crude and adjusted rate ratios did not show statistically significant effects for working with VDUs. |
|
|
Bryant and Love (1989) |
Spontaneous abortion |
Case-control |
344 |
647 |
Face-to-face interviews |
1.14 (p = 0.47) prenatal |
VDU use was similar between the cases and both the prenatal controls and postnatal controls. |
|
Windham et al. (1990) |
Spontaneous abortion, |
Case-control |
626 |
1,308 same age, same last menstrual period |
Telephone interviews |
1.2 (0.88-1.6) |
Crude odds ratios for spontaneous abortion and VDU use less than 20 hours per week were 1.2; 95% CI 0.88-1.6, minimum of 20 hours per week were 1.3; 95% CI 0.87-1.5. Risks for low birthweight and intra-uterine growth retardation were not significantly elevated. |
|
Brandt and |
Congenital malformation |
Case-control |
421 |
1,365; 9.2% of all pregnancies, same registry |
Postal questionnaire |
0.96 (0.76-1.20) |
Use of VDUs during pregnancy was not associated with a risk of congenital malformations. |
|
Nielsen and |
Spontaneous abortion |
Case-control |
1,371 |
1,699 9.2% |
Postal questionnaire |
0.94 (0.77-1.14) |
No statistically significant risk for spontaneous abortion with VDU exposure. |
|
Tikkanen and Heinonen |
Cardiovascular malformations |
Case-control |
573 |
1,055 same time, hospital delivery |
Face-to-face interviews |
Cases 6.0%, controls 5.0% |
No statistically significant association between VDU use and cardiovascular malformation |
|
Schnorr et al. |
Spontaneous abortion |
Cohort |
136 |
746 |
Company records measurement of magnetic field |
0.93 (0.63-1.38) |
No excess risk for women who used VDUs during first trimester and no apparent |
|
Brandt and |
Time to pregnancy |
Cohort |
188 |
Postal questionnaire |
1.61 (1.09-2.38) |
For a time to pregnancy of greater than 13 months, there was an increased relative risk for the group with at least 21 hours of weekly VDU use. |
|
|
Nielsen and |
Low birthweight, |
Cohort |
434 |
Postal questionnaire |
0.88 (0.67-1.66) |
No increase in risk was found among women exposed to VDUs. |
|
|
Roman et al. |
Spontaneous abortion |
Case-control |
150 |
297 nulliparous hospital |
Face-to-face interviews |
0.9 (0.6-1.4) |
No relation to time spent using VDUs. |
|
Lindbohm |
Spontaneous abortion |
Case-control |
191 |
394 medical registers |
Employment records field measurement |
1.1 (0.7-1.6), |
Comparing workers with exposure to high magnetic field strengths to those with undetectable levels the ratio was 3.4 (95% CI 1.4-8.6) |
OR = Odds ratio. CI = Confidence Interval. RR = Relative risk. NR = Value not reported. NS = Not statistically significant.
Discussion
Evaluations of reported clusters of adverse pregnancy outcomes and VDU use have concluded that there was a high probability that these clusters occurred by chance (Bergqvist 1986). In addition, the results of the few epidemiologic studies which have assessed the relation between VDU use and adverse pregnancy outcomes have, on the whole, not shown a statistically significant increased risk.
In this review, out of ten studies of spontaneous abortion, only two found a statistically significant increased risk for VDU exposure (Goldhaber, Polen and Hiatt 1988; Lindbohm et al. 1992). None of the eight studies on congenital malformations showed an excess risk associated with VDU exposure. Of the eight studies which looked at other adverse pregnancy outcomes, one has found a statistically significant association between waiting time to pregnancy and VDU use (Brandt and Nielsen 1992).
Although there are no major differences between the three studies with positive findings and those with negative ones, improvements in exposure assessment may have increased the chances of finding a significant risk. Though not exclusive to the positive studies, these three studies attempted to divide the workers into different levels of exposure. If there is a factor inherent in VDU use which predisposes a woman to adverse pregnancy outcomes, the dose received by the worker may influence the outcome. In addition, the results of the studies by Lindbohm et al. (1992) and Schnorr et al. (1991) suggest that only a small proportion of the VDUs may be responsible for increasing the risk of spontaneous abortion among users. If this is the case, failure to identify these VDUs will introduce a bias that could lead to underestimating the risk of spontaneous abortion among VDU users.
Other factors associated with work on VDUs, such as stress and ergonomic constraints, have been suggested as possible risk factors for adverse pregnancy outcomes (McDonald et al. 1988; Brandt and Nielsen 1992). Failure of many studies to control for these possible confounders may have lead to unreliable results.
While it may be biologically plausible that exposure to high levels of extremely low frequency magnetic fields through some VDUs carries an increased risk for adverse pregnancy outcomes (Bergqvist 1986), only two studies have attempted to measure these (Schnorr et al. 1991; Lindbohm et al. 1992). Extremely low frequency magnetic fields are present in any environment where electricity is used. A contribution of these fields to adverse pregnancy outcomes could only be detected if there was a variation, in time or in space, of these fields. While VDUs contribute to the overall levels of magnetic fields in the workplace, only a small percentage of the VDUs are thought to have a strong influence on the magnetic fields measured in the working environment (Lindbohm et al. 1992). Only a fraction of the women working with VDUs are thought to be exposed to levels of magnetic radiation above that which is normally encountered in the working environment (Lindbohm et al. 1992). The lack of precision in exposure assessment encountered in counting all VDU users as “exposed” weakens the ability of a study to detect the influence of magnetic fields from VDUs on adverse pregnancy outcomes.
In some studies, women who are not gainfully employed represented a large proportion of the comparison groups for women exposed to VDUs. In this comparison, certain selective processes may have affected the results (Infante-Rivard et al. 1993); for instance, women with severe diseases are selected out of the workforce, leaving healthier women more likely to have favourable reproductive outcomes in the workforce. On the other hand, an “unhealthy pregnant worker effect” is also possible, since women who have children may stop work, whereas those without children and who experience pregnancy loss may continue working. A suggested strategy to estimate the magnitude of this bias is to do separate analyses with and without women not gainfully employed.
Reproductive Hazards - Experimental Data
The purpose of the experimental studies described here, using animal models is, in part, to answer the question as to whether extremely low frequency (ELF) magnetic field exposures at levels similar to those around VDU workstations can be shown to affect reproductive functions in animals in a manner that can be equated to a human health risk.
The studies considered here are limited to in vivo studies (those performed on live animals) of reproduction in mammals exposed to very low frequency (VLF) magnetic fields with appropriate frequencies, excluding, therefore, studies on the biological effects in general of VLF or ELF magnetic fields. These studies on experimental animals fail to demonstrate unequivocally that magnetic fields, such as are found around VDUs, affect reproduction. Moreover, as can be seen from considering the experimental studies described in some detail below, the animal data do not shed a clear light on possible mechanisms for human reproductive effects of VDU use. These data complement the relative absence of indications of a measurable effect of VDU use on reproductive outcomes from human population studies.
Studies of Reproductive Effects of VLF Magnetic Fields in Rodents
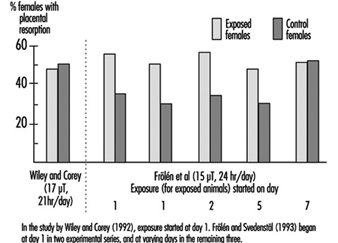
VLF magnetic fields similar to those around VDUs have been used in five teratological studies, three with mice and two with rats. The results of these studies are summarized in table 1. Only one study (Tribukait and Cekan 1987), found an increased number of foetuses with external malformations. Stuchly et al. (1988) and Huuskonen, Juutilainen and Komulainen (1993) both reported a significant increase in the number of foetuses with skeletal abnormalities, but only when the analysis was based on the foetus as a unit. The study by Wiley and Corey (1992) did not demonstrate any effect of magnetic field exposures on placental resorption, or other pregnancy outcomes. Placental resorptions roughly correspond to spontaneous abortions in humans. Finally, Frölén and Svedenstål (1993) performed a series of five experiments. In each experiment, the exposure occurred on a different day. Among the first four experimental subgroups (start day 1–start day 5), there were significant increases in the number of placental resorptions among exposed females. No such effects were seen in the experiment where exposure started on day 7 and which is illustrated in figure 1.
Table 1. Teratological studies with rats or mice exposed to 18-20 kHz saw-tooth formed magnetic fields
|
Magnetic field exposure |
|||||
|
Study |
Subject1 |
Frequency |
Amplitude2 |
Duration3 |
Results4 |
|
Tribukait and Cekan (1987) |
76 litters of mice |
20 kHz |
1 μT, 15 μT |
Exposed to day 14 of pregnancy |
Significant increase in external malformation; only if foetus is used as the unit of observation; and only in the first half of the experiment; no difference as to resorption or foetal death. |
|
Stuchly et al. |
20 litters of rats |
18 kHz |
5.7μT, 23μT, |
Exposed throughout |
Significant increase in minor skeletal malformations; only if foetus is used as the unit of observation; some decrease in blood cell concentrations no difference as to resorption, nor as to other types of malformations |
|
Wiley and Corey |
144 litters of |
20 kHz |
3.6 μT, 17μT, |
Exposed throughout |
No difference as to any observed outcome (malformation, |
|
Frölén and |
In total 707 |
20 kHz |
15 μT |
Beginning on various days of pregnancy in |
Significant increase in resorption; only if exposure starts on day 1 to day 5; no difference as to malformations |
|
Huuskonen, |
72 litters of rats |
20 kHz |
15 μT |
Exposed to day 12 of pregnancy |
Significant increase in minor skeletal malformations; only if foetus is used as the unit of observation; no difference as to |
1 Total number of litters in the maximum exposure category.
2 Peak-to-peak amplitude.
3 Exposure varied from 7 to 24 hours/day in different experiments.
4 “Difference” refers to statistical comparisons between exposed and unexposed animals, “increase” refers to a comparison of the highest exposed group vs. the unexposed group.
Figure 1. The percentage of female mice with placental resorptions in relation to exposure
The interpretations given by the researchers to their findings include the following. Stuchly and co-workers reported that the abnormalities they observed were not unusual and ascribed the result to “common noise that appears in every teratological evaluation”. Huuskonen et al., whose findings were similar to Stuchly et al., were less negative in their appraisal and considered their result to be more indicative of a real effect, but they too remarked in their report that the abnormalities were “subtle and would probably not impair the later development of the foetuses”. In discussing their findings in which effects were observed in the early onset exposures but not the later ones, Frölén and Svedenstål suggest that the effects observed could be related to early effects on reproduction, before the fertilized egg is implanted in the uterus.
In addition to the reproductive outcomes, a decrease in white and red blood cells were noted in the highest exposure group in the study by Stuchly and co-workers. (Blood cell counts were not analysed in the other studies.) The authors, while suggesting that this could indicate a mild effect of the fields, also noted that the variations in blood cell counts were “within the normal range”. The absence of histological data and the absence of any effects on bone marrow cells made it difficult to evaluate these latter findings.
Interpretation and comparison of studies
Few of the results described here are consistent with one another. As stated by Frölén and Svedenstål, “qualitative conclusions with regard to corresponding effects in human beings and test animals may not be drawn”. Let us examine some of the reasoning that could lead to such a conclusion.
The Tribukait findings are generally not considered to be conclusive for two reasons. First, the experiment only yielded positive effects when the foetus was used as the unit of observation for statistical analysis, whereas the data themselves actually indicated a litter-specific effect. Second, there is a discrepancy in the study between the findings in the first and the second part, which implies that the positive findings may be the result of random variations and/or uncontrolled factors in the experiment.
Epidemiological studies investigating specific malformations have not observed an increase in skeletal malformations among children born of mothers working with VDUs—and thus exposed to VLF magnetic fields. For these reasons (foetus-based statistical analysis, abnormalities probably not health-related, and lack of concordance with epidemiological findings), the results—on minor skeletal malformations—are not such as to provide a firm indication of a health risk for humans.
Technical Background
Units of observation
When statistically evaluating studies on mammals, consideration must be given to at least one aspect of the (often unknown) mechanism. If the exposure affects the mother—which in turn affects the foetuses in the litter, it is the status of the litter as a whole which should be used as the unit of observation (the effect which is being observed and measured), since the individual outcomes among litter-mates are not independent. If, on the other hand, it is hypothesized that the exposure acts directly and independently on the individual foetuses within the litter, then one can appropriately use the foetus as a unit for statistical evaluation. The usual practice is to count the litter as the unit of observation, unless evidence is available that the effect of the exposure on one foetus is independent of the effect on the other foetuses in the litter.
Wiley and Corey (1992) did not observe a placental resorption effect similar to that seen by Frölén and Svedenstål. One reason put forward for this discrepancy is that different strains of mice were used, and the effect could be specific for the strain used by Frölén and Svedenstål. Apart from such a speculated species effect, it is also noteworthy that both females exposed to 17 μT fields and controls in the Wiley study had resorption frequencies similar to those in exposed females in the corresponding Frölén series, whereas most non-exposed groups in the Frölén study had much lower frequencies (see figure 1). One hypothetical explanation could be that a higher stress level among the mice in the Wiley study resulted from the handling of animals during the three hour period without exposure. If this is the case, an effect of the magnetic field could perhaps have been “drowned” by a stress effect. While it is difficult to definitely dismiss such a theory from the data provided, it does appear somewhat far-fetched. Furthermore, a “real” effect attributable to the magnetic field would be expected to be observable above such a constant stress effect as the magnetic field exposure increased. No such trend was observed in the Wiley study data.
The Wiley study reports on environmental monitoring and on rotation of cages to eliminate the effects of uncontrolled factors which might vary within the room environment itself, as magnetic fields can, while the Frölén study does not. Thus, control of “other factors” is at least better documented in the Wiley study. Hypothetically, uncontrolled factors that were not randomized could conceivably offer some explanations. It is also interesting to note that the lack of effect observed in the day 7 series of the Frölén study appears to be due not to a decrease in the exposed groups, but to an increase in the control group. Thus variations in the control group are probably important to consider while comparing the disparate results of the two studies.
Studies of Reproductive Effects of ELF Magnetic Fields in Rodents
Several studies have been performed, mostly on rodents, with 50–80 Hz fields. Details on six of these studies are shown in table 2. While other studies of ELF have been carried out, their results have not appeared in the published scientific literature and are generally available only as abstracts from conferences. In general the findings are of “random effects”, “no differences observed” and so on. One study, however, found a reduced number of external abnormalities in CD–1 mice exposed to a 20 mT, 50 Hz field but the authors suggested that this might reflect a selection problem. A few studies have been reported on species other than rodents (rhesus monkeys and cows), again apparently without observations of adverse exposure effects.
Table 2. Teratological studies with rats or mice exposed to 15-60 Hz sinusoidal or square pulsed magnetic fields
|
Magnetic field exposure |
||||||
|
Study |
Subject1 |
Frequency |
Amplitude |
Description |
Exposure duration |
Results |
|
Rivas and Rius |
25 Swiss mice |
50 Hz |
83 μT, 2.3 mT |
Pulsed, 5 ms pulse duration |
Before and during pregnancy and offspring growth; total 120 days |
No significant differences at birth in any measured parameter; decreased male body weight when adult |
|
Zecca et al. (1985) |
10 SD rats |
50 Hz |
5.8 mT |
Day 6-15 of pregnancy, |
No significant differences |
|
|
Tribukait and Cekan (1987) |
35 C3H mice |
50 Hz |
1 μT, 15 μT |
Square wave-forms, 0.5 ms duration |
Day 0-14 of pregnancy, |
No significant differences |
|
Salzinger and |
41 off-springs of SD rats. Only male pups used |
60 Hz |
100 μT (rms). Also electric |
Uniform circular polarized |
Day 0-22 of pregnancy and |
Lower increase in operand response during training commencing at 90 days of age |
|
McGivern and |
11 offsprings of SD rats. Only male pups used. |
15 Hz |
800 μT (peak) |
Square wave-forms, 0.3 ms duration |
Day 15-20 of pregnancy, |
Territorial scent marking behaviour reduced at 120 days of age. |
|
Huuskonen et al. |
72 Wistar rats |
50 Hz |
12.6μT (rms) |
Sinusoidal |
Day 0-12 of pregnancy, |
More foetuses/litter. Minor skeletal malformations |
1 Number of animals (mothers) in the highest exposure category given unless otherwise noted.
As can be seen from table 2, a wide range of results were obtained. These studies are more difficult to summarize because there are so many variations in exposure regimens, the endpoints under study as well as other factors. The foetus (or the surviving, “culled” pup) was the unit used in most studies. Overall, it is clear that these studies do not show any gross teratogenic effect of magnetic field exposure during pregnancy. As remarked above, “minor skeletal anomalies” do not appear to be of importance when evaluating human risks. The behavioural study results of Salzinger and Freimark (1990) and McGivern and Sokol (1990) are intriguing, but they do not form a basis for indications of human health risks at a VDU workstation, either from the standpoint of procedures (use of the foetus, and, for McGivern, a different frequency) or of effects.
Summary of specific studies
Behavioural retardation 3–4 months after birth was observed in the offspring of exposed females by Salzinger and McGivern. These studies appear to have used individual offspring as the statistical unit, which may be questionable if the stipulated effect is due to an effect on the mother. The Salzinger study also exposed the pups during the first 8 days after birth, so that this study involved more than reproductive hazards. A limited number of litters was used in both studies. Furthermore, these studies cannot be considered to confirm each other’s findings since the exposures varied greatly between them, as can be seen in table 2.
Apart from a behavioural change in the exposed animals, the McGivern study noted an increased weight of some male sex organs: the prostate, the seminal vesicles and the epididymis (all parts of the male reproductive system). The authors speculate as to whether this could be linked to stimulation of some enzyme levels in the prostate since magnetic field effects on some enzymes present in the prostate have been observed for 60 Hz.
Huuskonen and co-workers (1993) noted an increase in the number of foetuses per litter (10.4 foetuses/litter in the 50 Hz exposed group vs. 9 foetuses/litter in the control group). The authors, who had not observed similar trends in other studies, downplayed the importance of this finding by noting that it “may be incidental rather than an actual effect of the magnetic field”. In 1985 Rivas and Rius reported a different finding with a slightly lower number of live births per litter among exposed versus nonexposed groups. The difference was not statistically significant. They carried out the other aspects of their analyses on both a “per foetus” and “per litter” basis. The noted increase in minor skeletal malformations was only seen with the analysis using the foetus as the unit of observation.
Recommendations and Summary
Despite the relative lack of positive, consistent data demonstrating either human or animal reproductive effects, attempts at replications of the results of some studies are still warranted. These studies should attempt to reduce the variations in exposures, methods of analysis and strains of animals used.
In general, the experimental studies performed with 20 kHz magnetic fields have provided somewhat varied results. If adhering strictly to the litter analysis procedure and statistical hypothesis testing, no effects have been shown in rats (although similar nonsignificant findings were made in both studies). In mice, the results have been varied, and no single coherent interpretation of them appears possible at present. For 50 Hz magnetic fields, the situation is somewhat different. Epidemiological studies which are relevant to this frequency are scarce, and one study did indicate a possible risk of miscarriage. By contrast, the experimental animal studies have not produced results with similar outcomes. Overall, the results do not establish an effect of extremely low frequency magnetic fields from VDUs on the outcome of pregnancies. The totality of results fails thus to suggest an effect of VLF or ELF magnetic fields from VDUs on reproduction.
Ocular and Visual Problems
There have been a comparatively large number of studies devoted to visual discomfort in visual display unit (VDU) workers, many of which have yielded contradictory results. From one survey to another, there are discrepancies in reported prevalence of disorders ranging from practically 0 per cent to 80 per cent or more (Dainoff 1982). Such differences should not be considered too surprising because they reflect the large number of variables which can influence complaints of eye discomfort or disability.
Correct epidemiological studies of visual discomfort must take into account several population variables, such as sex, age, eye deficiencies, or use of lenses, as well as socio-economic status. The nature of the job being carried out with the VDU and the characteristics of the workstation layout and of the work organization are also important and many of these variables are interrelated.
Most often, questionnaires have been used to assess the eye discomfort of VDU operators. The prevalence of visual discomfort differs thus with the content of questionnaires and their statistical analysis. Appropriate questions for surveys concern the extent of symptoms of distress asthenopia suffered by VDU operators. Symptoms of this condition are well known and can include itching, redness, burning and tearing of the eyes. These symptoms are related to the fatigue of the accommodative function in the eye. Sometimes this eye symptoms are accompanied by a headache, with the pain located in the front portion of the head. There may also be disturbances in eye function, with symptoms such as double vision and reduced accommodative power. Visual acuity, itself, however, is rarely depressed, provided the conditions of measurement are carried out with a constant pupil size.
If a survey includes general questions, such as “Do you feel well at the end of the working day?” or “Have you ever had visual problems when working with VDUs?” the prevalence of positive responses may be higher than when single symptoms related to asthenopia are evaluated.
Other symptoms may also be strongly associated to asthenopia. Pains in the neck, shoulders and arms are frequently found. There are two main reasons that these symptoms may occur together with eye symptoms. The muscles of the neck participate in keeping a steady distance between eye and screen in VDU work and VDU work has two main components: screen and keyboard, which means that the shoulders and arms and the eyes are all working at the same time and thus may be subject to similar work-related strains.
User Variables Related to Visual Comfort
Sex and Age
In the majority of surveys, women report more eye discomfort than men. In one French study, for example, 35.6% of women complained of eye discomfort, against 21.8% of men (p J 05 significance level) (Dorard 1988). In another study (Sjödren and Elfstrom 1990) it was observed that while the difference in the degree of discomfort between women (41%) and men (24%) was great, it “was more pronounced for those working 5-8 hours a day than for those working 1-4 hours a day”. Such differences are not necessarily sex-related, however, since women and men seldom share similar tasks. For example, in one computer plant studied, when women and men were both occupied in a traditional “woman’s job”, both sexes displayed the same amount of visual discomfort. Furthermore when women worked in traditional “men’s jobs”, they did not report more discomfort than men. In general, regardless of sex, the number of visual complaints among skilled workers who use VDUs on their jobs is much lower than the number of complaints from workers in unskilled, hectic jobs, such as data entry or word processing (Rey and Bousquet 1989). Some of these data are given in table 1.
Table 1. Prevalence of ocular symptoms in 196 VDU operators according to 4 categories
|
Categories |
Percentage of symptoms (%) |
|
Females in "female" jobs |
81 |
|
Males in "female" jobs |
75 |
|
Males in "male" jobs |
68 |
|
Females in "male" jobs |
65 |
Source: From Dorard 1988 and Rey and Bousquet 1989.
The highest number of visual complaints usually arise in the 40–50-year-old group, probably because this is the time when changes in accommodation ability of the eye are occurring rapidly. However, although older operators are perceived as having more visual complaints than younger workers, and, as a consequence, presbyopia (vision impairment due to ageing) is often cited as the main visual defect associated with visual discomfort at VDU workstations, it is important to consider that there is also a strong association between having acquired advanced skills in VDU work and age. There is usually a higher proportion of older women among unskilled female VDU operators, and younger male workers tend to more often be employed in skilled jobs. Thus before broad generalizations about age and visual problems associated with VDU can be made, the figures should be adjusted to take into account the comparative nature and skill level of the work being done at the VDU.
Eye defects and corrective lenses
In general, about half of all VDU operators display some kind of eye deficiency and most of these people use prescriptive lenses of one type or another. Often VDU user populations do not differ from the working population as far as eye defects and eye correction are concerned. For example, one survey (Rubino 1990) conducted among Italian VDU operators revealed that roughly 46% had normal vision and 38% were nearsighted (myopic), which is consistent with figures observed among Swiss and French VDU operators (Meyer and Bousquet 1990). Estimates of the prevalence of eye defects will vary according to the assessment technique used (Çakir 1981).
Most experts believe that presbyopia itself does not appear to have a significant influence on the incidence of asthenopia (persistent tiredness of the eyes). Rather, the use of unsuitable lenses appears to be likely to induce eye fatigue and discomfort. There is some disagreement about the effects in shortsighted young persons. Rubino has observed no effect while, according to Meyer and Bousquet (1990), myopic operators readily complain of undercorrection for the distance between eye and screen (usually 70 cm). Rubino also has proposed that people who suffer from a deficiency in eye coordination may be more likely to suffer from visual complaints in VDU work.
One interesting observation that resulted from a French study involving a thorough eye examination by ophthalmologists of 275 VDU operators and 65 controls was that 32% of those examined could have their vision improved by good correction. In this study 68% had normal vision, 24% were shortsighted and 8% farsighted (Boissin et al., 1991). Thus, although industrialized countries are, in general, well equipped to provide excellent eye care, eye correction is probably either completely neglected or inappropriate for those working at a VDU. An interesting finding in this study was that more cases of conjunctivitis were found in the VDU operators (48%) than in the controls. Since conjunctivitis and poor eyesight are correlated, this implies that better eye correction is needed.
Physical and Organizational Factors Affecting Visual Comfort
It is clear that in order to assess, correct and prevent visual discomfort in VDU work an approach which takes into account the many different factors described here and elsewhere in this chapter is essential. Fatigue and eye discomfort can be the result of individual physiological difficulties in normal accommodation and convergence in the eye, from conjunctivitis, or from wearing glasses that are poorly corrected for distance. Visual discomfort can be related to the workstation itself and can also be linked to work organization factors such as monotony and time spent on the job with and without a break. Inadequate lighting, reflections on screen, flicker and too much luminance of characters can also increase the risk of eye discomfort. Figure 1 illustrates some of these points.
Figure 1. Factors that increase the risk of eye fatigue among VDU workers

Many of the appropriate characteristics of workstation layout are described more fully earlier in the chapter.
The best viewing distance for visual comfort which still leaves enough space for the keyboard appears to be about 65 cm. However, according to many experts, such as Akabri and Konz (1991), ideally, “it would be best to determine an individual’s dark focus so workstations could be adjusted to specific individuals rather than population means”. As far as the characters themselves go, in general, a good rule of thumb is “bigger is better”. Usually, letter size increases with the size of the screen, and a compromise is always struck between the readability of letters and the number of words and sentences that can be displayed on the screen at one time. The VDU itself should be selected according to the task requirements and should try to maximize user comfort.
In addition to the design of the workstation and the VDU itself is the need to allow the eyes to rest. This is particularly important in unskilled jobs, in which the freedom of “moving around” is generally much lower than in skilled jobs. Data entry work or other activities of the same type are usually performed under time pressure, sometimes even accompanied by electronic supervision, which times operator output very precisely. In other interactive VDU jobs which involve using databases, operators are obliged to wait for a response from the computer and thus must remain at their posts.
Flicker and eye discomfort
Flicker is the change in brightness of the characters on the screen over time and is more fully described above. When characters do not refresh themselves frequently enough, some operators are able to perceive flicker. Younger workers may be more affected since their flicker fusion frequency is higher than that of older people (Grandjean 1987). The rate of flicker increases with increase in brightness, which is one reason why many VDU operators do not commonly make use of the whole range of brightness of the screen that are available. In general a VDU with a refresh rate of at least 70 Hz should “fit” the visual needs of a large proportion of VDU operators.
The sensitivity of the eyes to flicker is enhanced by increased brightness and contrast between the fluctuating area and the surrounding area. The size of the fluctuating area also affects sensitivity because the larger the area to be viewed, the larger the area of the retina that is stimulated. The angle at which the light from the fluctuating area strikes the eye and the amplitude of modulation of the fluctuating area are other important variables.
The older the VDU user, the less sensitive the eye because older eyes are less transparent and the retina is less excitable. This is also true in sick people. Laboratory findings such as these help to explain the observations made in the field. For example, it has been found that operators are disturbed by flicker from the screen when reading paper documents (Isensee and Bennett as quoted in Grandjean 1987), and the combination of fluctuation from the screen and fluctuation of fluorescent light has been found to be particularly disturbing.
Lighting
The eye functions best when the contrast between the visual target and its background is maximum, as for example, with a black letter on white paper. Efficiency is further enhanced when the outer edge of the visual field is exposed to slightly lower levels of brightness. Unfortunately, with a VDU the situation is just the reverse of this, which is one reason that so many VDU operators try to protect their eyes against excess light.
Inappropriate contrasts in brightness and unpleasant reflections produced by fluorescent light, for example, can lead to visual complaints among VDU operators. In one study, 40% of 409 VDU workers made such complaints (Läubli et al., 1989).
In order to minimize problems with lighting, just as with viewing distances, flexibility is important. One should be able to adapt light sources to the visual sensitivity of individuals. Workplaces should be provided to offer individuals the opportunity to adjust their lighting.
Job characteristics
Jobs which are carried out under time pressure, especially if they are unskilled and monotonous, are often accompanied by sensations of general fatigue, which, in turn, can give rise to complaints of visual discomfort. In the authors’ laboratory, it was found that visual discomfort increased with the number of accommodative changes the eyes needed to make to carry out the task. This occurred more often in data entry or word processing than in tasks which involved dialogues with the computer. Jobs which are sedentary and provide little opportunity for moving around also provide less opportunity for muscular recovery and hence enhance the likelihood of visual discomfort.
Job organization
Eye discomfort is just one aspect of the physical and mental problems that can be associated with many jobs, as described more fully elsewhere in this chapter. It is not surprising, therefore, to find a high correlation between the level of eye discomfort and job satisfaction. Although night work is still not widely practised in office work, its effects on eye discomfort in VDU work may well be unexpected. This is because, although there are few data as yet available to confirm this, on the one hand, eye capacity during the night shift may be somehow depressed and thus more vulnerable to VDU effects, while on the other hand, the lighting environment is easier to adjust without disturbance from natural lighting, provided that the reflections from fluorescent lamps on dark windows are eliminated.
Individuals who use VDUs to work at home should ensure that they provide themselves with the appropriate equipment and lighting conditions to avoid the adverse environmental factors found in many formal workplaces.
Medical Surveillance
No single, particular hazardous agent has been identified as a visual risk. Asthenopia among VDU operators appears rather to be an acute phenomenon, although there is some belief that sustained strain of accommodation may occur. Unlike many other chronic diseases, misadjustment to VDU work is usually noticed very soon by the “patient”, who may be more likely to seek medical care than will workers in other workplace situations. After such visits, spectacles are often prescribed, but unfortunately they are sometimes ill adapted to needs of the workplace which have been described here. It is essential that practitioners be specially trained to care for patients who work with VDUs. A special course, for example, has been created at the Swiss Federal Institute of Technology in Zurich just for this purpose.
The following factors must be taken into consideration in caring for VDU workers. In comparison to traditional office work, the distance between the eye and the visual target, the screen, is usually of 50 to 70 cm and cannot be changed. Therefore, lenses should be prescribed which take this steady viewing distance into account. Bifocal lenses are inappropriate because they will require a painful extension of the neck in order for the user to read the screen. Multifocal lenses are better, but as they limit rapid eye movements, their use can lead to more head movements, producing additional strain.
Eye correction should be as precise as possible, taking into account the slightest visual defects (e.g., astigmatism) and also the viewing distance of the VDU. Tinted glasses which reduce the illumination level in the centre of the visual field should not be prescribed. Partially tinted spectacles are not useful, since eyes at the workplace are always moving in all directions. Offering special spectacles to employees, however, should not mean that further complaints of visual discomfort from workers may be ignored since the complaints could be justified by poor ergonomic design of the workstation and equipment.
It should be said, finally, that the operators who suffer the most discomfort are those who need raised illumination levels for detail work and who, at the same time, have a higher glare sensitivity. Operators with undercorrected eyes will thus display a tendency to get closer to the screen for more light and will be in this way more exposed to flicker.
Screening and secondary prevention
The usual principles of secondary prevention in public health are applicable to the working environment. Screening therefore should be targeted towards known hazards and is most useful for diseases with long latency periods. Screening should take place prior to any evidence of preventable disease and only tests with high sensitivity, high specificity and high predictive power are useful. The results of screening examinations can be used to assess the extent of exposure both of individuals and of groups.
Since no severe adverse effects on the eye have ever been identified in VDU work, and since no hazardous level of radiations associated with visual problems have been detected, it has been agreed that there is no indication that work with VDUs “will cause disease or damage to the eye” (WHO 1987). The ocular fatigue and eye discomfort that have been reported to occur in VDU operators are not the kinds of health effect which generally form the basis for medical surveillance in a secondary prevention programme.
However, pre-employment visual medical examinations of VDU operators are widespread in most member countries of the International Labour Organization, a requirement supported by trade unions and employers (ILO 1986). In many European countries (including France, the Netherlands and the United Kingdom), medical surveillance for VDU operators, including ocular tests, has also been instituted subsequent to the issuing of Directive 90/270/EEC on work with display screen equipment.
If a programme for the medical surveillance of VDU operators is to be set up, the following issues must be addressed in addition to deciding on the contents of the screening programme and the appropriate testing procedures:
- What is the meaning of the surveillance and how should its results be interpreted?
- Are all VDU operators in need of the surveillance?
- Are any ocular effects which are observed appropriate for a secondary prevention programme?
Most routine visual screening tests available to the occupational physician have poor sensitivity and predictive power for eye discomfort associated with VDU work (Rey and Bousquet 1990). Snellen visual testing charts are particularly inappropriate for the measurement of visual acuity of VDU operators and for predicting their eye discomfort. In Snellen charts the visual targets are dark, precise letters on a clear, well illuminated background, not at all like typical VDU viewing conditions. Indeed, because of the inapplicability of other methods, a testing procedure has been developed by the authors (the C45 device) which simulates the reading and lighting conditions of a VDU workplace. Unfortunately, this remains for the time being a laboratory set-up. It is important to realise, however, that screening examinations are not a substitute for a well-designed workplace and good work organization.
Ergonomic Strategies to Reduce Visual Discomfort
Although systematic ocular screening and systematic visits to the eye specialist have not been shown to be effective in reducing visual symptomatology, they have been widely incorporated into occupational health programmes for VDU workers. A more cost-effective strategy could include an intensive ergonomic analysis of both the job and the workplace. Workers with known ocular diseases should try to avoid intensive VDU work as much as possible. Poorly corrected vision is another potential cause of operator complaints and should be investigated if such complaints occur. The improvement of the ergonomics of the workplace, which could include providing for a low reading angle to avoid a decreased blinking rate and neck extension, and providing the opportunity to rest and to move about on the job, are other effective strategies. New devices, with separate keyboards, allow distances to be adjusted. The VDU may also be made to be moveable, such as by placing it on a mobile arm. Eye strain will thus be reduced by permitting changes in viewing distance which match the corrections to the eye. Often the steps taken to reduce muscular pain in the arms, shoulders and back will at the same time also allow the ergonomist to reduce visual strain. In addition to the design of equipment, the quality of the air can affect the eye. Dry air leads to dry eyes, so that appropriate humidification is needed.
In general the following physical variables should be addressed:
- the distance between the screen and the eye
- the reading angle, which determines the position of the head and the neck
- the distance to walls and windows
- the quality of paper documents (often very poor)
- luminances of screen and surroundings (for artificial and natural lighting)
- flicker effects
- glare sources and reflections
- the humidity level.
Among the organizational variables that should be addressed in improving visual working conditions are:
- content of the task, responsibility level
- time schedules, night work, duration of work
- freedom to “move around”
- full time or part time jobs, etc.
Characteristics of Visual Display Workstations
Workstation Design
On workstations with visual display units
Visual displays with electronically generated images (visual display units or VDUs) represent the most characteristic element of computerized work equipment both in the workplace and in private life. A workstation may be designed to accommodate just a VDU and an input device (normally a keyboard), as a minimum; however, it can also provide room for diverse technical equipment including numerous screens, input and output devices, etc. As recently as the early 1980s, data entry was the most typical task for computer users. In many industrialized countries, however, this type of work is now performed by a relatively small number of users. More and more, journalists, managers and even executives have become “VDU users”.
Most VDU workstations are designed for sedentary work, but working in standing postures may offer some benefits for the users. Thus, there is some need for generic design guidelines applicable to simple and complex workstations used both while sitting and standing. Such guidelines will be formulated below and then applied to some typical workplaces.
Design guidelines
Workplace design and equipment selection should consider not only the needs of the actual user for a given task and the variability of users’ tasks during the relatively long life cycle of furniture (lasting 15 years or longer), but also factors related to maintenance or change of equipment. ISO Standard 9241, part 5, introduces four guiding principles to be applied to workstation design:
Guideline 1: Versatility and flexibility.
A workstation should enable its user to perform a range of tasks comfortably and efficiently. This guideline takes into account the fact that users’ tasks may vary often; thus, the chance of a universal adoption of guidelines for the workplace will be small.
Guideline 2: Fit.
The design of a workstation and its components should ensure a “fit” to be achieved for a variety of users and a range of task requirements. The concept of fit concerns the extent to which furniture and equipment can accommodate an individual user’s various needs, that is, to remain comfortable, free from visual discomfort and postural strain. If not designed for a specific user population, e.g., male European control room operators younger than 40 years of age, the workstation concept should ensure fit for the entire working population including users with special needs, e.g., handicapped persons. Most existing standards for furniture or the design of workplaces take only parts of the working population into consideration (e.g., “healthy” workers between the 5th and 95th percentile, aged between 16 and 60, as in German standard DIN 33 402), neglecting those who may need more attention.
Moreover, though some design practices are still based on the idea of an “average” user, an emphasis on individual fit is needed. With regard to workstation furniture, the fit required may be achieved by providing adjustability, designing a range of sizes, or even by custom-made equipment. Ensuring a good fit is crucial for the health and safety of the individual user, since musculoskeletal problems associated with the use of VDUs are common and significant.
Guideline 3: Postural change.
The design of the workstation should encourage movement, since static muscular load leads to fatigue and discomfort and may induce chronic musculoskeletal problems. A chair that allows easy movement of the upper half of the body, and provision of sufficient space to place and use paper documents as well as keyboards at varying positions during the day, are typical strategies for facilitating body movement while working with a VDU.
Guideline 4: Maintainability—adaptability.
The design of the workstation should take into consideration factors such as maintenance, accessibility, and the ability of the workplace to adapt to changing requirements, such as the ability to move the work equipment if a different task is to be performed. The objectives of this guideline have not received much attention in the ergonomics literature, because problems related to them are assumed to have been solved before users start to work at a workstation. In reality, however, a workstation is an ever-changing environment, and cluttered workspaces, partly or fully unsuitable for the tasks at hand, are very often not the result of their initial design process but are the outcome of later changes.
Applying the guidelines
Task analysis.
Workplace design should be preceded by a task analysis, which provides information about the primary tasks to be performed at the workstation and the equipment needed for them. In such an analysis, the priority given to information sources (e.g., paper-based documents, VDUs, input devices), the frequency of their use and possible restrictions (e.g., limited space) should be determined. The analysis should include major tasks and their relationships in space and time, visual attention areas (how many visual objects are to be used?) and the position and use of the hands (writing, typing, pointing?).
General design recommendations
Height of the work surfaces.
If fixed-height work surfaces are to be used, the minimum clearance between the floor and the surface should be greater than the sum of the popliteal height (the distance between the floor and the back of the knee) and thigh clearance height (sitting), plus allowance for footwear (25 mm for male users and 45 mm for female users). If the workstation is designed for general use, the popliteal height and thigh clearance height should be selected for the 95th percentile male population. The resulting height for the clearance under the desk surface is 690 mm for the population of Northern Europe and for North American users of European origin. For other populations, the minimum clearance needed is to be determined according to the anthropometric characteristics of the specific population.
If the legroom height is selected this way, the top of the work surfaces will be too high for a large proportion of intended users, and at least 30 per cent of them will need a footrest.
If work surfaces are adjustable in height, the required range for adjustment can be calculated from the anthropometric dimensions of female users (5th or 2.5th percentile for minimum height) and male users (95th or 97.5th percentile for maximum height). A workstation with these dimensions will in general be able to accommodate a large proportion of persons with little or no change. The result of such a calculation yields a range between 600 mm to 800 mm for countries with an ethnically varied user population. Since the technical realization of this range may cause some mechanical problems, best fit can also be achieved, for example, by combining adjustability with different size equipment.
The minimum acceptable thickness of the work surface depends on the mechanical properties of the material. From a technical point of view, a thickness between 14 mm (durable plastic or metal) and 30 mm (wood) is achievable.
Size and form of the work surface.
The size and the form of a work surface are mainly determined by the tasks to be performed and the equipment needed for those tasks.
For data entry tasks, a rectangular surface of 800 mm by 1200 mm provides sufficient space to place the equipment (VDU, keyboard, source documents and copy holder) properly and to rearrange the layout according to personal needs. More complex tasks may require additional space. Therefore, the size of the work surface should exceed 800 mm by 1,600 mm. The depth of the surface should allow placing the VDU within the surface, which means that VDUs with cathode ray tubes may require a depth of up to 1,000 mm.
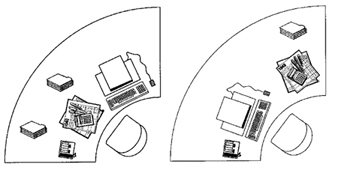
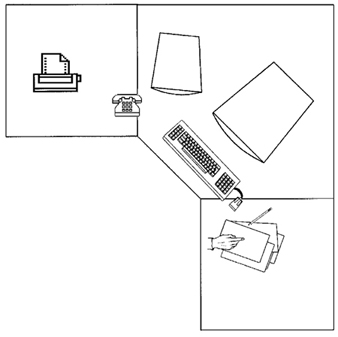
In principle, the layout displayed in figure 1 gives maximum flexibility for organizing the workspace for various tasks. However, workstations with this layout are not easy to construct. Thus, the best approximation of the ideal layout is as displayed in figure 2. This layout allows arrangements with one or two VDUs, additional input devices and so on. The minimum area of the work surface should be larger than 1.3 m2.
Figure 1. Layout of a flexible workstation that can be adapted to fit the needs of users with different tasks
Arranging the workspace.
The spatial distribution of equipment in the workspace should be planned after a task analysis determining the importance and use frequency of each element has been conducted (table 1). The most frequently used visual display should be located within the central visual space, which is the shaded area of figure 3, while the most important and frequently used controls (such as the keyboard) should be located within optimum reach. In the workplace represented by the task analysis (table 1), the keyboard and the mouse are by far the most frequently handled pieces of equipment. Therefore, they should be given the highest priority within the reach area. Documents which are frequently consulted but do not need much handling should be assigned priority according to their importance (e.g., handwritten corrections). Placing them on the right-hand side of the keyboard would solve the problem, but this would create a conflict with the frequent use of the mouse which is also to be located to the right of the keyboard. Since the VDU may not need adjustment frequently, it can be placed to the right or left of the central field of vision, allowing the documents to be set on a flat document holder behind the keyboard. This is one possible, though not perfect, “optimized” solution.
Table 1. Frequency and importance of elements of equipment for a given task
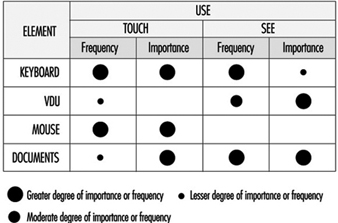
Figure 3. Visual workplace range

Since many elements of the equipment possess dimensions comparable to corresponding parts of the human body, using various elements within one task will always be associated with some problems. It also may require some movements between parts of the workstation; hence a layout like that shown in figure 1 is important for various tasks.
In the course of the last two decades, computer power that would have needed a ballroom at the beginning was successfully miniaturized and condensed into a simple box. However, contrary to the hopes of many practitioners that miniaturization of equipment would solve most problems associated with workplace layout, VDUs have continued to grow: in 1975, the most common screen size was 15"; in 1995 people bought 17" to 21”:monitors, and no keyboard has become much smaller than those designed in 1973. Carefully performed task analyses for designing complex workstations are still of growing importance. Moreover, although new input devices have emerged, they have not replaced the keyboard, and require even more space on the work surface, sometimes of substantial dimensions, e.g., graphic tablets in an A3-format.
Efficient space management within the limits of a workstation, as well as within work rooms, may help in developing acceptable workstations from an ergonomic point of view, thus preventing the emergence of various health and safety problems.
Efficient space management does not mean saving space at the expense of the usability of input devices and especially vision. Using extra furniture, such as a desk return, or a special monitor-holder clamped to the desk, may appear to be a good way to save desk space; however, it may be detrimental to posture (raised arms) and vision (raising the line of vision upwards from the relaxed position). Space-saving strategies should ensure that an adequate visual distance (approximately 600 mm to 800 mm) is maintained, as well as an optimum line-of-vision, obtained from an inclination of approximately 35º from the horizontal (20º head and 15º eyes).
New furniture concepts.
Traditionally, office furniture was adapted to the needs of businesses, supposedly reflecting the hierarchy of such organizations: large desks for executives working in “ceremonial” offices at one end of the scale, and small typists furniture for “functional” offices at the other. The basic design of office furniture did not change for decades. The situation changed substantially with the introduction of information technology, and a completely new furniture concept has emerged: that of systems furniture.
Systems furniture was developed when people realized that changes in working equipment and work organization could not be matched by the limited capabilities of existing furniture to adapt to new needs. Furniture today offers a tool-box that enables the user organizations to create workspace as needed, from a minimal space for just a VDU and a keyboard up to complex workstations that can accommodate various elements of equipment and possibly also groups of users. Such furniture is designed for change and incorporates efficient and flexible cable management facilities. While the first generation of systems furniture did not do much more than add an auxiliary desk for the VDU to an existing desk, the third generation has completely broken its ties to the traditional office. This new approach offers great flexibility in designing workspaces, limited only by the available space and the abilities of organizations to use this flexibility.
Radiation
Radiation in the context of VDU applications
Radiation is the emission or transfer of radiant energy. The emission of radiant energy in the form of light as the intended purpose for the use of VDUs may be accompanied by various unwanted by-products such as heat, sound, infrared and ultraviolet radiation, radio waves or x rays, to name a few. While some forms of radiation, like visible light, may affect humans in a positive way, some emissions of energy can have negative or even destructive biological effects, especially when the intensity is high and the duration of exposure is long. Some decades ago exposure limits for different forms of radiation were introduced to protect people. However, some of these exposure limits are questioned today, and, for low frequency alternating magnetic fields, no exposure limit can be given based on levels of natural background radiation.
Radiofrequency and microwave radiation from VDUs
Electromagnetic radiation with a frequency range from a few kHz to 109 Hertz (the so-called radiofrequency, or RF, band, with wavelengths ranging from some km to 30 cm) can be emitted by VDUs; however, the total energy emitted depends on the characteristics of the circuitry. In practice, however, the field strength of this type of radiation is likely to be small and confined to the immediate vicinity of the source. A comparison of the strength of alternating electric fields in the range of 20 Hz to 400 kHz indicates that VDUs using cathode ray tube (CRT) technology emit, in general, higher levels than other displays.
“Microwave” radiation covers the region between 3x10⁸ Hz to 3x10¹¹ Hz (wavelengths 100 cm to 1 mm). There are no sources of microwave radiation in VDUs that emit a detectable amount of energy within this band.
Magnetic fields
Magnetic fields from a VDU originate from the same sources as alternating electric fields. Although magnetic fields are not “radiation”, alternating electric and magnetic fields cannot be separated in practice, since one induces the other. One reason why magnetic fields are discussed separately is that they are suspected to have teratogenic effects (see discussion later in this chapter).
Although the fields induced by VDUs are weaker than those induced by some other sources, such as high-voltage power lines, power plants, electrical locomotives, steel ovens and welding equipment, the total exposure produced by VDUs may be similar since people may work eight or more hours in the vicinity of a VDU but seldom near power lines or electric motors. The question of the relationship between electromagnetic fields and cancer, however, is still a matter for debate.
Optical radiation
“Optical” radiation covers visible radiation (i.e., light) with wavelengths from 380 nm (blue) to 780 nm (red), and the neighbouring bands in the electromagnetic spectrum (infrared from 3x10¹¹ Hz to 4x10¹⁴ Hz, wavelengths from 780 nm to 1 mm; ultraviolet from 8x10¹⁴ Hz to 3x10¹⁷ Hz). Visible radiation is emitted at moderate levels of intensity comparable with that emitted by room surfaces (»100 cd/m2). However, ultraviolet radiation is trapped by the glass of the tube face (CRTs) or not emitted at all (other display technologies). Levels of ultraviolet radiation, if detectable at all, stay well below occupational exposure standards, as do those of infrared radiation.
X rays
CRTs are well-known sources of x rays, while other technologies like liquid crystal displays (LCDs) do not emit any. The physical processes behind emissions of this type of radiation are well understood, and tubes and circuitry are designed to keep the emitted levels far below the occupational exposure limits, if not below detectable levels. Radiation emitted by a source can only be detected if its level exceeds the background level. In the case of x rays, as for other ionizing radiation, the background level is provided by cosmic radiation and by radiation from radioactive materials in the ground and in buildings. In normal operation, a VDU does not emit x rays exceeding the background level of radiation (50 nGy/h).
Radiation recommendations
In Sweden, the former MPR (Statens Mät och Provråd, the National Council for Metrology and Testing) organization, now SWEDAC, has worked out recommendations for evaluating VDUs. One of their main objectives was to limit any unwanted by-product to levels that can be achieved by reasonable technical means. This approach goes beyond the classical approach of limiting hazardous exposures to levels where the likelihood of an impairment of health and safety seems to be acceptably low.
At the beginning, some recommendations of MPR led to the unwanted effect of reducing the optical quality of CRT displays. However, at present, only very few products with extremely high resolution may suffer any degradation if the manufacturer attempts to comply with the MPR (now MPR-II). The recommendations include limits for static electricity, magnetic and electric alternating fields, visual parameters, etc.
Image Quality
Definitions for image quality
The term quality describes the fit of distinguishing attributes of an object for a defined purpose. Thus, the image quality of a display includes all properties of the optical representation regarding the perceptibility of symbols in general, and the legibility or readability of alphanumeric symbols. In this sense, optical terms used by tube manufacturers, like resolution or minimum spot size, describe basic quality criteria concerning the abilities of a given device for displaying thin lines or small characters. Such quality criteria are comparable with the thickness of a pencil or brush for a given task in writing or painting.
Some of the quality criteria used by ergonomists describe optical properties that are relevant for legibility, e.g., contrast, while others, like character size or stroke width, refer more to typographical features. In addition, some technology-dependent features like the flicker of images, the persistence of images, or the uniformity of contrast within a given display are also considered in ergonomics (see figure 4).
Figure 4. Criteria for image evaluation
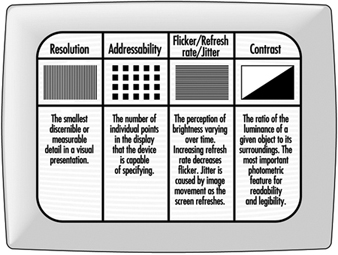
Typography is the art of composing “type”, which is not only shaping the fonts, but also selecting and setting of type. Here, the term typography is used in the first meaning.
Basic characteristics
Resolution.
Resolution is defined as the smallest discernible or measurable detail in a visual presentation. For example, the resolution of a CRT display can be expressed by the maximum number of lines that can be displayed in a given space, as usually done with the resolution of photographic films. One can also describe the minimum spot size that a device can display at a given luminance (brightness). The smaller the minimum spot, the better the device. Thus, the number of dots of minimum size (picture elements—also known as pixels) per inch (dpi) represents the quality of the device, e.g., a 72 dpi device is inferior to a 200 dpi display.
In general, the resolution of most computer displays is well below 100 dpi: some graphic displays may achieve 150 dpi, however, only with limited brightness. This means, if a high contrast is required, the resolution will be lower. Compared with the resolution of print, e.g., 300 dpi or 600 dpi for laser printers, the quality of VDUs is inferior. (An image with 300 dpi has 9 times more elements in the same space than a 100 dpi image.)
Addressability.
Addressability describes the number of individual points in the field that the device is capable of specifying. Addressability, which is very often confused with resolution (sometimes deliberately), is one specification given for devices: “800 x 600” means that the graphic board can address 800 points on every one of 600 horizontal lines. Since one needs at least 15 elements in the vertical direction to write numbers, letters and other characters with ascenders and descenders, such a screen can display a maximum of 40 lines of text. Today, the best available screens can address 1,600 x 1,200 points; however, most displays used in industry address 800 x 600 points or even less.
On displays of the so-called “character-oriented” devices, it is not dots (points) of the screen that are addressed but character boxes. In most such devices, there are 25 lines with 80 character positions each in the display. On these screens, each symbol occupies the same space regardless of its width. In industry the lowest number of pixels in a box is 5 wide by 7 high. This box allows both upper and lower case characters, although the descenders in “p”, “q” and “g”, and the ascenders above “Ä” or “Á” cannot be displayed. Considerably better quality is provided with the 7 x 9 box, which has been “standard” since the mid-1980s. To achieve good legibility and reasonably good character shapes, the character box size should be at least 12 x 16.
Flicker and refresh rate.
The images on CRTs and on some other types of VDU are not persistent images, as on paper. They only appear to be steady by taking advantage of an artefact of the eye. This, however, is not without penalty, since the screen tends to flicker if the image is not refreshed constantly. Flicker can influence both performance and comfort of the user and should always be avoided.
Flicker is the perception of brightness varying over time. The severity of flicker depends on various factors such as the characteristics of the phosphor, size and brightness of the flickering image, etc. Recent research shows that refresh rates up to 90 Hz may be needed to satisfy 99 per cent of users, while in earlier research, refresh rates well below 50 Hz were thought to be satisfactory. Depending on various features of the display, a flicker-free image may be achieved by refresh rates between 70 Hz and 90 Hz; displays with a light background (positive polarity) need a minimum of 80 Hz to be perceived as flicker-free.
Some modern devices offer an adjustable refresh rate; unfortunately, higher refresh rates are coupled with lower resolution or addressability. The ability of a device to display high “resolution” images with high refresh rates can be assessed by its video bandwidth. For displays with high quality, the maximum video bandwidth lies above 150 MHz, while some displays offer less than 40 MHz.
To achieve a flicker-free image and a high resolution with devices with lower video bandwidth, the manufacturers apply a trick that stems from commercial TV: the interlace mode. In this case, every second line on the display is refreshed with a given frequency. The result, however, is not satisfactory if static images, such as text and graphics, are displayed and the refresh rate is below 2 x 45 Hz. Unfortunately, the attempt to suppress the disturbing effect of flicker may induce some other negative effects.
Jitter.
Jitter is the result of spatial instability of the image; a given picture element is not displayed at the same location on the screen after each refresh process. The perception of jitter cannot be separated from the perception of flicker.
Jitter may have its cause in the VDU itself, but it can also be induced by interaction with other equipment at the workplace, such as a printer or other VDUs or devices that generate magnetic fields.
Contrast.
Brightness contrast, the ratio of the luminance of a given object to its surroundings, represents the most important photometric feature for readability and legibility. While most standards require a minimum ratio of 3:1 (bright characters on dark background) or 1:3 (dark characters on bright background), optimum contrast is actually about 10:1, and devices of good quality achieve higher values even in bright environments.
The contrast of “active” displays is impaired when the ambient light is increased, while “passive” displays (e.g., LCDs) lose contrast in dark environments. Passive displays with background lighting may offer good visibility in all environments under which people may work.
Sharpness.
Sharpness of an image is a well-known, but still ill-defined feature. Hence, there is no agreed-upon method to measure sharpness as a relevant feature for legibility and readability.
Typographical features
Legibility and readability.
Readability refers to whether a text is understandable as a series of connected images, while legibility refers to the perception of single or grouped characters. Thus, good legibility is, in general, a precondition for readability.
Legibility of text depends on several factors: some have been investigated thoroughly, while other relevant factors like character shapes are yet to be classified. One of the reasons for this is that the human eye represents a very powerful and robust instrument, and the measures used for performance and error rates often do not help to distinguish between different fonts. Thus, to some extent, typography still remains an art rather than a science.
Fonts and readability.
A font is a family of characters, designed to yield either optimum readability on a given medium, e.g., paper, electronic display or projection display, or some desired aesthetic quality, or both. While the number of available fonts exceeds ten thousand, only a few fonts, numbered in tens, are believed to be “readable”. Since legibility and readability of a font are also affected by the experience of the reader—some “legible” fonts are believed to have become so because of decades or even centuries of use without changing their shape—the same font may be less legible on a screen than on paper, merely because its characters look “new”. This, however, is not the main reason for the poor legibility of screens.
In general, the design of screen fonts is restricted by shortcomings in technology. Some technologies impose very narrow limits on the design of characters, e.g., LEDs or other rastered screens with limited numbers of dots per display. Even the best CRT displays can seldom compete with print (figure 5). In the last years, research has shown that speed and accuracy of reading on screens is about 30% lower than on paper, but whether this is due to features of the display or to other factors is not yet known.
Figure 5. Appearance of a letter at various screen resolutions and on paper (right)

Characteristics with measurable effects.
The effects of some characteristics of alphanumeric representations are measurable, e.g., apparent size of the characters, height/width ratio, stroke width/size ratio, line, word and character spacing.
The apparent size of the characters, measured in minutes of arc, shows an optimum by 20' to 22'; this corresponds to about 3 mm to 3.3 mm in height under normal viewing conditions in offices. Smaller characters may lead to increased errors, visual strain, and also to more postural strain due to restricted viewing distance. Thus, text should not be represented in an apparent size of less than 16'.
However, graphical representations may require text of smaller size to be displayed. To avoid errors, on the one hand, and a high visual load for the user on the other, parts of the text to be edited should be displayed in a separate window to assure good readability. Characters with an apparent size of less than 12' should not be displayed as readable text, but replaced by a rectangular grey block. Good programs allow the user to select the minimum actual size of characters that are to be displayed as alphanumerics.
The optimum height/width ratio of characters is about 1:0.8; legibility is impaired if the ratio is above 1:0.5. For good legible print and also for CRT screens, the ratio of character height to stroke width is about 10:1. However, this is only a rule of thumb; legible characters of high aesthetical value often show different stroke widths (see figure 5).
Optimal line spacing is very important for readability, but also for space saving, if a given amount of information is to be displayed in limited space. The best example for this is the daily newspaper, where an enormous amount of information is displayed within a page, but is still readable. The optimum line spacing is about 20% of character height between the descenders of a line and the ascenders of the next; this is a distance of about 100% of the character height between the baseline of a line of text and the ascenders of the next. If the length of the line is reduced, the space between the lines may be reduced, too, without losing readability.
Character spacing is invariable on character-oriented screens, making them inferior in readability and aesthetic quality to displays with variable space. Proportional spacing depending on the shape and width of the characters is preferable. However, a typographical quality comparable to well-designed printed fonts is achievable only on few displays and when using specific programs.
Ambient Lighting
The specific problems of VDU workstations
During the last 90 years of industrial history, the theories about the lighting of our workplaces have been governed by the notion that more light will improve vision, reduce stress and fatigue, as well as enhance performance. “More light”, correctly speaking “more sunlight”, was the slogan of people in Hamburg, Germany, more than 60 years ago when they took to the streets to fight for better and healthier homes. In some countries like Denmark or Germany, workers today are entitled to have some daylight at their workplaces.
The advent of information technology, with the emergence of the first VDUs in working areas, was presumably the first event ever when workers and scientists began to complain about too much light in working areas. The discussion was fuelled by the easily detectable fact that most VDUs were equipped with CRTs, which have curved glass surfaces prone to veiling reflections. Such devices, sometimes called “active displays”, lose contrast when the level of ambient lighting becomes higher. Redesigning lighting to reduce the visual impairments caused by these effects, however, is complicated by the fact that most users also use paper-based information sources, which generally require increased levels of ambient light for good visibility.
The role of ambient light
Ambient light found in the vicinity of VDU workstations serves two different purposes. First, it illuminates the workspace and working materials like paper, telephones, etc. (primary effect). Secondly, it illuminates the room, giving it its visible shape and giving the users the impression of a light surrounding (secondary effect). Since most lighting installations are planned according to the concept of general lighting, the same lighting sources serve both purposes. The primary effect, illuminating passive visual objects to make them visible or legible, became questionable when people started to use active screens that do not need ambient light to be visible. The remaining benefit of the room lighting was reduced to the secondary effect, if the VDU is the major source of information.
The function of VDUs, both of CRTs (active displays) and of LCDs (passive displays), is impaired by the ambient light in specific ways:
CRTs:
- The curved glass surface reflects bright objects in the environment, and forms a kind of visual “noise”.
- Depending on the intensity of ambient illumination, the contrast of displayed objects is reduced to a degree that readability or legibility of the objects is impaired.
- Images on colour CRTs suffer a twofold degradation: First, the brightness contrast of all displayed objects is reduced, as on monochrome CRTs. Secondly, the colours are changed so that colour contrast is also reduced. In addition, the number of distinguishable colours is reduced.
LCDs (and other passive displays):
- The reflections on LCDs cause less concern than those on CRT surfaces, since these displays have flat surfaces.
- In contrast to active displays, LCDs (without backlight) lose contrast under low levels of ambient illumination.
- Due to poor directional characteristics of some display technologies, visibility or legibility of displayed objects is substantially reduced if the main direction of light incidence is unfavourable.
The extent to which such impairments exert a stress on users or lead to a substantial reduction of visibility/readability/legibility of visual objects in real working environments varies greatly. For example, the contrast of alphanumeric characters on monochrome (CRT) displays is reduced in principle, but, if the illuminance on the screen is ten times higher than in normal working environments, many screens will still have a contrast sufficient to read alphanumeric characters. On the other hand, colour displays of computer-aided design (CAD) systems decrease substantially in visibility so that most users prefer to dim the artificial lighting or even to switch it off, and, in addition, to keep the daylight out of their working area.
Possible remedies
Changing illuminance levels.
Since 1974, numerous studies have been performed which led to recommendations for reducing illuminance at the workplace. However, these recommendations were mostly based on studies with unsatisfactory screens. The recommended levels were between 100 lux and 1,000 lx, and generally, levels well below the recommendations of the existing standards for office lighting (e.g., 200 lx or 300 to 500 lx) have been discussed.
When positive screens with a luminance of approximately 100 cd/m2 brightness and some kind of efficient anti-glare treatment are used, the utilization of a VDU does not limit the acceptable illuminance level, since users find illuminance levels up to 1,500 lx acceptable, a value which is very rare in working areas.
If the relevant characteristics of the VDUs do not allow comfortable working under normal office lighting, as can occur when working with storage tubes, microimage readers, colour screens etc., the visual conditions can be improved substantially by introducing two-component lighting. Two-component lighting is a combination of indirect room lighting (secondary effect) and direct task lighting. Both components should be controllable by the users.
Controlling glare on screens.
Controlling glare on screens is a difficult task since almost all remedies that improve the visual conditions are likely to impair some other important characteristic of the display. Some remedies, proposed for many years, such as mesh filters, remove reflections from the displays but they also impair the legibility of the display. Low luminance luminaires cause less reflected glare on screens, but the quality of such lighting generally is judged by users to be worse than that of any other type of lighting.
For this reason, any measures (see figure 6) should be applied cautiously, and only after analysing the real cause of the annoyance or disturbance. Three possible ways of controlling glare on screens are: selection of the correct location of the screen with respect to glare sources; selection of suitable equipment or addition of elements to it; and use of lighting. The costs of the measures to be taken are of the same order: it costs almost nothing to place screens in such a way as to eliminate reflected glare. However, this may not be possible in all cases; thus, equipment-related measures will be more expensive but may be necessary in various working environments. Glare control by lighting is often recommended by lighting specialists; however, this method is the most expensive but not the most successful way of controlling glare.
Figure 6. Strategies for controlling glare on screens
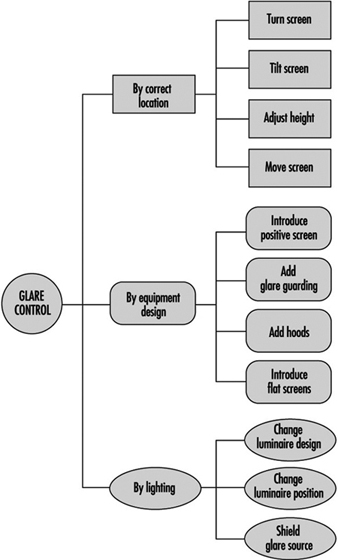
The most promising measure at present is the introduction of positive screens (displays with bright background) with an additional anti-glare treatment for the glass surface. Even more successful than this will be the introduction of flat screens with a nearly matt surface and bright background; such screens, however, are not available for general use today.
Adding hoods to displays is the ultima ratio of the ergonomists for difficult work environments like production areas, towers of airports or operator cabins of cranes, etc. If hoods are really needed, it is likely that there will be more severe problems with lighting than just reflected glare on visual displays.
Changing luminaire design is mainly accomplished in two ways: first, by reducing the luminance (corresponds to apparent brightness) of parts of the light fittings (so called “VDU lighting”), and secondly, by introducing indirect light instead of direct light. The results of current research show that introducing indirect light yields substantial improvements for users, reduces visual load, and is well accepted by users.
Overview
New information technologies are being introduced in all industrial sectors, albeit to varying extents. In some cases, the costs of computerizing production processes may constitute an impediment to innovation, particularly in small and medium-sized companies and in developing countries. Computers make possible the rapid collection, storage, processing and dissemination of large quantities of information. Their utility is further enhanced by their integration into computer networks, which allow resources to be shared (Young 1993).
Computerization exerts significant effects on the nature of employment and on working conditions. Beginning about the mid-1980s, it was recognized that workplace computerization may lead to changes in task structure and work organization, and by extension to work requirements, career planning and stress suffered by production and management personnel. Computerization may exert positive or negative effects on occupational health and safety. In some cases, the introduction of computers has rendered work more interesting and resulted in improvements in the work environment and reductions of workload. In others, however, the result of technological innovation has been an increase in the repetitive nature and intensity of tasks, a reduction of the margin for individual initiative and the isolation of the worker. Furthermore, several companies have been reported to increase the number of work shifts in an attempt to extract the largest possible economic benefit from their financial investment (ILO 1984).
As far as we have been able to determine, as of 1994 statistics on the worldwide use of computers are available from one source only—The Computer Industry Almanac (Juliussen and Petska-Juliussen 1994). In addition to statistics on the current international distribution of computer use, this publication also reports the results of retrospective and prospective analyses. The figures reported in the latest edition indicate that the number of computers is increasing exponentially, with the increase becoming particularly marked at the beginning of the 1980s, the point at which personal computers began to attain great popularity. Since 1987, total computer processing power, measured in terms of the number of million instructions per second executed (MIPS) has increased 14-fold, thanks to the development of new microprocessors (transistor components of microcomputers which perform arithmetical and logical calculations). By the end of 1993, total computing power attained 357 million MIPS.
Unfortunately, available statistics do not differentiate between computers used for work and personal purposes, and statistics are unavailable for some industrial sectors. These knowledge gaps are most likely due to methodological problems related to the collection of valid and reliable data. However, reports of the International Labour Organization’s tripartite sectoral committees contain relevant and comprehensive information on the nature and extent of the penetration of new technologies in various industrial sectors.
In 1986, 66 million computers were in use throughout the world. Three years later, there were more than 100 million, and by 1997, it is estimated that 275–300 million computers will be in use, with this number reaching 400 million by 2000. These predictions assume the widespread adoption of multimedia, information highway, voice recognition and virtual reality technologies. The Almanac’s authors consider that most televisions will be equipped with personal computers within ten years of publication, in order to simplify access to the information highway.
According to the Almanac, in 1993 the overall computer: population ratio in 43 countries in 5 continents was 3.1 per 100. It should however be noted that South Africa was the only African country reporting and that Mexico was the only Central American country reporting. As the statistics indicate, there is a very wide international variation in the extent of computerization, the computer:population ratio ranging from 0.07 per 100 to 28.7 per 100.
The computer:population ratio of less than 1 per 100 in developing countries reflects the generally low level of computerization prevailing there (table 1) (Juliussen and Petska-Juliussen 1994). Not only do these countries produce few computers and little software, but lack of financial resources may in some cases prevent them from importing these products. Moreover, their often rudimentary telephone and electrical utilities are often barriers to more widespread computer use. Finally, little linguistically and culturally appropriate software is available, and training in computer-related fields is often problematic (Young 1993).
Table 1. Distribution of computers in various regions of the world
|
REGION |
COMPUTERS PER 100 PEOPLE |
|
NORTH AMERICA |
|
|
United States |
28.7 |
|
Canada |
8.8 |
|
CENTRAL AMERICA |
|
|
Mexico |
1.7 |
|
SOUTH AMERICA |
|
|
Argentina |
1.3 |
|
Brazil |
0.6 |
|
Chile |
2.6 |
|
Venezuela |
1.9 |
|
WESTERN EUROPE |
|
|
Austria |
9.5 |
|
Belgium |
11.7 |
|
Denmark |
16.8 |
|
Finland |
16.7 |
|
France |
12.9 |
|
Germany |
12.8 |
|
Greece |
2.3 |
|
Ireland |
13.8 |
|
Italy |
7.4 |
|
Netherlands |
13.6 |
|
Norway |
17.3 |
|
Portugal |
4.4 |
|
Spain |
7.9 |
|
Sweden |
15 |
|
Switzerland |
14 |
|
United Kingdom |
16.2 |
|
EASTERN EUROPE |
|
|
Czech Republic |
2.2 |
|
Hungary |
2.7 |
|
Poland |
1.7 |
|
Russian Federation |
0.78 |
|
Ukraine |
0.2 |
|
OCEANIA |
|
|
Australia |
19.2 |
|
New Zealand |
14.7 |
|
AFRICA |
|
|
South Africa |
1 |
|
ASIA |
|
|
China |
0.09 |
|
India |
0.07 |
|
Indonesia |
0.17 |
|
Israel |
8.3 |
|
Japan |
9.7 |
|
Korea, Republic of |
3.7 |
|
Phillipines |
0.4 |
|
Saudi Arabia |
2.4 |
|
Singapore |
12.5 |
|
Taiwan |
7.4 |
|
Thailand |
0.9 |
|
Turkey |
0.8 |
|
Less than 1 |
1 - 5 6 - 10 11 - 15 16-20 21 - 30 |
Source: Juliussen and Petska-Juliussen 1994.
Computerization has significantly increased in the countries of the former Soviet Union since the end of the Cold War. The Russian Federation, for example, is estimated to have increased its stock of computers from 0.3 million in 1989 to 1.2 million in 1993.
The largest concentration of computers is found in the industrialized countries, especially in North America, Australia, Scandinavia and Great Britain (Juliussen and Petska-Juliussen 1994). It was principally in these countries that the first reports of visual display unit (VDU) operators’ fears regarding health risks appeared and the initial research aimed at determining the prevalence of health effects and identifying risk factors undertaken. The health problems studied fall into the following categories: visual and ocular problems, musculoskeletal problems, skin problems, reproductive problems, and stress.
It soon became evident that the health effects observed among VDU operators were dependent not only on screen characteristics and workstation layout, but also on the nature and structure of tasks, organization of work and manner in which the technology was introduced (ILO 1989). Several studies have reported a higher prevalence of symptoms among female VDU operators than among male operators. According to recent studies, this difference is more reflective of the fact that female operators typically have less control over their work than do their male counterparts than of true biological differences. This lack of control is thought to result in higher stress levels, which in turn result in increased symptom prevalence in female VDU operators.
VDUs were first introduced on a widespread basis in the tertiary sector, where they were used essentially for office work, more specifically data entry and word processing. We should not therefore be surprised that most studies of VDUs have focused on office workers. In industrialized countries, however, computerization has spread to the primary and secondary sectors. In addition, although VDUs were used almost exclusively by production workers, they have now penetrated to all organizational levels. In recent years, researchers have therefore begun to study a wider range of VDU users, in an attempt to overcome the lack of adequate scientific information on these situations.
Most computerized workstations are equipped with a VDU and a keyboard or mouse with which to transmit information and instructions to the computer. Software mediates information exchange between the operator and the computer and defines the format with which information is displayed on the screen. In order to establish the potential hazards associated with VDU use, it is first necessary to understand not only the characteristics of the VDU but also those of the other components of the work environment. In 1979, Çakir, Hart and Stewart published the first comprehensive analysis in this field.
It is useful to visualize the hardware used by VDU operators as nested components that interact with each other (IRSST 1984). These components include the terminal itself, the workstation (including work tools and furniture), the room in which the work is carried out, and the lighting. The second article in this chapter reviews the main characteristics of workstations and their lighting. Several recommendations aimed at optimizing working conditions while taking into account individual variations and variations in tasks and work organization are offered. Appropriate emphasis is placed on the importance of choosing equipment and furniture which allow flexible layouts. This flexibility is extremely important in light of international competition and rapidly evolving technological development that are constantly driving companies to introduce innovations and while simultaneously forcing them to adapt to the changes these innovations bring.
The next six articles discuss health problems studied in response to fears expressed by VDU operators. The relevant scientific literature is reviewed and the value and limitations of research results highlighted. Research in this field draws upon numerous disciplines, including epidemiology, ergonomics, medicine, engineering, psychology, physics and sociology. Given the complexity of the problems and more specifically their multifactorial nature, the necessary research has often been conducted by multidisciplinary research teams. Since the 1980s, these research efforts have been complemented by regularly organized international congresses such as Human-Computer Interaction and Work with Display Units, which provide an opportunity to disseminate research results and promote the exchange of information between researchers, VDU designers, VDU producers and VDU users.
The eighth article discusses human-computer interaction specifically. The principles and methods underlying the development and evaluation of interface tools are presented. This article will prove useful not only to production personnel but also those interested in the criteria used to select interface tools.
Finally, the ninth article reviews international ergonomic standards as of 1995, related to the design and layout of computerized workstations. These standards have been produced in order to eliminate the hazards to which VDU operators can be exposed in the course of their work. The standards provide guidelines to companies producing VDU components, employers responsible for the purchase and layout of workstations, and employees with decision-making responsibilities. They may also prove useful as tools with which to evaluate existing workstations and identify modifications required in order to optimize operators’ working conditions.
Organizing for Fire Protection
Private Emergency Organization
Profit is the main objective of any industry. To achieve this objective, an efficient and alert management and continuity of production are essential. Any interruption in production, for any reason, will adversely affect profits. If the interruption is the result of a fire or explosion, it may be long and may cripple the industry.
Very often, a plea is taken that the property is insured and loss due to fire, if any, will be indemnified by the insurance company. It must be appreciated that insurance is only a device to spread the effect of the destruction brought by fire or explosion on as many people as possible. It cannot make good the national loss. Besides, insurance is no guarantee of continuity of production and elimination or minimization of consequential losses.
What is indicated, therefore, is that the management must gather complete information on the fire and explosion hazard, evaluate the loss potential and implement suitable measures to control the hazard, with a view to eliminating or minimizing the incidence of fire and explosion. This involves the setting up of a private emergency organization.
Emergency Planning
Such an organization must, as far as possible, be considered from the planning stage itself, and implemented progressively from the time of selection of site until production has started, and then continued thereafter.
Success of any emergency organization depends to a large extent on the overall participation of all workers and various echelons of the management. This fact must be borne in mind while planning the emergency organization.
The various aspects of emergency planning are mentioned below. For more details, a reference may be made to the US National Fire Protection Association (NFPA) Fire Protection Handbook or any other standard work on the subject (Cote 1991).
Stage 1
Initiate the emergency plan by doing the following:
- Identify and evaluate fire and explosion hazards associated with the transportation, handling and storage of each raw material, intermediate and finished products and each industrial process, as well as work out detailed preventive measures to counteract the hazards with a view to eliminating or minimizing them.
- Work out the requirements of fire protection installations and equipment, and determine the stages at which each is to be provided.
- Prepare specifications for the fire protection installation and equipment.
Stage 2
Determine the following:
- availability of adequate water supply for fire protection in addition to the requirements for processing and domestic use
- susceptibility of site and natural hazards, such as floods, earthquakes, heavy rains, etc.
- environments, i.e., the nature and extent of surrounding property and the exposure hazard involved in the event of a fire or explosion
- existence of private (works) or public fire brigade(s), the distance at which such fire brigade(s) is (are) located and the suitability of the appliances available with them for the risk to be protected and whether they can be called upon to assist in an emergency
- response from the assisting fire brigade(s) with particular reference to impediments, such as railway crossings, ferries, inadequate strength and (or) width of bridges in relation to the fire appliances, difficult traffic, etc.
- socio-political environment , i.e., incidence of crime, and political activities leading to law-and-order problems.
Stage 3
Prepare the layout and building plans, and the specifications of construction material. Carry out the following tasks:
- Limit the floor area of each shop, workplace, etc. by providing fire walls, fire doors, etc.
- Specify the use of fire-resistant materials for construction of building or structure.
- Ensure that steel columns and other structural members are not exposed.
- Ensure adequate separation between building, structures and plant.
- Plan installation of fire hydrants, sprinklers, etc. where necessary.
- Ensure the provision of adequate access roads in the layout plan to enable fire appliances to reach all parts of the premises and all sources of water for fire-fighting.
Stage 4
During construction, do the following:
- Acquaint the contractor and his or her employees with the fire risk management policies, and enforce compliance.
- Thoroughly test all fire protection installations and equipment before acceptance.
Stage 5
If the size of the industry, its hazards or its out-of-the-way location is such that a full-time fire brigade must be available on the premises, then organize, equip and train the required full-time personnel. Also appoint a full-time fire officer.
Stage 6
To ensure full participation of all employees, do the following:
- Train all personnel in the observance of precautionary measures in their day-to-day work and the action required of them upon an outbreak of fire or explosion. The training must include operation of fire-fighting equipment.
- Ensure strict observance of fire precautions by all concerned personnel through periodic reviews.
- Ensure regular inspection and maintenance of all fire protection systems and equipment. All defects must be rectified promptly.
Managing the emergency
To avoid confusion at the time of an actual emergency, it is essential that everyone in the organization knows the precise part that he (she) and others are expected to play during the emergency. A well-thought-out emergency plan must be prepared and promulgated for this purpose, and all concerned personnel must be made fully familiar with it. The plan must clearly and unambiguously lay down the responsibilities of all concerned and also specify a chain of command. As a minimum, the emergency plan should include the following:
1. name of the industry
2. address of the premises, with telephone number and a site plan
3. purpose and objective of the emergency plan and effective date of its coming in force
4. area covered, including a site plan
5. emergency organization, indicating chain of command from the work manager on downwards
6. fire protection systems, mobile appliances and portable equipment, with details
7. details of assistance availability
8. fire alarm and communication facilities
9. action to be taken in an emergency. Include separately and unambiguously the action to be taken by:
- the person discovering the fire
- the private fire brigade on the premises
- head of the section involved in the emergency
- heads of other sections not actually involved in theemergency
- the security organization
- the fire officer, if any
- the works manager
- others
10. chain of command at the scene of incident. Consider all possible situations, and indicate clearly who is to assume command in each case, including the circumstances under which another organization is to be called in to assist.
11. action after a fire. Indicate responsibility for:
- recommissioning or replenishing of all fire protectionsystems, equipment and water sources
- investigating the cause of fire or explosion
- preparation and submission of reports
- initiating remedial measures to prevent re-occurrence of similar emergency.
When a mutual assistance plan is in operation, copies of emergency plan must be supplied to all participating units in return for similar plans of their respective premises.
Evacuation Protocols
A situation necessitating the execution of the emergency plan may develop as a result of either an explosion or a fire.
Explosion may or may not be followed by fire, but in almost all cases, it produces a shattering effect, which may injure or kill personnel present in the vicinity and/or cause physical damage to property, depending upon the circumstances of each case. It may also cause shock and confusion and may necessitate the immediate shut-down of the manufacturing processes or a portion thereof, along with the sudden movement of a large number of people. If the situation is not controlled and guided in an orderly manner immediately, it may lead to panic and further loss of life and property.
Smoke given out by the burning material in a fire may involve other parts of the property and/or trap persons, necessitating an intensive, large-scale rescue operation/evacuation. In certain cases, large-scale evacuation may have to be undertaken when people are likely to get trapped or affected by fire.
In all cases in which large-scale sudden movement of personnel is involved, traffic problems are also created—particularly if public roads, streets or areas have to be used for this movement. If such problems are not anticipated and suitable action is not preplanned, traffic bottlenecks result, which hamper and retard fire extinguishment and rescue efforts.
Evacuation of a large number of persons—particularly from high-rise buildings—may also present problems. For successful evacuation, it is not only necessary that adequate and suitable means of escape are available, but also that the evacuation be effected speedily. Special attention should be given to the evacuation needs of disabled individuals.
Detailed evacuation procedures must, therefore, be included in the emergency plan. These must be frequently tested in the conduct of fire and evacuation drills, which may also involve traffic problems. All participating and concerned organizations and agencies must also be involved in these drills, at least periodically. After each exercise, a debriefing session must be held, during which all mistakes are pointed out and explained. Action must also be taken to prevent repetition of the same mistakes in future exercises and actual incidents by removing all difficulties and reviewing the emergency plan as necessary.
Proper records must be maintained of all exercises and evacuation drills.
Emergency Medical Services
Casualties in a fire or explosion must receive immediate medical aid or be moved speedily to a hospital after being given first aid.
It is essential that management provide one or more first-aid post(s) and, where necessary because of the size and hazardous nature of the industry, one or more mobile paramedical appliances. All first-aid posts and paramedical appliances must be staffed at all times by fully trained paramedics.
Depending upon the size of the industry and the number of workers, one or more ambulance(s) must also be provided and staffed on the premises for removal of casualties to hospitals. In addition, arrangement must be made to ensure that additional ambulance facilities are available at short notice when needed.
Where the size of the industry or workplace so demands, a full-time medical officer should also be made available at all times for any emergency situation.
Prior arrangements must be made with a designated hospital or hospitals at which priority is given to casualties who are removed after a fire or explosion. Such hospitals must be listed in the emergency plan along with their telephone numbers, and the emergency plan must have suitable provisions to ensure that a responsible person shall alert them to receive casualties as soon as an emergency arises.
Facility Restoration
It is important that all fire protection and emergency facilities are restored to a “ready” mode soon after the emergency is over. For this purpose, responsibility must be assigned to a person or section of the industry, and this must be included in the emergency plan. A system of checks to ensure that this is being done must also be introduced.
Public Fire Department Relations
It is not practicable for any management to foresee and provide for all possible contingencies. It is also not economically feasible to do so. In spite of adopting the most up-to-date method of fire risk management, there are always occasions when the fire protection facilities provided on the premises fall short of actual needs. For such occasions, it is desirable to preplan a mutual assistance programme with the public fire department. Good liaison with that department is necessary so that the management knows what assistance that unit can provide during an emergency on its premises. Also, the public fire department must become familiar with the risk and what it could expect during an emergency. Frequent interaction with the public fire department is necessary for this purpose.
Handling of Hazardous Materials
Hazards of the materials used in industry may not be known to fire-fighters during a spill situation, and accidental discharge and improper use or storage of hazardous materials can lead to dangerous situations that can seriously imperil their health or lead to a serious fire or explosion. It is not possible to remember the hazards of all materials. Means of ready identification of hazards have, therefore, been developed whereby the various substances are identified by distinct labels or markings.
Hazardous materials identification
Each country follows its own rules concerning the labelling of hazardous materials for the purpose of storage, handling and transportation, and various departments may be involved. While compliance with local regulations is essential, it is desirable that an internationally recognized system of identification of hazardous materials be evolved for universal application. In the United States, the NFPA has developed a system for this purpose. In this system, distinct labels are conspicuously attached or affixed to containers of hazardous materials. These labels indicate the nature and degree of hazards in respect of health, flammability and the reactive nature of the material. In addition, special possible hazards to fire-fighters can also be indicated on these labels. For an explanation of the degree of hazard, refer to NFPA 704, Standard System for the Identification of the Fire Hazards of Materials (1990a). In this system, the hazards are categorized as health hazards, flammability hazards, and reactivity (instability) hazards.
Health hazards
These include all possibilities of a material causing personal injury from contact with or absorption into the human body. A health hazard may arise out of the inherent properties of the material or from the toxic products of combustion or decomposition of the material. The degree of hazard is assigned on the basis of the greater hazard that may result under fire or other emergency conditions. It indicates to fire-fighters whether they can work safely only with special protective clothing or with suitable respiratory protective equipment or with ordinary clothing.
Degree of health hazard is measured on a scale of 4 to 0, with 4 indicating the most severe hazard and 0 indicating low hazard or no hazard.
Flammability hazards
These indicate the susceptibility of the material to burning. It is recognized that materials behave differently in respect of this property under varying circumstances (e.g., materials that may burn under one set of conditions may not burn if the conditions are altered). The form and inherent properties of the materials influence the degree of hazard, which is assigned on the same basis as for the health hazard.
Reactivity (instability) hazards
Materials capable of releasing energy by itself, (i.e., by self-reaction or polymerization) and substances that can undergo violent eruption or explosive reactions on coming in contact with water, other extinguishing agents or certain other materials are said to possess a reactivity hazard.
The violence of reaction may increase when heat or pressure is applied or when the substance comes in contact with certain other materials to form a fuel-oxidizer combination, or when it comes in contact with incompatible substances, sensitizing contaminants or catalysts.
The degree of reactivity hazard is determined and expressed in terms of the ease, rate and quantity of energy release. Additional information, such as radioactivity hazard or prohibition of water or other extinguishing medium for fire-fighting, can also be given on the same level.
The label warning of a hazardous material is a diagonally placed square with four smaller squares (see figure 1).
Figure 1. The NFPA 704 diamond.
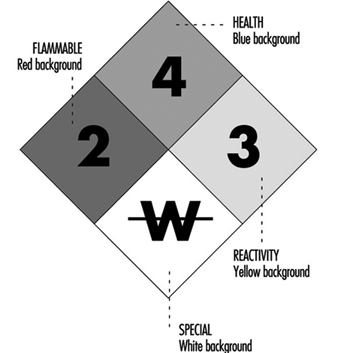
The top square indicates the health hazard, the one on the left indicates the flammability hazard, the one on the right indicates the reactivity hazard, and the bottom square indicates other special hazards, such as radioactivity or unusual reactivity with water.
To supplement the above mentioned arrangement, a colour code may also be used. The colour is used as background or the numeral indicating the hazard may be in coded colour. The codes are health hazard (blue), flammability hazard (red), reactivity hazard (yellow) and special hazard (white background).
Managing hazardous materials response
Depending on the nature of the hazardous material in the industry, it is necessary to provide protective equipment and special fire-extinguishing agents, including the protective equipment required to dispense the special extinguishing agents.
All workers must be trained in the precautions they must take and the procedures they must adopt to deal with each incident in the handling of the various types of hazardous materials. They must also know the meaning of the various identification signs.
All fire-fighters and other workers must be trained in the correct use of any protective clothing, protective respiratory equipment and special fire-fighting techniques. All concerned personnel must be kept alert and prepared to tackle any situation through frequent drills and exercises, of which proper records should be kept.
To deal with serious medical hazards and the effects of these hazards on fire-fighters, a competent medical officer should be available to take immediate precautions when any individual is exposed to unavoidable dangerous contamination. All affected persons must receive immediate medical attention.
Proper arrangements must also be made to set up a decontamination centre on the premises when necessary, and correct decontamination procedures must be laid down and followed.
Waste control
Considerable waste is generated by industry or because of accidents during handling, transportation and storage of goods. Such waste may be flammable, toxic, corrosive, pyrophoric, chemically reactive or radioactive, depending upon the industry in which it is generated or the nature of goods involved. In most cases unless proper care is taken in safe disposal of such waste, it may endanger animal and human life, pollute the environment or cause fire and explosions that may endanger property. A thorough knowledge of the physical and chemical properties of the waste materials and of the merits or limitations of the various methods of their disposal is, therefore, necessary to ensure economy and safety.
Properties of industrial waste are briefly summarized below:
- Most industrial waste is hazardous and can have unexpected significance during and after disposal. The nature and behavioural characteristics of all waste must therefore be carefully examined for their short- and long-term impact and the method of disposal determined accordingly.
- Mixing of two seemingly innocuous discarded substances may create an unexpected hazard because of their chemical or physical interaction.
- Where flammable liquids are involved, their hazards can be assessed by taking into consideration their respective flash points, ignition temperature, flammability limits and the ignition energy required to initiate combustion. In the case of solids, particle size is an additional factor that must be considered.
- Most flammable vapours are heavier than air. Such vapours and heavier-than-air flammable gases that may be accidentally released during collection or disposal or during handling and transportation can travel considerable distances with the wind or towards a lower gradient. On coming in contact with a source of ignition, they flash back to source. Major spills of flammable liquids are particularly hazardous in this respect and may require evacuation to save lives.
- Pyrophoric materials, such as aluminium alkyls, ignite spontaneously when exposed to air. Special care must therefore be taken in handling, transportation, storage and disposal of such materials, preferably carried out under a nitrogen atmosphere.
- Certain materials, such as potassium, sodium and aluminium alkyls, react violently with water or moisture and burn fiercely. Bronze powder generates considerable heat in the presence of moisture.
- The presence of potent oxidants with organic materials can cause rapid combustion or even an explosion. Rags and other materials soaked with vegetable oils or terpenes present a risk of spontaneous combustion due to the oxidation of oils and subsequent build-up of heat to the ignition temperature.
- Several substances are corrosive and may cause severe damage or burns to skin or other living tissues, or may corrode construction materials, especially metals, thereby weakening the structure in which such materials may have been used.
- Some substances are toxic and can poison humans or animals by contact with skin, inhalation or contamination of food or water. Their ability to do so may be short lived or may extend over a long period. Such substances, if disposed of by dumping or burning, can contaminate water sources or come into contact with animals or workers.
- Toxic substances that are spilled during industrial processing, transportation (including accidents), handling or storage, and toxic gases that are released into the atmosphere can affect emergency personnel and others, including the public. The hazard is all the more severe if the spilled substance(s) is vaporized at ambient temperature, because the vapours can be carried over long distances due to wind drift or run-off.
- Certain substances may emit a strong, pungent or unpleasant odour, either by themselves or when they are burnt in the open. In either case, such substances are a public nuisance, even though they may not be toxic, and they must be disposed of by proper incineration, unless it is possible to collect and recycle them. Just as odorous substances are not necessarily toxic, odourless substances and some substances with a pleasant odour may produce harmful physiological effects.
- Certain substances, such as explosives, fireworks, organic peroxides and some other chemicals, are sensitive to heat or shock and may explode with devastating effect if not handled carefully or mixed with other substances. Such substances must, therefore, be carefully segregated and destroyed under proper supervision.
- Waste materials that are contaminated with radioactivity can be as hazardous as the radioactive materials themselves. Their disposal requires specialized knowledge. Proper guidance for disposal of such waste may be obtained from a country’s nuclear energy organization.
Some of the methods that may be employed to dispose of industrial and emergency waste are biodegradation, burial, incineration, landfill, mulching, open burning, pyrolysis and disposal through a contractor. These are briefly explained below.
Biodegradation
Many chemicals are completely destroyed within six to 24 months when they are mixed with the top 15 cm of soil. This phenomenon is known as biodegradation and is due to the action of soil bacteria. Not all substances, however, behave in this way.
Burial
Waste, particularly chemical waste, is often disposed of by burial. This is a dangerous practice in so far as active chemicals are concerned, because, in time, the buried substance may get exposed or leached by rain into water resources. The exposed substance or the contaminated material can have adverse physiological effects when it comes in contact with water that is drunk by humans or animals. Cases are on record in which water was contaminated 40 years after burial of certain harmful chemicals.
Incineration
This is one of the safest and most satisfactory methods of waste disposal if the waste is burned in a properly designed incinerator under controlled conditions. Care must be taken, however, to ensure that the substances contained in the waste are amenable to safe incineration without posing any operating problem or special hazard. Almost all industrial incinerators require the installation of air pollution control equipment, which must be carefully selected and installed after taking into consideration the composition of the stock effluent given out by the incinerator during the burning of industrial waste.
Care must be taken in the operation of the incinerator to ensure that its operative temperature does not rise excessively either because a large amount of volatiles is fed or because of the nature of the waste burned. Structural failure can occur because of excessive temperature, or, over time, because of corrosion. The scrubber must also be periodically inspected for signs of corrosion which can occur because of contact with acids, and the scrubber system must be maintained regularly to ensure proper functioning.
Landfill
Low-lying land or a depression in land is often used as a dump for waste materials until it becomes level with the surrounding land. The waste is then levelled, covered with earth and rolled hard. The land is then used for buildings or other purposes.
For satisfactory landfill operation, the site must be selected with due regard to the proximity of pipelines, sewer lines, power lines, oil and gas wells, mines and other hazards. The waste must then be mixed with earth and evenly spread out in the depression or a wide trench. Each layer must be mechanically compacted before the next layer is added.
A 50 cm layer of earth is typically laid over the waste and compacted, leaving sufficient vents in the soil for the escape of gas that is produced by biological activity in the waste. Attention must also be paid to proper drainage of the landfill area.
Depending on the various constituents of waste material, it may at times ignite within the landfill. Each such area must, therefore, be properly fenced off and continued surveillance maintained until the chances of ignition appear to be remote. Arrangements must also be made for extinguishing any fire that may break out in the waste within the landfill.
Mulching
Some trials have been made for reusing polymers as mulch (loose material for protecting the roots of plants) by chopping the waste into small shreds or granules. When so used, it degrades very slowly. Its effect on the soil is, therefore, purely physical. This method has, however, not been used widely.
Open burning
Open burning of waste causes pollution of the atmosphere and is hazardous in as much as there is a chance of the fire getting out of control and spreading to the surrounding property or areas. Also, there is a chance of explosion from containers, and there is a possibility of harmful physiological effects of radioactive materials that may be contained in the waste. This method of disposal has been banned in some countries. It is not a desirable method and should be discouraged.
Pyrolysis
Recovery of certain compounds, by distillation of the products given out during pyrolysis (decomposition by heating) of polymers and organic substances, is possible, but not yet widely adopted.
Disposal through contractors
This is probably the most convenient method. It is important that only reliable contractors who are knowledgeable and experienced in the disposal of industrial waste and hazardous materials are selected for the job. Hazardous materials must be carefully segregated and disposed of separately.
Specific classes of materials
Specific examples of the types of hazardous materials that are often found in today’s industry include: (1) combustible and reactive metals, such as magnesium, potassium, lithium, sodium, titanium and zirconium; (2) combustible refuse; (3) drying oils; (4) flammable liquids and waste solvents; (5) oxidizing materials (liquids and solids); and (6) radioactive materials. These materials require special handling and precautions that must be carefully studied. For more details on identification of hazardous materials and hazards of industrial materials, the following publications may be consulted: Fire Protection Handbook (Cote 1991) and Sax’s Dangerous Properties of Industrial Materials (Lewis 1979).
Active Fire Protection Measures
Life Safety and Property Protection
As the primary importance of any fire protection measure is to provide an acceptable degree of life safety to inhabitants of a structure, in most countries legal requirements applying to fire protection are based on life safety concerns. Property protection features are intended to limit physical damage. In many cases these objectives are complementary. Where concern exists with the loss of property, its function or contents, an owner may choose to implement measures beyond the required minimum necessary to address life safety concerns.
Fire Detection and Alarm Systems
A fire detection and alarm system provides a means to detect fire automatically and to warn building occupants of the threat of fire. It is the audible or visual alarm provided by a fire detection system that is the signal to begin the evacuation of the occupants from the premises. This is especially important in large or multi-storey buildings where occupants would be unaware that a fire was underway within the structure and where it would be unlikely or impractical for warning to be provided by another inhabitant.
Basic elements of a fire detection and alarm system
A fire detection and alarm system may include all or some of the following:
- a system control unit
- a primary or main electrical power supply
- a secondary (stand-by) power supply, usually supplied from batteries or an emergency generator
- alarm-initiating devices such as automatic fire detectors, manual pull stations and/or sprinkler system flow devices, connected to “initiating circuits” of the system control unit
- alarm-indicating devices, such as bells or lights, connected to “indicating circuits” of the system control unit
- ancillary controls such as ventilation shut-down functions, connected to output circuits of the system control unit
- remote alarm indication to an external response location, such as the fire department
- control circuits to activate a fire protection system or smoke control system.
Smoke Control Systems
To reduce the threat of smoke from entering exit paths during evacuation from a structure, smoke control systems can be used. Generally, mechanical ventilation systems are employed to supply fresh air to the exit path. This method is most often used to pressurize stairways or atrium buildings. This is a feature intended to enhance life safety.
Portable Fire Extinguishers and Hose Reels
Portable fire extinguishers and water hose reels are often provided for use by building occupants to fight small fires (see figure 1). Building occupants should not be encouraged to use a portable fire extinguisher or hose reel unless they have been trained in their use. In all cases, operators should be very cautious to avoid placing themselves in a position where safe egress is blocked. For any fire, no matter how small, the first action should always be to notify other building occupants of the threat of fire and summon assistance from the professional fire service.
Figure 1. Portable fire extinguishers.
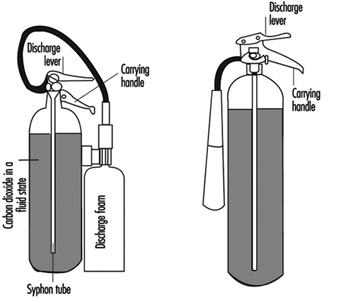
Water Sprinkler Systems
Water sprinkler systems consist of a water supply, distribution valves and piping connected to automatic sprinkler heads (see figure 2). While current sprinkler systems are primarily intended to control the spread of fire, many systems have accomplished complete extinguishment.
Figure 2. A typical sprinkler installation showing all common water supplies, outdoor hydrants and underground piping.
A common misconception is that all automatic sprinkler heads open in the event of a fire. In fact, each sprinkler head is designed to open only when sufficient heat is present to indicate a fire. Water then flows only from the sprinkler head(s) that have opened as the result of fire in their immediate vicinity. This design feature provides efficient use of water for fire-fighting and limits water damage.
Water supply
Water for an automatic sprinkler system must be available in sufficient quantity and at sufficient volume and pressure at all times to ensure reliable operation in the event of fire. Where a municipal water supply cannot meet this requirement, a reservoir or pump arrangement must be provided to provide a secure water supply.
Control valves
Control valves should be maintained in the open position at all times. Often, supervision of the control valves can be accomplished by the automatic fire alarm system by provision of valve tamper switches that will initiate a trouble or supervisory signal at the fire alarm control panel to indicate a closed valve. If this type of monitoring cannot be provided, the valves should be locked in the open position.
Piping
Water flows through a piping network, ordinarily suspended from the ceiling, with the sprinkler heads suspended at intervals along the pipes. Piping used in sprinkler systems should be of a type that can withstand a working pressure of not less than 1,200 kPa. For exposed piping systems, fittings should be of the screwed, flanged, mechanical joint or brazed type.
Sprinkler heads
A sprinkler head consists of an orifice, normally held closed by a temperature-sensitive releasing element, and a spray deflector. The water discharge pattern and spacing requirements for individual sprinkler heads are used by sprinkler designers to ensure complete coverage of the protected risk.
Special Extinguishing Systems
Special extinguishing systems are used in cases where water sprinklers would not provide adequate protection or where the risk of damage from water would be unacceptable. In many cases where water damage is of concern, special extinguishing systems may be used in conjunction with water sprinkler systems, with the special extinguishing system designed to react at an early stage of fire development.
Water and water-additive special extinguishing systems
Water spray systems
Water spray systems increase the effectiveness of water by producing smaller water droplets, and thus a greater surface area of water is exposed to the fire, with a relative increase in heat absorption capability. This type of system is often chosen as a means of keeping large pressure vessels, such as butane spheres, cool when there is a risk of an exposure fire originating in an adjacent area. The system is similar to a sprinkler system; however, all heads are open, and a separate detection system or manual action is used to open control valves. This allows water to flow through the piping network to all spray devices that serve as outlets from the piping system.
Foam systems
In a foam system, a liquid concentrate is injected into the water supply before the control valve. Foam concentrate and air are mixed, either through the mechanical action of discharge or by aspirating air into the discharge device. The air entrained in the foam solution creates an expanded foam. As expanded foam is less dense than most hydrocarbons, the expanded foam forms a blanket on top of the flammable liquid. This foam blanket reduces fuel vapour propagation. Water, which represents as much as 97% of the foam solution, provides a cooling effect to further reduce vapour propagation and to cool hot objects that could serve as a source of re-ignition.
Gaseous extinguishing systems
Carbon dioxide systems
Carbon dioxide systems consist of a supply of carbon dioxide, stored as liquified compressed gas in pressure vessels (see figures 3 and 4). The carbon dioxide is held in the pressure vessel by means of an automatic valve that is opened upon fire by means of a separate detection system or by manual operation. Once released, the carbon dioxide is delivered to the fire by means of a piping and discharge nozzle arrangement. Carbon dioxide extinguishes fire by displacing the oxygen available to the fire. Carbon dioxide systems can be designed for use in open areas such as printing presses or enclosed volumes such as ship machinery spaces. Carbon dioxide, at fire-extinguishing concentrations, is toxic to people, and special measures must be employed to ensure that persons in the protected area are evacuated before discharge occurs. Pre-discharge alarms and other safety measures must be carefully incorporated into the design of the system to ensure adequate safety for people working in the protected area. Carbon dioxide is considered to be a clean extinguishant because it does not cause collateral damage and is electrically non-conductive.
Figure 3. Diagram of a high-pressure carbon dioxide system for total flooding.
Figure 4. A total flooding system installed in a room with a raised floor.
Inert gas systems
Inert gas systems generally use a mixture of nitrogen and argon as an extinguishing medium. In some cases, a small percentage of carbon dioxide is also provided in the gas mixture. The inert gas mixtures extinguish fires by reducing oxygen concentration within a protected volume. They are suitable for use in enclosed spaces only. The unique feature offered by inert gas mixtures is that they reduce the oxygen to a low enough concentration to extinguish many types of fires; however, oxygen levels are not sufficiently lowered to pose an immediate threat to occupants of the protected space. The inert gases are compressed and stored in pressure vessels. System operation is similar to a carbon dioxide system. As the inert gases cannot be liquefied by compression, the number of storage vessels required for protection of a given enclosed protected volume is greater than that for carbon dioxide.
Halon systems
Halons 1301, 1211 and 2402 have been identified as ozone-depleting substances. Production of these extinguishing agents ceased in 1994, as required by the Montreal Protocol, an international agreement to protect the earth’s ozone layer. Halon 1301 was most often used in fixed fire protection systems. Halon 1301 was stored as liquefied, compressed gas in pressure vessels in a similar arrangement to that used for carbon dioxide. The advantage offered by halon 1301 was that storage pressures were lower and that very low concentrations provided effective extinguishing capability. Halon 1301 systems were used successfully for totally enclosed hazards where the extinguishing concentration achieved could be maintained for a sufficient time for extinguishment to occur. For most risks, concentrations used did not pose an immediate threat to occupants. Halon 1301 is still used for several important applications where acceptable alternatives have yet to be developed. Examples include use on-board commercial and military aircraft and for some special cases where inerting concentrations are required to prevent explosions in areas where occupants could be present. The halon in existing halon systems that are no longer required should be made available for use by others with critical applications. This will militate against the need to produce more of these environmentally sensitive extinguishers and help protect the ozone layer.
Halocarbon systems
Halocarbon agents were developed as the result of the environmental concerns associated with halons. These agents differ widely in toxicity, environmental impact, storage weight and volume requirements, cost and availability of approved system hardware. They all can be stored as liquefied compressed gases in pressure vessels. System configuration is similar to a carbon dioxide system.
Design, Installation and Maintenance of Active Fire Protection Systems
Only those skilled in this work are competent to design, install and maintain this equipment. It may be necessary for many of those charged with purchasing, installing, inspecting, testing, approving and maintaining this equipment to consult with an experienced and competent fire protection specialist to discharge their duties effectively.
Further Information
This section of the Encyclopaedia presents a very brief and limited overview of the available choice of active fire protection systems. Readers may often obtain more information by contacting a national fire protection association, their insurer or the fire prevention department of their local fire service.
Planning for and Management of Radiation Accidents
This article describes several significant radiation accidents, their causes and the responses to them. A review of the events leading up to, during and following these accidents can provide planners with information to preclude future occurrences of such accidents and to enhance an appropriate, rapid response in the event a similar accident occurs again.
Acute Radiation Death Resulting from an Accidental Nuclear Critical Excursion on 30 December 1958
This report is noteworthy because it involved the largest accidental dose of radiation received by humans (to date) and because of the extremely professional and thorough work-up of the case. This represents one of the best, if not the best, documented acute radiation syndrome descriptions that exists (JOM 1961).
At 4:35 p.m. on 30 December 1958, an accidental critical excursion resulting in fatal radiation injury to an employee (K) took place in the plutonium recovery plant at the Los Alamos National Laboratory (New Mexico, United States).
The time of the accident is important because six other workers had been in the same room with K thirty minutes earlier. The date of the accident is important because the normal flow of fissionable material into the system was interrupted for year-end physical inventory. This interruption caused a routine procedure to become non-routine and led to an accidental “criticality” of the plutonium-rich solids that were accidentally introduced into the system.
Summary of estimates of K’s radiation exposure
The best estimate of K’s average total-body exposure was between 39 and 49 Gy, of which about 9 Gy was due to fission neutrons. A considerably greater portion of the dose was delivered to the upper half of the body than to the lower half. Table 1 shows an estimate of K’s radiation exposure.
Table 1. Estimates of K’s radiation exposure
|
Region and conditions |
Fast neutron |
Gamma |
Total |
|
Head (incident) |
26 |
78 |
104 |
|
Upper abdomen |
30 |
90 |
124 |
|
Total body (average) |
9 |
30-40 |
39-49 |
Clinical course of patient
In retrospect, the clinical course of patient K can be divided into four distinct periods. These periods differed in duration, symptoms and response to supportive therapy.
The first period, lasting from 20 to 30 minutes, was characterized by his immediate physical collapse and mental incapacitation. His condition progressed to semi-consciousness and severe prostration.
The second period lasted about 1.5 hours and began with his arrival by stretcher at the emergency room of the hospital and ended with his transfer from the emergency room to the ward for further supportive therapy. This interval was characterized by such severe cardiovascular shock that death seemed imminent during the whole time. He seemed to be suffering severe abdominal pain.
The third period was about 28 hours long and was characterized by enough subjective improvement to encourage continued attempts to alleviate his anoxia, hypotension and circulatory failure.
The fourth period began with the unheralded onset of rapidly increasing irritability and antagonism, bordering on mania, followed by coma and death in approximately 2 hours. The entire clinical course lasted 35 hours from the time of radiation exposure to death.
The most dramatic clinicopathological changes were observed in the haemopoietic and urinary systems. Lymphocytes were not found in the circulating blood after the eighth hour, and there was virtually complete urinary shutdown despite administration of large amount of fluids.
K’s rectal temperature varied between 39.4 and 39.7°C for the first 6 hours and then fell precipitously to normal, where it remained for the duration of his life. This high initial temperature and its maintenance for 6 hours were considered in keeping with his suspected massive dose of radiation. His prognosis was grave.
Of all the various determinations made during the course of the illness, changes in white cell count were found to be the simplest and best prognostic indicator of severe irradiation. The virtual disappearance of lymphocytes from the peripheral circulation within 6 hours of exposure was considered a grave sign.
Sixteen different therapeutic agents were employed in the symptomatic treatment of K over about a 30-hour period. In spite of this and continued oxygen administration, his heart tones became very distant, slow and irregular about 32 hours after irradiation. His heart then became progressively weaker and suddenly stopped 34 hours 45 minutes after irradiation.
Windscale Reactor No. 1 Accident of 9-12 October 1957
Windscale reactor No. 1 was an air-cooled, graphite-moderated natural uranium-fuelled plutonium production reactor. The core was partially ruined by fire on 15 October 1957. This fire resulted in a release of approximately 0.74 PBq (10+15 Bq) of iodine-131 (131I) to the downwind environment.
According to a US Atomic Energy Commission accident information report about the Windscale incident, the accident was caused by operator judgement errors concerning thermocouple data and was made worse by faulty handling of the reactor that permitted the graphite temperature to rise too rapidly. Also contributory was the fact that fuel temperature thermocouples were located in the hottest part of the reactor (that is, where the highest dose rates occurred) during normal operations rather than in parts of the reactor which were hottest during an abnormal release. A second equipment deficiency was the reactor power meter, which was calibrated for normal operations and read low during the annealing. As a result of the second heating cycle, the graphite temperature rose on 9 October, especially in the lower front part of the reactor where some cladding had failed because of the earlier rapid temperature rise. Although there were a number of small iodine releases on 9 October, the releases were not recognized until 10 October when the stack activity meter showed a significant increase (which was not regarded as highly significant). Finally, on the afternoon of 10 October, other monitoring (Calder site) indicated the release of radioactivity. Efforts to cool the reactor by forcing air through it not only failed but actually increased the magnitude of the radioactivity released.
The estimated releases from the Windscale accident were 0.74 PBq of 131I, 0.22 PBq of caesium-137 (137Cs), 3.0 TBq (1012Bq) of strontium-89 (89Sr), and 0.33 TBq of strontium-90
(90Sr). The highest offsite gamma absorbed dose rate was about 35 μGy/h due to airborne activity. Air activity readings around the Windscale and Calder plants often were 5 to 10 times the maximum permissible levels, with occasional peaks of 150 times permissible levels. A milk ban extended over a radius of approximately 420 km.
During operations to bring the reactor under control, 14 workers received dose equivalents greater than 30 mSv per calendar quarter, with the maximum dose equivalent at 46 mSv per calendar quarter.
Lessons learned
There were many lessons learned concerning natural uranium reactor design and operation. The inadequacies concerning reactor instrumentation and reactor operator training also bring up points analogous to the Three Mile Island accident (see below).
No guidelines existed for short-term permissible exposure to radioiodine in food. The British Medical Research Council performed a prompt and thorough investigation and analysis. Much ingenuity was used in promptly deriving maximum permissible concentrations for 131I in food. The study Emergency Reference Levels that resulted from this accident serves as a basis for emergency planning guides now used worldwide (Bryant 1969).
A useful correlation was derived for predicting significant radioiodine contamination in milk. It was found that gamma radiation levels in pastures which exceeded 0.3 μGy/h yielded milk which exceeded 3.7 MBq/m3.
Absorbed dose from inhalation of external exposure to radioiodines is negligible compared to that from drinking milk or eating dairy products. In an emergency, rapid gamma spectroscopy is preferable to slower laboratory procedures.
Fifteen two-person teams performed radiation surveys and obtained samples. Twenty persons were used for sample coordination and data reporting. About 150 radiochemists were involved in sampling analysis.
Glass wool stack filters are not satisfactory under accident conditions.
Gulf Oil Accelerator Accident of 4 October 1967
Gulf Oil Company technicians were using a 3 MeV Van de Graaff accelerator for the activation of soil samples on 4 October 1967. The combination of an interlock failure on the power key of the accelerator console and the taping of several of the interlocks on the safety tunnel door and the target room inside door produced serious accidental exposures to three individuals. One individual received approximately 1 Gy whole-body dose equivalent, the second received close to 3 Gy whole-body dose equivalent and the third received approximately 6 Gy whole-body dose equivalent, in addition to approximately 60 Gy to the hands and 30 Gy to the feet.
One of the accident victims reported to the medical department, complaining of nausea, vomiting and generalized muscular aches. His symptoms initially were misdiagnosed as flu symptoms. When the second patient came in with approximately the same symptoms, it was decided that they may possibly have received significant radiation exposures. Film badges verified this. Dr. Niel Wald, University of Pittsburgh Radiological Health Division, supervised the dosimetry tests and also acted as coordinating physician in the work-up and treatment of the patients.
Dr. Wald very quickly had absolute filter units flown in to the western Pennsylvania hospital in Pittsburgh where the three patients had been admitted. He set up these absolute filter/laminar flow filters to clean the patients’ environment of all biological contaminants. These “reverse isolation” units were used on the 1 Gy exposure patient for about 16 days, and on the 3 and 6 Gy exposure patients for about a month and half.
Dr. E. Donnal Thomas from the University of Washington arrived to perform a bone marrow transplant on the 6 Gy patient on the eighth day after exposure. The patient’s twin brother served as the bone marrow donor. Although this heroic medical treatment saved the 6 Gy patient’s life, nothing could be done to save his arms and legs, each of which received tens-of-gray absorbed dose.
Lessons learned
If the simple operating procedure of always using a survey meter when entering the exposure room had been followed, this tragic accident would have been avoided.
At least two interlocks had been taped closed for long periods of time prior to this accident. Defeating of protective interlocks is intolerable.
Regular maintenance checks should have been made on the key-operated power interlocks for the accelerator.
Timely medical attention saved the life of the person with the highest exposure. The heroic procedure of a complete bone marrow transplant together with the use of reverse isolation and quality medical care were all major factors in saving this person’s life.
Reverse isolation filters can be obtained in a matter of hours to be set up in any hospital to care for highly exposed patients.
In retrospect, medical authorities involved with these patients would have recommended amputation earlier and at a definitive level within two or three months after the exposure. Earlier amputation decreases the likelihood of infection, gives a shorter period of severe pain, reduces pain medication required for the patient, possibly reduces the patient’s hospital stay, and possibly contributes to earlier rehabilitation. Earlier amputation should, of course, be done while correlating dosimetry information with clinical observations.
The SL–1 Prototype Reactor Accident (Idaho, USA, 3 January 1961)
This is the first (and to date the only) fatal accident in the history of US reactor operations. The SL-1 is a prototype of a small Army Package Power Reactor (APPR) designed for air transportation to remote areas for production of electrical power. This reactor was used for fuel testing, and for reactor crew training. It was operated in the remote desert location of the National Reactor Testing Station in Idaho Falls, Idaho, by Combustion Engineering for the US Army. The SL-1 was not a commercial power reactor (AEC 1961; American Nuclear Society 1961).
At the time of the accident, the SL-1 was loaded with 40 fuel elements and 5 control rod blades. It could produce a power level of 3 MW (thermal) and was a boiling water–cooled and –moderated reactor.
The accident resulted in the deaths of three military personnel. The accident was caused by the withdrawal of a single control rod for a distance of more than 1 m. This caused the reactor to go into prompt criticality. The reason why a skilled, licensed reactor operator with much refuelling operation experience withdrew the control rod past its normal stop point is unknown.
One of the three accident victims was still alive when initial response personnel first reached the scene of the accident. High activity fission products covered his body and were embedded in his skin. Portions of the victim’s skin registered in excess of 4.4 Gy/h at 15 cm and hampered rescue and medical treatment.
Lessons learned
No reactor designed since the SL-1 accident can be brought to “prompt-critical” state with a single control rod.
All reactors must have portable survey meters onsite that have ranges greater than 20 mGy/h. Survey meters of 10 Gy/h maximum range are recommended.
Note: The Three Mile Island accident showed that 100 Gy/h is the required range for both gamma and beta measurements.
Treatment facilities are required where a highly contaminated patient can receive definitive medical treatment with reasonable safeguards for attendant personnel. Since most of these facilities will be in clinics with other ongoing missions, control of airborne and waterborne radioactive contaminants may require special provisions.
X-ray Machines, Industrial and Analytical
Accidental exposures from x-ray systems are numerous and often involve extremely high exposures to small portions of the body. It is not unusual for x-ray diffraction systems to produce absorbed dose rates of 5 Gy/s at 10 cm from the tube focus. At shorter distances, 100 Gy/s rates have often been measured. The beam is usually narrow, but even a few seconds’ exposure can result in severe local injury (Lubenau et al. 1967; Lindell 1968; Haynie and Olsher 1981; ANSI 1977).
Because these systems are often used in “non-routine” circumstances, they lend themselves to the production of accidental exposures. X-ray systems commonly used in normal operations appear to be reasonably safe. Equipment failure has not caused severe exposures.
Lessons learned from accidental x-ray exposures
Most accidental exposures occurred during non-routine uses when equipment was partially disassembled or shield covers had been removed.
In most serious exposures, adequate instruction for the staff and maintenance personnel had been lacking.
If simple and fail-safe methods had been used to ensure that x-ray tubes were turned off during repairs and maintenance, many accidental exposures would have been avoided.
Finger or wrist personnel dosimeters should be used for operators and maintenance personnel working with these machines.
If interlocks had been required, many accidental exposures would have been avoided.
Operator error was a contributing cause in most of the accidents. Lack of adequate enclosures or poor shielding design often worsened the situation.
Industrial radiography accidents
From the 1950s through the 1970s, the highest radiation accident rate for a single activity has consistently been for industrial radiographic operations (IAEA 1969, 1977). National regulatory bodies continue to struggle to reduce the rate by a combination of improved regulations, strict training requirements and ever tougher inspection and enforcement policies (USCFR 1990). These regulatory efforts have generally succeeded, but many accidents associated with industrial radiography still occur. Legislation allowing huge monetary fines may be the most effective tool in keeping radiation safety focused in the minds of industrial radiography management (and also, therefore, in workers’ minds).
Causes of industrial radiography accidents
Worker training. Industrial radiography probably has lower education and training requirements than any other type of radiation employment. Therefore, existing training requirements must be strictly enforced.
Worker production incentive. For years, major emphasis for industrial radiographers was placed on the amount of successful radiographs produced per day. This practice can lead to unsafe acts as well as to occasional non-use of personnel dosimetry so that exceeding dose equivalent limits would not be detected.
Lack of proper surveys. Thorough surveying of source pigs (storage containers) (figure 1) after every exposure is most important. Not performing these surveys is the single most probable cause of unnecessary exposures, many of which are unrecorded, since industrial radiographers rarely use hand or finger dosimeters (figure 1).
Figure 1. Industrial radiography camera
Equipment problems. Because of heavy use of industrial radiographic cameras, source winding mechanisms can loosen and cause the source to not completely retract into its safe storage position (point A in figure 1). There are also many instances of closet-source interlock failures that cause accidental exposures of personnel.
Design of Emergency Plans
Many excellent guidelines, both general and specific, exist for the design of emergency plans. Some references are particularly helpful. These are given in the suggested readings at the end of this chapter.
Initial drafting of emergency plan and procedures
First, one must assess the entire radioactive material inventory for the subject facility. Then credible accidents must be analysed so that one can determine the probable maximum source release terms. Next, the plan and its procedures must enable the facility operators to:
- recognize an accident situation
- classify the accident according to severity
- take steps to mitigate the accident
- make timely notifications
- call for help efficiently and quickly
- quantify releases
- keep track of exposures both on- and offsite, as well as keep emergency exposures ALARA
- recover the facility as quickly as practical
- keep accurate and detailed records.
Types of accidents associated with nuclear reactors
A list, from most likely to least likely, of types of accidents associated with nuclear reactors follows. (The non-nuclear reactor, general-industrial type accident is by far the most likely.)
- Low level unexpected release of radioactive material with little or no external radiation exposure to personnel. Usually occurs during major overhauls or in shipment of spent resin or spent fuel. Coolant system leakage and coolant-sample sink spills are often causes of spread of radioactive contamination.
- Unexpected external exposure of personnel. This usually occurs during major overhauls or routine maintenance.
- A combination of contamination spread, contamination of personnel, and low-level personnel external radiation exposure is the next most likely accident. These accidents occur under the same conditions as 1 and 2 above.
- Gross surface contamination due to a major reactor coolant system leak or a leak of spent fuel coolant.
- Chips or large particles of activated CRUD (see definition below) in or on skin, ears or eyes.
- High-level radiation exposure of plant personnel. This is usually caused by carelessness.
- Release of small but greater than permissible quantities of radioactive wastes to outside the plant boundary. This is usually associated with human failures.
- Meltdown of reactor. Gross contamination offsite plus high personnel exposure would probably occur.
- Reactor excursion (SL–1 type of accident).
Radionuclides expected from water-cooled reactor accidents:
- activated corrosion and erosion products (commonly known as CRUD) in the coolant; for example, cobalt-60 or -58 (60Co, 58Co), iron-59 (59Fe), manganese-58 (58Mn) and tantalum-183 (183Ta)
- low level fission products usually present in the coolant; for example, iodine-131 (131I) and caesium-137 (137Cs)
- in boiling water reactors, 1 and 2 above plus continuous off-gassing of low levels of tritium
- (3H) and noble radioactive gases such as xenon-133 and -135 (133Xe, 135Xe), argon-41 (41Ar), and krypton-85 (85Kr)
- tritium (3H) manufactured inside the core at the rate of 1.3 × 10⁻⁴ atoms of 3H per fission (only a fraction of this leaves the fuel).
Figure 2. Example of a nuclear power plant emergency plan, table of contents
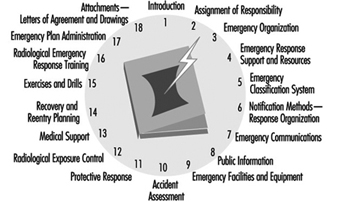
Typical Nuclear Power Plant Emergency Plan, Table of Contents
Figure 2 is an example of a table of contents for a nuclear power plant emergency plan. Such a plan should include each chapter shown and be tailored to meet local requirements. A list of typical power reactor implementation procedures is given in figure 3.
Figure 3. Typical power reactor implementation procedures
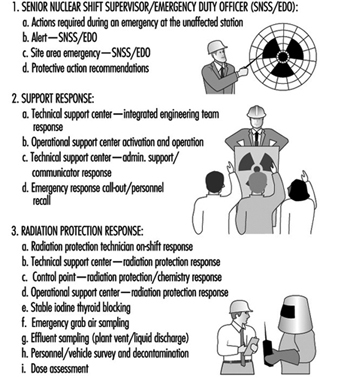
Radiological Environmental Monitoring during Accidents
This task is often called EREMP (Emergency Radiological Environmental Monitoring Programme) at large facilities.
One of the most important lessons learned for the US Nuclear Regulatory Commission and other government agencies from the Three Mile Island accident was that one cannot successfully implement EREMP in one or two days without extensive prior planning. Although the US government spent many millions of dollars monitoring the environment around the Three Mile Island nuclear station during the accident, less then 5% of the total releases were measured. This was due to poor and inadequate prior planning.
Designing Emergency Radiological Environmental Monitoring Programmes
Experience has shown that the only successful EREMP is one that is designed into the routine radiological environmental monitoring programme. During the early days of the Three Mile Island accident, it was learned that an effective EREMP cannot be established successfully in a day or two, no matter how much manpower and money are applied to the programme.
Sampling locations
All routine radiological environmental monitoring programme locations will be used during long-term accident monitoring. In addition, a number of new locations must be set up so that motorized survey teams have pre-determined locations in each portion of each 22½° sector (see figure 3). Generally, sampling locations will be in areas with roads. However, exceptions must be made for normally inaccessible but potentially occupied sites such as camp grounds and hiking trails within about 16 km downwind of the accident.
Figure 3. Sector and zone designations for radiological sampling and monitoring points within emergency planning zones
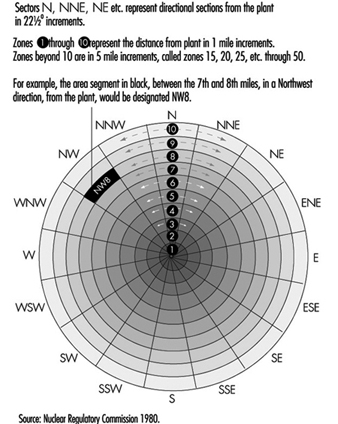
Figure 3 shows the sector and zone designation for radiation and environmental monitoring points. One may designate 22½° sectors by cardinal directions (for example, N, NNE, and NE) or by simple letters (for example, A through R). However, use of letters is not recommended because they are easily confused with directional notation. For example, it is less confusing to use the directional W for west rather than the letter N.
Each designated sample location should be visited during a practice drill so that people responsible for monitoring and sampling will be familiar with the location of each point and will be aware of radio “dead spaces,” poor roads, problems with finding the locations in the dark and so on. Since no drill will cover all the pre-designated locations within the 16 km emergency protection zone, drills must be designed so that all sample points will be visited eventually. It is often worthwhile to predetermine the ability of survey team vehicles to communicate with each pre-designated point. The actual locations of the sample points are chosen utilizing the same criteria as in the REMP (NRC 1980); for example, line of site, minimum exclusion area, closest individual, closest community, closest school, hospital, nursing home, milch animal herd, garden, farm and so on.
Radiological monitoring survey team
During an accident involving significant releases of radioactive materials, radiological monitoring teams should be continuously monitoring in the field. They also should continuously monitor onsite if conditions allow. Normally, these teams will monitor for ambient gamma and beta radiation and sample air for the presence of radioactive particulates and halogens.
These teams must be well trained in all monitoring procedures, including monitoring their own exposures, and be able to accurately relay these data to the base station. Details such as survey-meter type, serial number, and open-or closed-window status must be carefully reported on well-designed log sheets.
At the beginning of an emergency, an emergency monitoring team may have to monitor for 12 hours without a break. After the initial period, however, field time for the survey team should be decreased to eight hours with at least one 30 minute break.
Since continuous surveillance may be needed, procedures must be in place to supply the survey teams with food and drink, replacement instruments and batteries, and for back-and-forth transfer of air filters.
Even though survey teams will probably be working 12 hours per shift, three shifts a day are needed to provide continuous surveillance. During the Three Mile Island accident, a minimum of five monitoring teams was deployed at any one time for the first two weeks. The logistics for supporting such an effort must be carefully planned in advance.
Radiological environmental sampling team
The types of environmental samples taken during an accident depend on the type of releases (airborne versus water), direction of the wind and time of year. Soil and drinking water samples must be taken even in winter. Although radio-halogen releases may not be detected, milk samples should be taken because of the large bioaccumulation factor.
Many food and environmental samples must be taken to reassure the public even though technical reasons may not justify the effort. In addition, these data may be invaluable during any subsequent legal proceedings.
Pre-planned log sheets using carefully thought out offsite data procedures are essential for environmental samples. All persons taking environmental samples should have demonstrated a clear understanding of procedures and have documented field training.
If possible, offsite environmental sample data collection should be done by an independent offsite group. It is also preferable that routine environmental samples be taken by the same offsite group, so that the valuable onsite group may be used for other data collection during an accident.
It is notable that during the Three Mile Island accident every single environmental sample that should have been taken was collected, and not one environmental sample was lost. This occurred even though the sampling rate increased by a factor of more than ten over pre-accident sampling rates.
Emergency monitoring equipment
The inventory of emergency monitoring equipment should be at least double that needed at any given time. Lockers should be placed around nuclear complexes in various places so that no one accident will deny access to all of these lockers. To ensure readiness, equipment should be inventoried and its calibration checked at least twice a year and after each drill. Vans and trucks at large nuclear facilities should be completely outfitted for both on and offsite emergency surveillance.
Onsite counting laboratories may be unusable during an emergency. Therefore, prior arrangements must be made for an alternate or a mobile counting laboratory. This is now a requirement for US nuclear power plants (USNRC 1983).
The type and sophistication of environmental monitoring equipment should meet the requirements of attending the nuclear facility’s worst credible accident. Following is a list of typical environmental monitoring equipment required for nuclear power plants:
- Air sampling equipment should include units which are battery operated for short-term sampling and AC operable with strip chart recorders and alarm capabilities for longer-term surveillance.
- Liquid sampling equipment should contain continuous samplers. The samplers must be operable in the local environment, no matter how harsh it is.
- Portable gamma survey meters for implant work should have a maximum range of 100 Gy/h, and separate survey equipment should be able to measure beta radiation up to 100 Gy/h.
- Onsite, personnel dosimetry must include beta measurement capability, as well as finger thermoluminescent dosimeters (TLDs) (figure 4). Other extremity dosimetry also may be needed. Extra sets of control dosimeters are always needed in emergencies. A portable TLD reader may be needed to link with the station computer via telephone modem in emergency locations. In-house survey teams, such as rescue and repair teams, should have low- and high-range pocket dosimeters as well as pre-set alarm dosimeters. Careful thought must be given to pre-established dose levels for teams that may be in high radiation areas.
- Supplies of protective clothing should be supplied in emergency locations and in emergency vehicles. Extra back-up protective clothing should be available in case of accidents lasting for an extended period of time.
- Respiratory protection equipment should be in all emergency lockers and vehicles. Up-to-date lists of respiratory trained personnel should be kept in each of the major emergency equipment storage areas.
- Mobile vehicles equipped with radios are essential for emergency radiation monitoring survey teams. The location and availability of back-up vehicles must be known.
- Environmental survey team equipment should be stored in a convenient place, preferably offsite, so that it is always available.
- Emergency kits should be placed in the Technical Support Center and the Emergency Offsite Facility so that replacement survey teams need not go onsite in order to receive equipment and be deployed.
- For a severe accident involving the release of radioactive materials into the air, preparations must be in place for the use of helicopters and single-engine airplanes for airborne surveillance.
Figure 4. An industrial radiographer wearing a TLD badge and a ring thermoluminescent dosimeter (optional in the US)
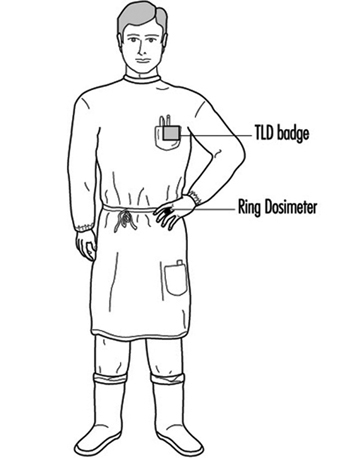
Data analysis
Environmental data analysis during a serious accident should be shifted as soon as possible to an offsite location such as the Emergency Offsite Facility.
Pre-set guidelines about when environmental sample data are to be reported to management must be established. The method and frequency for transfer of environmental sample data to governmental agencies should be agreed upon early in the accident.
Health Physics and Radiochemistry Lessons Learned from the Three Mile Island Accident
Outside consultants were needed to perform the following activities because plant health physicists were fully occupied by other duties during the early hours of the 28 March 1979 Three Mile Island accident:
- radioactive effluent release assessment (gaseous and liquid), including sample collection, coordination of laboratories for sample counting, quality control of laboratories, data collection, data analysis, report generation, distribution of data to government agencies and power plant owner
- dose assessment, including suspected and actual overexposure investigations, skin contamination and internal deposition investigations, significant exposure mock-ups, and dose calculations
- radiological environmental monitoring programme, including complete coordination of sample taking, data analysis, report generation and distribution, action-point notifications, expansion of programme for the accident situation and then contraction of the programme for up to one year after the accident
- special beta dosimetry studies, including studies of the state of the art in beta personnel monitoring, modelling of the beta dose to skin from radioactive contaminants, inter-comparisons of all commercially available beta-gamma TLD personnel dosimetry systems.
The above list includes examples of activities that the typical utility health physics staff cannot adequately accomplish during a serious accident. The Three Mile Island health physics staff was very experienced, knowledgeable and competent. They worked 15 to 20 hours per day for the first two weeks of the accident without a break. Yet, additional requirements caused by the accident were so numerous that they were unable to perform many important routine tasks that ordinarily would be performed easily.
Lessons learned from the Three Mile Island accident include:
Auxiliary building entry during accident
- All entries must be on a new radiation work permit reviewed by the senior health physicist onsite and signed by the unit superintendent or designated alternate.
- The appropriate control room should have absolute control over all Auxiliary and Fuel Handling Building entries. No entries must be allowed unless a health physicist is at the control point during the entry.
- No entries without a properly operating survey meter of appropriate range should be allowed. A spot check of meter response should be performed immediately prior to entry.
- Exposure history for all persons prior to their entry into a high radiation area must be obtained.
- Allowable exposures during entry, no matter how important the task should be designated.
Primary coolant sampling during accident
- All samples to be taken on a new radiation work permit should be reviewed by the senior health physicist onsite and signed by the unit superintendent or alternate.
- No coolant samples should be taken unless an extremity dosimeter is worn.
- No coolant samples should be taken without the availability of shielded gloves and tongs at least 60 cm long in case a sample is more radioactive than expected.
- No coolant samples should be taken without a leaded-glass personnel shield in place in case a sample is more radioactive than expected.
- Sample-taking should be discontinued if the exposure to an extremity or to the whole-body is likely to exceed pre-set levels stated on the radiation work permit.
- Significant exposures should be distributed among a number of workers if possible.
- All cases of skin contamination in excess of action levels within 24 hours should be reviewed.
Make-up valve room entry
- Beta and gamma area surveys using remote detectors with appropriate maximum range must be performed.
- Initial entry in an area with an absorbed dose rate of more than 20 mGy/h must have prior review to verify that exposure to radiation will be kept as low as reasonably achievable.
- When water leaks are suspected, possible floor contamination should be detected.
- A consistent programme for type and placement of personnel dosimetry must be put into operation.
- With persons entering an area with an absorbed dose rate of more than 20 mGy/h, TLDs must be assessed immediately after exit.
- It should be verified that all radiation work permit requirements are being carried out prior to entry into an area with an absorbed dose rate of more than 20 mGy/h.
- Controlled-time entries into hazardous areas must be timed by a health physicist.
Protective actions and offsite environmental surveillance from the local government’s perspective
- Before beginning a sampling protocol, criteria for stopping it should be established.
- Outside interference should not be allowed.
- Several confidential telephone lines should be in place. The numbers should be changed after each crisis.
- The capabilities of aerial measuring systems are better than most people think they are.
- A tape recorder should be in hand and data recorded regularly.
- While the acute episode is in progress, the reading of newspapers, watching television and listening to the radio should be abandoned as these activities only add to existing tensions.
- Food delivery and other comforts such as sleeping facilities should be planned for as it may be impossible to go home for a while.
- Alternate analytic capabilities should be planned for. Even a small accident can alter laboratory background radiation levels significantly.
- It should be noted that more energy will be expended in heading off unsound decisions than in dealing with real problems.
- It should be understood that emergencies cannot be managed from remote locations.
- It should be noted that protective action recommendations are not amenable to committee vote.
- All non-essential calls should be put on hold, time-wasters are to be hung up on.
The Goiânia Radiological Accident of 1985
A 51 TBq 137Cs teletherapy unit was stolen from an abandoned clinic in Goiânia, Brazil, on or around 13 September 1985. Two people looking for scrap metal took home the source assembly of the teletherapy unit and attempted to disassemble the parts. The absorbed dose rate from the source assembly was about 46 Gy/h at 1 m. They did not understand the meaning of the three-bladed radiation symbol on the source capsule.
The source capsule ruptured during disassembly. Highly soluble caesium-137 chloride (137CsCl) powder was disbursed throughout a part of this city of 1,000,000 people and caused one of the most serious sealed source accidents in history.
After the disassembly, remnants of the source assembly were sold to a junk dealer. He discovered that the 137CsCl powder glowed in the dark with a blue colour (presumably, this was Cerenkov radiation). He thought that the powder could be a gemstone or even supernatural. Many friends and relatives came to see the “wonderful” glow. Portions of the source were given to a number of families. This process continued for about five days. By this time a number of people had developed gastro-intestinal syndrome symptoms from radiation exposure.
Patients who went to the hospital with severe gastro-intestinal disorders were misdiagnosed as having allergic reactions to something they ate. A patient who had severe skin effects from handling the source was suspected of having some tropical skin disease and was sent to the Tropical Disease Hospital.
This tragic sequence of events continued undetected by knowledgeable personnel for about two weeks. Many people rubbed the 137CsCl powder on their skins so that they could glow blue. The sequence might have continued much longer except that one of the irradiated persons finally connected the illnesses with the source capsule. She took the remnants of the 137CsCl source on a bus to the Public Health Department in Goiânia where she left it. A visiting medical physicist surveyed the source the next day. He took actions on his own initiative to evacuate two junkyard areas and to inform authorities. The speed and overall size of response of the Brazilian government, once it became aware of the accident, were impressive.
About 249 people were contaminated. Fifty-four were hospitalized. Four people died, one of whom was a six-year-old girl who received an internal dose of about 4 Gy from ingesting about 1 GBq (109 Bq) of 137Cs.
Response to the accident
The objectives of the initial response phase were to:
- identify the main sites of contamination
- evacuate residences where levels of radioactivity exceeded the intervention levels adopted
- establish health physics controls around these areas, preventing access where necessary
- identify persons who had incurred significant doses or were contaminated.
The medical team initially:
- upon its arrival in Goiânia, took histories and triaged according to acute radiation syndrome symptoms
- sent all acute radiation patients to Goiânia Hospital (which was set up in advance for contamination and exposure control)
- transferred by air the next day the six most critical patients to the tertiary care center at a naval hospital in Rio de Janeiro (later eight more patients were transferred to this hospital)
- made arrangements for cytogenetic radiation dosimetry
- based medical management on each patient on that patient’s clinical course
- gave informal instruction to clinical laboratory staff to diminish their fears (the Goiânia medical community was reluctant to help).
Health physicists:
- assisted physicians in radiation dosimetry, bioassay and skin decontamination
- coordinated and interpreted analysis of 4,000 urine and faecal samples in a four-month period
- whole-body counted 600 individuals
- coordinated radio-contamination monitoring of 112,000 individuals (249 were contaminated)
- performed aerial survey of entire city and suburbs utilizing hastily assembled NaI detectors
- performed auto-mounted NaI detector surveys of over 2,000 km of roads
- set up action levels for decontamination of people, buildings, autos, soil and so on
- coordinated 550 workers employed in decontamination efforts
- coordinated demolition of seven houses and decontamination of 85 houses
- coordinated hauling of 275 truckloads of contaminated waste
- coordinated decontamination of 50 vehicles
- coordinated packaging of 3,500 cubic metres of contaminated waste
- utilized 55 survey meters, 23 contamination monitors and 450 self-reading dosimeters.
Results
Acute radiation syndrome patients
Four patients died as a result of absorbed doses ranging from 4 to 6 Gy. Two patients exhibited severe bone marrow depression, but lived in spite of absorbed doses of 6.2 and 7.1 Gy (cytogenetic estimate). Four patients survived with estimated absorbed doses from 2.5 to 4 Gy.
Radiation-induced skin injury
Nineteen of twenty hospitalized patients had radiation-induced skin injuries, which started with swelling and blistering. These lesions later ruptured and secreted fluid. Ten of the nineteen skin injuries developed deep lesions about four to five weeks after irradiation. These deep lesions were indicative of significant gamma exposure of deeper tissues.
All skin lesions were contaminated with 137Cs, with absorbed dose rates up to 15 mGy/h.
The six-year-old girl who ingested 1 TBq of 137Cs (and who died one month later) had generalized skin contamination that averaged 3 mGy/h.
One patient required an amputation about a month after exposure. Blood-pool imaging was useful in determining the demarcation between injured and normal arterioles.
Internal contamination result
Statistical tests showed no significant differences between body burdens determined by whole body counting as opposed to those determined by urinary excretion data.
Models that related bioassay data with intakes and body burden were validated. These models were also applicable for different age groups.
Prussian Blue was useful in promoting the elimination of 137CsCl from the body (if dosage was greater than 3 Gy/d).
Seventeen patients received diuretics for the elimination of 137CsCl body burdens. These diuretics were ineffective in de-corporating 137Cs and their use was stopped.
Skin decontamination
Skin decontamination using soap and water, acetic acid, and titanium dioxide (TiO2) was performed on all patients. This decontamination was only partly successful. It was surmised that sweating resulted in recontaminating the skin from the 137Cs body burden.
Contaminated skin lesions are very difficult to decontaminate. Sloughing of necrotic skin significantly reduced contamination levels.
Follow-up study on cytogenetic analysis dose assessment
Frequency of aberrations in lymphocytes at different times after the accident followed three main patterns:
In two cases the frequencies of incidence of aberrations remained constant up to one month after the accident and declined to about 30% of the initial frequency three months later.
In two cases a gradual decrease of about 20% every three months was found.
In two of the cases of highest internal contamination there were increases in the frequency of incidence of aberrations (by about 50% and 100%) over a three-month period.
Follow-up studies on 137Cs body burdens
- Patients’ actual committed doses followed by bioassay.
- Effects of Prussian Blue administration followed.
- In vivo measurements for 20 people made on blood samples, wounds and organs to look for non-homogenous distribution of 137Cs and its retention in body tissues.
- A woman and her newborn baby studied to look for retention and transfer by nursing.
Action levels for intervention
House evacuation was recommended for absorbed dose rates greater than 10 μGy/h at 1 m height inside the house.
Remedial decontamination of property, clothing, soil and food was based on a person not exceeding 5 mGy in a year. Applying this criterion for different pathways resulted in decontaminating the inside of a house if the absorbed dose could exceed 1 mGy in a year and decontaminating soil if the absorbed dose rate could exceed 4 mGy in a year (3 mGy from external radiation and 1 mGy from internal radiation).
The Chernobyl Nuclear Power Reactor Unit 4 Accident of 1986
General description of the accident
The world’s worst nuclear power reactor accident occurred on 26 April 1986 during a very low-powered electrical engineering test. In order to perform this test, a number of safety systems were switched off or blocked.
This unit was a model RBMK-1000, the type of reactor that produced about 65% of all nuclear power generated in the USSR. It was a graphite-moderated, boiling-water reactor that generated 1,000 MW of electricity (MWe). The RBMK-1000 does not have a pressure-tested containment building and is not commonly built in most countries.
The reactor went prompt critical and produced a series of steam explosions. The explosions blew off the entire top of the reactor, destroyed the thin structure covering the reactor, and started a series of fires on the thick asphalt roofs of units 3 and 4. Radioactive releases lasted for ten days, and 31 people died. The USSR delegation to the International Atomic Energy Agency studied the accident. They stated that the Chernobyl Unit 4 RBMK experiments that caused the accident had not received required approval and that the written rules on reactor safety measures were inadequate. The delegation further stated, “The staff involved were not adequately prepared for the tests and were not aware of the possible dangers.” This series of tests created the conditions for the emergency situation and led to a reactor accident which most believed could never occur.
Release of Chernobyl Unit 4 accident fission products
Total activity released
Roughly 1,900 PBq of fission products and fuel (which together were labelled corium by the Three Mile Island Accident Recovery Team) were released over the ten days that it took to put out all the fires and seal off Unit 4 with a neutron absorbing shielding material. Unit 4 is now a permanently sealed steel and concrete sarcophagus that properly contains the residual corium in and around the remains of the destroyed reactor core.
Twenty-five per cent of the 1,900 PBq was released on the first day of the accident. The rest was released during the next nine days.
The most radiologically significant releases were 270 PBq of 131I, 8.1 PBq of 90Sr and 37 PBq of 137Cs. This can be compared with the Three Mile Island accident, which released 7.4 TBq of 131I and no measurable 90Sr or 137Cs.
Environmental dispersion of radioactive materials
The first releases went in a generally northern direction, but subsequent releases went toward the westerly and southwesterly directions. The first plume arrived in Sweden and Finland on 27 April. Nuclear power plant radiological environmental monitoring programmes immediately discovered the release and alerted the world about the accident. Part of this first plume drifted into Poland and East Germany. Subsequent plumes swept into eastern and central Europe on 29 and 30 April. After this, the United Kingdom saw Chernobyl releases on 2 May, followed by Japan and China on 4 May, India on 5 May and Canada and the US on 5 and 6 May. The southern hemisphere did not report detecting this plume.
The deposition of the plume was governed mostly by precipitation. The fallout pattern of the major radionuclides (131I, 137Cs, 134Cs, and 90Sr) was highly variable, even within the USSR. The major risk came from external irradiation from surface deposition, as well as from ingestion of contaminated food.
Radiological consequences of the Chernobyl Unit 4 accident
General acute health consequences
Two persons died immediately, one during the building collapse and one 5.5 hours later from thermal burns. An additional 28 of the reactor’s staff and fire-fighting crew died from radiation injuries. Radiation doses to the offsite population were below levels that can cause immediate radiation effects.
The Chernobyl accident almost doubled the worldwide total of deaths due to radiation accidents through 1986 (from 32 to 61). (It is interesting to note that the three dead from the SL-1 reactor accident in the US are listed as due to a steam explosion and that the first two to die at Chernobyl are also not listed as radiation accident deaths.)
Factors which influenced onsite health consequences of the accident
Personnel dosimetry for the onsite persons at highest risk was not available. The absence of nausea or vomiting for the first six hours after exposure reliably indicated those patients who had received less than potentially fatal absorbed doses. This also was a good indication of patients who did not require immediate medical attention because of radiation exposure. This information together with blood data (decrease in lymphocyte count) was more useful than personnel dosimetry data.
Fire-fighters’ heavy protective garments (a porous canvas) allowed high specific activity fission products to contact bare skin. These beta doses caused severe skin burns and were a significant factor in many of the deaths. Fifty-six workers received severe skin burns. The burns were extremely difficult to treat and were a serious complicating element. They made it impossible to decontaminate the patients prior to transport to hospitals.
There were no clinically significant internal radioactive material body burdens at this time. Only two people had high (but not clinically significant) body burdens.
Of the about 1,000 people screened, 115 were hospitalized due to acute radiation syndrome. Eight medical attendants working onsite incurred the acute radiation syndrome.
As expected, there was no evidence of neutron exposure. (The test looks for sodium-24 (24Na) in blood.)
Factors which influenced offsite health consequences of the accident
Public protective actions can be divided into four distinct periods.
- The first 24 h: The downwind public remained indoors with doors and windows shut. Distribution of potassium iodide (KI) began in order to block thyroid uptake of 131I.
- One to seven days: Pripyat was evacuated after safe evacuation routes were established. Decontamination stations were established. The Kiev region was evacuated. The total number of people evacuated was more than 88,000.
- One to six weeks: The total number of evacuated people rose to 115,000. All these were medically examined and resettled. Potassium iodide was administered to 5.4 million Russians, including 1.7 million children. Thyroid doses were reduced by about 80 to 90%. Tens of thousands of cattle were removed from contaminated areas. Local milk and foodstuffs were banned over a large area (as dictated by derived intervention levels).
- After 6 weeks: The 30 km radius circle of evacuation was divided into three sub-zones: (a) a zone of 4 to 5 km where no public re-entry is expected in the foreseeable future, (b) a 5 to 10 km zone where limited public re-entry will be allowed after a specific time and (c) a 10 to 30 km zone where the public will eventually be allowed to return.
A great effort has been expended in decontaminating offsite areas.
The total radiological dose to the USSR population was reported by the United Nations Scientific Committee on the Effects of Atomic Radiation (UNSCEAR) to be 226,000 person-Sv (72,000 person-Sv committed during the first year). The worldwide estimated collective dose equivalent is on the order of 600,000 person-Sv. Time and further study will refine this estimate (UNSCEAR 1988).
International Organizations
International Atomic Energy Agency
P.O. Box 100
A-1400 Vienna
AUSTRIA
International Commission on Radiation Units and Measurements
7910 Woodmont Avenue
Bethesda, Maryland 20814
U.S.A.
International Commission on Radiological Protection
P.O. Box No. 35
Didcot, Oxfordshire
OX11 0RJ
U.K.
International Radiation Protection Association
Eindhoven University of Technology
P.O. Box 662
5600 AR Eindhoven
NETHERLANDS
United Nations Committee on the Effects of Atomic Radiation
BERNAM ASSOCIATES
4611-F Assembly Drive
Lanham, Maryland 20706-4391
U.S.A.
More...
Radiation Safety
This article describes aspects of radiation safety programmes. The objective of radiation safety is to eliminate or minimize harmful effects of ionizing radiation and radioactive material on workers, the public and the environment while allowing their beneficial uses.
Most radiation safety programmes will not have to implement every one of the elements described below. The design of a radiation safety programme depends on the types of ionizing radiation sources involved and how they are used.
Radiation Safety Principles
The International Commission on Radiological Protection (ICRP) has proposed that the following principles should guide the use of ionizing radiation and the application of radiation safety standards:
- No practice involving exposures to radiation should be adopted unless it produces sufficient benefit to the exposed individuals or to society to offset the radiation detriment it causes (the justification of a practice).
- In relation to any particular source within a practice, the magnitude of individual doses, the number of people exposed, and the likelihood of incurring exposures where these are not certain to be received should all be kept as low as reasonably achievable (ALARA), economic and social factors being taken into account. This procedure should be constrained by restrictions on the doses to individuals (dose constraints), so as to limit the inequity likely to result from the inherent economic and social judgements (the optimization of protection).
- The exposure of individuals resulting from the combination of all the relevant practices should be subject to dose limits, or to some control of risk in the case of potential exposures. These are aimed at ensuring that no individual is exposed to radiation risks that are judged to be unacceptable from these practices in any normal circumstances. Not all sources are susceptible of control by action at the source and it is necessary to specify the sources to be included as relevant before selecting a dose limit (individual dose and risk limits).
Radiation Safety Standards
Standards exist for radiation exposure of workers and the general public and for annual limits on intake (ALI) of radionuclides. Standards for concentrations of radionuclides in air and in water can be derived from the ALIs.
The ICRP has published extensive tabulations of ALIs and derived air and water concentrations. A summary of its recommended dose limits is in table 1.
Table 1. Recommended dose limits of the International Commission on Radiological Protection1
|
Application |
Dose limit |
|
|
Occupational |
Public |
|
|
Effective dose |
20 mSv per year averaged over |
1 mSv in a year3 |
|
Annual equivalent dose in: |
||
|
Lens of the eye |
150 mSv |
15 mSv |
|
Skin4 |
500 mSv |
50 mSv |
|
Hands and feet |
500 mSv |
- |
1 The limits apply to the sum of the relevant doses from external exposure in the specified period and the 50-year committed dose (to age 70 years for children) from intakes in the same period.
2 With the further provision that the effective dose should not exceed 50 mSv in any single year. Additional restrictions apply to the occupational exposure of pregnant women.
3 In special circumstances, a higher value of effective dose could be allowed in a single year, provided that the average over 5 years does not exceed 1 mSv per year.
4 The limitation on the effective dose provides sufficient protection for the skin against stochastic effects. An additional limit is needed for localized exposures in order to prevent deterministic effects.
Dosimetry
Dosimetry is used to indicate dose equivalents that workers receive from external radiation fields to which they may be exposed. Dosimeters are characterized by the type of device, the type of radiation they measure and the portion of the body for which the absorbed dose is to be indicated.
Three main types of dosimeters are most commonly employed. They are thermoluminescent dosimeters, film dosimeters and ionization chambers. Other types of dosimeters (not discussed here) include fission foils, track-etch devices and plastic “bubble” dosimeters.
Thermoluminescent dosimeters are the most commonly used type of personnel dosimeter. They take advantage of the principle that when some materials absorb energy from ionizing radiation, they store it such that later it can be recovered in the form of light when the materials are heated. To a high degree, the amount of light released is directly proportional to the energy absorbed from the ionizing radiation and hence to the absorbed dose the material received. This proportionality is valid over a very wide range of ionizing radiation energy and absorbed dose rates.
Special equipment is necessary to process thermoluminescent dosimeters accurately. Reading the thermoluminescent dosimeter destroys the dose information contained in it. However, after appropriate processing, thermoluminescent dosimeters are reusable.
The material used for thermoluminescent dosimeters must be transparent to the light it emits. The most common materials used for thermoluminescent dosimeters are lithium fluoride (LiF) and calcium fluoride (CaF2). The materials may be doped with other materials or made with a specific isotopic composition for specialized purposes such as neutron dosimetry.
Many dosimeters contain several thermoluminescent chips with different filters in front of them to allow discrimination between energies and types of radiation.
Film was the most popular material for personnel dosimetry before thermoluminescent dosimetry became common. The degree of film darkening depends on the energy absorbed from the ionizing radiation, but the relationship is not linear. Dependence of film response on total absorbed dose, absorbed dose rate and radiation energy is greater than that for thermoluminescent dosimeters and can limit film’s range of applicability. However, film has the advantage of providing a permanent record of the absorbed dose to which it was exposed.
Various film formulations and filter arrangements may be used for special purposes, such as neutron dosimetry. As with thermoluminescent dosimeters, special equipment is needed for proper analysis.
Film is generally much more sensitive to ambient humidity and temperature than thermoluminescent materials, and can give falsely high readings under adverse conditions. On the other hand, dose equivalents indicated by thermoluminescent dosimeters may be affected by the shock of dropping them on a hard surface.
Only the largest of organizations operate their own dosimetry services. Most obtain such services from companies specializing in providing them. It is important that such companies be licensed or accredited by appropriate independent authorities so that accurate dosimetry results are assured.
Self-reading, small ionization chambers, also called pocket chambers, are used to obtain immediate dosimetry information. Their use is often required when personnel must enter high or very high radiation areas, where personnel could receive a large absorbed dose in a short period of time. Pocket chambers often are calibrated locally, and they are very sensitive to shock. Consequently, they should always be supplemented by thermoluminescent or film dosimeters, which are more accurate and dependable but do not provide immediate results.
Dosimetry is required for a worker when he or she has a reasonable probability of accumulating a certain percentage, usually 5 or 10%, of the maximum permissible dose equivalent for the whole-body or certain parts of the body.
A whole-body dosimeter should be worn somewhere between the shoulders and the waist, at a point where the highest exposure is anticipated. When conditions of exposure warrant, other dosimeters may be worn on fingers or wrists, at the abdomen, on a band or hat at the forehead, or on a collar, to assess localized exposure to extremities, a foetus or embryo, the thyroid or the lenses of the eyes. Refer to appropriate regulatory guidelines about whether dosimeters should be worn inside or outside protective garments such as lead aprons, gloves and collars.
Personnel dosimeters indicate only the radiation to which the dosimeter was exposed. Assigning the dosimeter dose equivalent to the person or organs of the person is acceptable for small, trivial doses, but large dosimeter doses, especially those greatly exceeding regulatory standards, should be analysed carefully with respect to dosimeter placement and the actual radiation fields to which the worker was exposed when estimating the dose that the worker actually received. A statement should be obtained from the worker as part of the investigation and included in the record. However, much more often than not, very large dosimeter doses are the result of deliberate radiation exposure of the dosimeter while it was not being worn.
Bioassay
Bioassay (also called radiobioassay) means the determination of kinds, quantities or concentrations, and, in some cases, the locations of radioactive material in the human body, whether by direct measurement (in vivo counting) or by analysis and evaluation of materials excreted or removed from the human body.
Bioassay is usually used to assess worker dose equivalent due to radioactive material taken into the body. It also can provide an indication of the effectiveness of active measures taken to prevent such intake. More rarely it may be used to estimate the dose a worker received from a massive external radiation exposure (for example, by counting white blood cells or chromosomal defects).
Bioassay must be performed when a reasonable possibility exists that a worker may take or has taken into his or her body more than a certain percentage (usually 5 or 10%) of the ALI for a radionuclide. The chemical and physical form of the radionuclide sought in the body determines the type of bioassay necessary to detect it.
Bioassay can consist of analysing samples taken from the body (for example, urine, faeces, blood or hair) for radioactive isotopes. In this case, the amount of radioactivity in the sample can be related to the radioactivity in the person’s body and subsequently to the radiation dose that the person’s body or certain organs have received or are committed to receive. Urine bioassay for tritium is an example of this type of bioassay.
Whole or partial body scanning can be used to detect radionuclides that emit x or gamma rays of energy reasonably detectable outside the body. Thyroid bioassay for iodine-131 (131I) is an example of this type of bioassay.
Bioassay can be performed in-house or samples or personnel can be sent to a facility or organization that specializes in the bioassay to be performed. In either case, proper calibration of equipment and accreditation of laboratory procedures is essential to ensure accurate, precise, and defensible bioassay results.
Protective Clothing
Protective clothing is supplied by the employer to the worker to reduce the possibility of radioactive contamination of the worker or his or her clothing or to partially shield the worker from beta, x, or gamma radiation. Examples of the former are anti-contamination clothing, gloves, hoods and boots. Examples of the latter are leaded aprons, gloves and eyeglasses.
Respiratory Protection
A respiratory protection device is an apparatus, such as a respirator, used to reduce a worker’s intake of airborne radioactive materials.
Employers must use, to the extent practical, process or other engineering controls (for example, containment or ventilation) to limit the concentrations of the radioactive materials in air. When this is not possible for controlling the concentrations of radioactive material in air to values below those that define an airborne radioactivity area, the employer, consistent with maintaining the total effective dose equivalent ALARA, must increase monitoring and limit intakes by one or more of the following means:
- control of access
- limitation of exposure times
- use of respiratory protection equipment
- other controls.
Respiratory protection equipment issued to workers must comply with applicable national standards for such equipment.
The employer must implement and maintain a respiratory protection programme that includes:
- air sampling sufficient to identify the potential hazard, permit proper equipment selection and estimate exposures
- surveys and bioassays, as appropriate, to evaluate actual intakes
- testing of respirators for operability immediately prior to each use
- written procedures regarding selection, fitting, issuance, maintenance and testing of respirators, including testing for operability immediately prior to each use; supervision and training of personnel; monitoring, including air sampling and bioassays; and record-keeping
- determination by a physician prior to the initial fitting of respirators, and periodically at a frequency determined by a physician, that the individual user is medically fit to use the respiratory protection equipment.
The employer must advise each respirator user that the user may leave the work area at any time for relief from respirator use in the event of equipment malfunction, physical or psychological distress, procedural or communication failure, significant deterioration of operating conditions, or any other conditions that might require such relief.
Even though circumstances may not require routine use of respirators, credible emergency conditions may mandate their availability. In such cases, the respirators also must be certified for such use by an appropriate accrediting organization and maintained in a condition ready for use.
Occupational Health Surveillance
Workers exposed to ionizing radiation should receive occupational health services to the same extent as workers exposed to other occupational hazards.
General preplacement examinations assess the overall health of the prospective employee and establish baseline data. Previous medical and exposure history should always be obtained. Specialized examinations, such as of lens of the eye and blood cell counts, may be necessary depending on the nature of the expected radiation exposure. This should be left to the discretion of the attending physician.
Contamination Surveys
A contamination survey is an evaluation of the radiological conditions incident to the production, use, release, disposal or presence of radioactive materials or other sources of radiation. When appropriate, such an evaluation includes a physical survey of the location of radioactive material and measurements or calculations of levels of radiation, or concentrations or quantities of radioactive material present.
Contamination surveys are performed to demonstrate compliance with national regulations and to evaluate the extent of radiation levels, concentrations or quantities of radioactive material, and the potential radiological hazards that could be present.
The frequency of contamination surveys is determined by the degree of potential hazard present. Weekly surveys should be performed in radioactive waste storage areas and in laboratories and clinics where relatively large amounts of unsealed radioactive sources are used. Monthly surveys suffice for laboratories that work with small amounts of radioactive sources, such as laboratories that perform in vitro testing using isotopes such as tritium, carbon-14 (14C), and iodine-125 (125I) with activities less than a few kBq.
Radiation safety equipment and survey meters must be appropriate for the types of radioactive material and radiations involved, and must be properly calibrated.
Contamination surveys consist of measurements of ambient radiation levels with a Geiger-Mueller (G-M) counter, ionization chamber or scintillation counter; measurements of possible α or βγ surface contamination with appropriate thin-window G-M or zinc sulphide (ZnS) scintillation counters; and wipe tests of surfaces to be later counted in a scintillation (sodium iodide (NaI)) well counter, a germanium (Ge) counter or a liquid scintillation counter, as appropriate.
Appropriate action levels must be established for ambient radiation and contamination measurement results. When an action level is exceeded, steps must be taken immediately to mitigate the detected levels, restore them to acceptable conditions and prevent unnecessary personnel exposure to radiation and the uptake and spread of radioactive material.
Environmental Monitoring
Environmental monitoring refers to collecting and measuring environmental samples for radioactive materials and monitoring areas outside the environs of the workplace for radiation levels. Purposes of environmental monitoring include estimating consequences to humans resulting from the release of radionuclides to the biosphere, detecting releases of radioactive material to the environment before they become serious and demonstrating compliance with regulations.
A complete description of environmental monitoring techniques is beyond the scope of this article. However, general principles will be discussed.
Environmental samples must be taken that monitor the most likely pathway for radionuclides from the environment to man. For example, soil, water, grass and milk samples in agricultural regions around a nuclear power plant should be taken routinely and analysed for iodine-131 (131I) and strontium-90 (90Sr) content.
Environmental monitoring can include taking samples of air, ground water, surface water, soil, foliage, fish, milk, game animals and so on. The choices of which samples to take and how often to take them should be based on the purposes of the monitoring, although a small number of random samples may sometimes identify a previously unknown problem.
The first step in designing an environmental monitoring programme is to characterize the radionuclides being released or having the potential for being accidentally released, with respect to type and quantity and physical and chemical form.
The possibility of transport of these radionuclides through the air, ground water and surface water is the next consideration. The objective is to predict the concentrations of radionuclides reaching humans directly through air and water or indirectly through food.
The bioaccumulation of radionuclides resulting from deposition in aquatic and terrestrial environments is the next item of concern. The goal is to predict the concentration of radionuclides once they enter the food chain.
Finally, the rate of human consumption of these potentially contaminated foodstuffs and how this consumption contributes to human radiation dose and resultant health risk are examined. The results of this analysis are used to determine the best approach to environmental sampling and to ensure that the goals of the environmental monitoring programme are met.
Leak Tests of Sealed Sources
A sealed source means radioactive material that is encased in a capsule designed to prevent leakage or escape of the material. Such sources must be tested periodically to verify that the source is not leaking radioactive material.
Each sealed source must be tested for leakage before its first use unless the supplier has provided a certificate indicating that the source was tested within six months (three months for α emitters) before transfer to the present owner. Each sealed source must be tested for leakage at least once every six months (three months for α emitters) or at an interval specified by the regulatory authority.
Generally, leak tests on the following sources are not required:
- sources containing only radioactive material with a half-life of less than 30 days
- sources containing only radioactive material as a gas
- sources containing 4 MBq or less of βγ-emitting material or 0.4 MBq or less of α-emitting material
- sources stored and not being used; however, each such source must be tested for leakage before any use or transfer unless it has been leakage-tested within six months before the date of use or transfer
- seeds of iridium-192 (192Ir) encased in nylon ribbon.
A leak test is performed by taking a wipe sample from the sealed source or from the surfaces of the device in which the sealed source is mounted or stored on which radioactive contamination might be expected to accumulate or by washing the source in a small volume of detergent solution and treating the entire volume as the sample.
The sample should be measured so that the leakage test can detect the presence of at least 200 Bq of radioactive material on the sample.
Sealed radium sources require special leak test procedures to detect leaking radon (Rn) gas. For example, one procedure involves keeping the sealed source in a jar with cotton fibres for at least 24 hours. At the end of the period, the cotton fibres are analysed for the presence of Rn progeny.
A sealed source found to be leaking in excess of allowable limits must be removed from service. If the source is not repairable, it should be handled as radioactive waste. The regulatory authority may require that leaking sources be reported in case the leakage is a result of a manufacturing defect worthy of further investigation.
Inventory
Radiation safety personnel must maintain an up-to-date inventory of all radioactive material and other sources of ionizing radiation for which the employer is responsible. The organization’s procedures must ensure that radiation safety personnel are aware of the receipt, use, transfer and disposal of all such material and sources so that the inventory can be kept current. A physical inventory of all sealed sources should be done at least once every three months. The complete inventory of ionizing radiation sources should be verified during the annual audit of the radiation safety programme.
Posting of Areas
Figure 1 shows the international standard radiation symbol. This must appear prominently on all signs denoting areas controlled for the purposes of radiation safety and on container labels indicating the presence of radioactive materials.
Figure 1. Radiation symbol
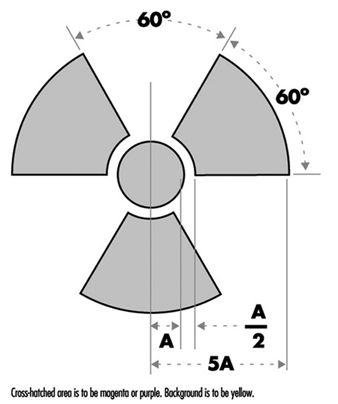
Areas controlled for the purposes of radiation safety are often designated in terms of increasing dose rate levels. Such areas must be conspicuously posted with a sign or signs bearing the radiation symbol and the words “CAUTION, RADIATION AREA,” “CAUTION (or DANGER), HIGH RADIATION AREA,” or “GRAVE DANGER, VERY HIGH RADIATION AREA,” as appropriate.
- A radiation area is an area, accessible to personnel, in which radiation levels could result in an individual receiving a dose equivalent in excess of 0.05 mSv in 1 h at 30 cm from the radiation source or from any surface that the radiation penetrates.
- A high radiation area is an area, accessible to personnel, in which radiation levels could result in an individual receiving a dose equivalent in excess of 1 mSv in 1 h at 30 cm from the radiation source or from any surface that the radiation penetrates.
- A very high radiation area is an area, accessible to personnel, in which radiation levels could result in an individual receiving an absorbed dose in excess of 5 Gy in 1 h at 1 m from a radiation source or from any surface that the radiation penetrates.
If an area or room contains a significant amount of radioactive material (as defined by the regulatory authority), the entrance to such area or room must be conspicuously posted with a sign bearing the radiation symbol and the words “CAUTION (or DANGER), RADIOACTIVE MATERIALS”.
An airborne radioactivity area is a room or area in which airborne radioactivity exceeds certain levels defined by the regulatory authority. Each airborne radioactivity area must be posted with a conspicuous sign or signs bearing the radiation symbol and the words “CAUTION, AIRBORNE RADIOACTIVITY AREA” or “DANGER, AIRBORNE RADIOACTIVITY AREA”.
Exceptions for these posting requirements may be granted for patients’ rooms in hospitals where such rooms are otherwise under adequate control. Areas or rooms in which the sources of radiation are to be located for periods of eight hours or less and are otherwise constantly attended under adequate control by qualified personnel need not be posted.
Access Control
The degree to which access to an area must be controlled is determined by the degree of the potential radiation hazard in the area.
Control of access to high radiation areas
Each entrance or access point to a high radiation area must have one or more of the following features:
- a control device that, upon entry into the area, causes the level of radiation to be reduced below that level at which an individual might receive a dose of 1 mSv in 1 h at 30 cm from the radiation source or from any surface that the radiation penetrates
- a control device that energizes a conspicuous visible or audible alarm signal so that the individual entering the high radiation area and the supervisor of the activity are made aware of the entry
- entryways that are locked, except during periods when access to the area is required, with positive control over each individual entry.
In place of the controls required for a high radiation area, continuous direct or electronic surveillance that is capable of preventing unauthorized entry may be substituted.
The controls must be established in a way that does not prevent individuals from leaving the high radiation area.
Control of access to very high radiation areas
In addition to the requirements for a high radiation area, additional measures must be instituted to ensure that an individual is not able to gain unauthorized or inadvertent access to areas in which radiation levels could be encountered at 5 Gy or more in 1 h at 1 m from a radiation source or any surface through which the radiation penetrates.
Markings on Containers and Equipment
Each container of radioactive material above an amount determined by the regulatory authority must bear a durable, clearly visible label bearing the radiation symbol and the words “CAUTION, RADIOACTIVE MATERIAL” or “DANGER, RADIOACTIVE MATERIAL”. The label must also provide sufficient information - such as the radionuclide(s) present, an estimate of the quantity of radioactivity, the date for which the activity is estimated, radiation levels, kinds of materials and mass enrichment - to permit individuals handling or using the containers, or working in the vicinity of the containers, to take precautions to avoid or minimize exposures.
Prior to removal or disposal of empty uncontaminated containers to unrestricted areas, the radioactive material label must be removed or defaced, or it must be clearly indicated that the container no longer contains radioactive materials.
Containers need not be labelled if:
- the containers are attended by an individual who takes the precautions necessary to prevent the exposure of individuals in excess of the regulatory limits
- containers, when they are in transport, are packaged and labelled in accordance with appropriate transportation regulations
- containers are accessible only to individuals authorized to handle or use them, or to work in the vicinity of the containers, if the contents are identified to these individuals by a readily available written record (examples of containers of this type are containers in locations such as water-filled canals, storage vaults or hot cells); the record must be retained as long as the containers are in use for the purpose indicated on the record; or
- the containers are installed in manufacturing or process equipment, such as reactor components, piping and tanks.
Warning Devices and Alarms
High radiation areas and very high radiation areas must be equipped with warning devices and alarms as discussed above. These devices and alarms can be visible or audible or both. Devices and alarms for systems such as particle accelerators should be automatically energized as part of the start-up procedure so that personnel will have time to vacate the area or turn off the system with a “scram” button before radiation is produced. “Scram” buttons (buttons in the controlled area that, when pressed, cause radiation levels to drop immediately to safe levels) must be easily accessible and prominently marked and displayed.
Monitor devices, such as continuous air monitors (CAMs), can be preset to emit audible and visible alarms or to turn off a system when certain action levels are exceeded.
Instrumentation
The employer must make available instrumentation appropriate for the degree and kinds of radiation and radioactive material present in the workplace. This instrumentation may be used to detect, monitor or measure the levels of radiation or radioactivity.
The instrumentation must be calibrated at appropriate intervals using accredited methods and calibration sources. The calibration sources should be as much as possible like the sources to be detected or measured.
Types of instrumentation include hand-held survey instruments, continuous air monitors, hand-and-feet portal monitors, liquid scintillation counters, detectors containing Ge or NaI crystals and so on.
Radioactive Material Transportation
The International Atomic Energy Agency (IAEA) has established regulations for the transportation of radioactive material. Most countries have adopted regulations compatible with IAEA radioactive shipment regulations.
Figure 2. Category I - WHITE label
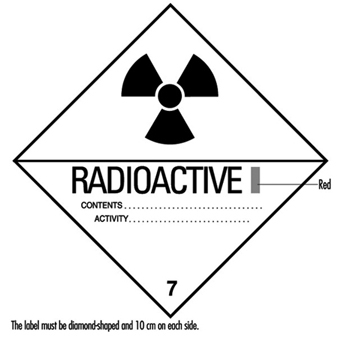
Figure 2, figure 3 and figure 4 are examples of shipping labels that IAEA regulations require on the exterior of packages presented for shipment that contain radioactive materials. The transport index on the labels shown in figure 3 and figure 4 refer to the highest effective dose rate at 1 m from any surface of the package in mSv/h multiplied by 100, then rounded up to the nearest tenth. (For example, if the highest effective dose rate at 1 m from any surface of a package is 0.0233 mSv/h, then the transport index is 2.4.)
Figure 3. Category II - YELLOW label

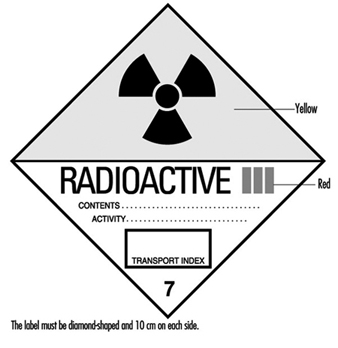
Figure 5 shows an example of a placard that ground vehicles must prominently display when carrying packages containing radioactive materials above certain amounts.
Figure 5. Vehicle placard
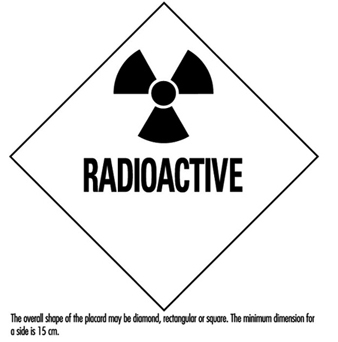
Packaging intended for use in shipping radioactive materials must comply with stringent testing and documentation requirements. The type and quantity of radioactive material being shipped determines what specifications the packaging must meet.
Radioactive material transportation regulations are complicated. Persons who do not routinely ship radioactive materials should always consult experts experienced with such shipments.
Radioactive Waste
Various radioactive waste disposal methods are available, but all are controlled by regulatory authorities. Therefore, an organization must always confer with its regulatory authority to ensure that a disposal method is permissible. Radioactive waste disposal methods include holding the material for radioactive decay and subsequent disposal without regard to radioactivity, incineration, disposal in the sanitary sewerage system, land burial and burial at sea. Burial at sea is often not permitted by national policy or international treaty and will not be discussed further.
Radioactive waste from reactor cores (high-level radioactive waste) presents special problems with regard to disposal. Handling and disposal of such wastes is controlled by national and international regulatory authorities.
Often radioactive waste may have a property other than radioactivity that by itself would make the waste hazardous. Such wastes are called mixed wastes. Examples include radioactive waste that is also a biohazard or is toxic. Mixed wastes require special handling. Refer to regulatory authorities for proper disposition of such wastes.
Holding for radioactive decay
If the half-life of the radioactive material is short (generally less than 65 days) and if the organization has enough storage space, the radioactive waste can be held for decay with subsequent disposal without regard to its radioactivity. A holding period of at least ten half-lives usually is sufficient to make radiation levels indistinguishable from background.
The waste must be surveyed before it may be disposed of. The survey should employ instrumentation appropriate for the radiation to be detected and demonstrate that radiation levels are indistinguishable from background.
Incineration
If the regulatory authority allows incineration, then usually it must be demonstrated that such incineration does not cause the concentration of radionuclides in air to exceed permissible levels. The ash must be surveyed periodically to verify that it is not radioactive. In some circumstances it may be necessary to monitor the stack to ensure that permissible air concentrations are not being exceeded.
Disposal in the sanitary sewerage system
If the regulatory authority allows such disposal, then usually it must be demonstrated that such disposal does not cause the concentration of radionuclides in water to exceed permissible levels. Material to be disposed of must be soluble or otherwise readily dispersible in water. The regulatory authority often sets specific annual limits to such disposal by radionuclide.
Land burial
Radioactive waste not disposable by any other means will be disposed of by land burial at sites licensed by national or local regulatory authorities. Regulatory authorities control such disposal tightly. Waste generators usually are not allowed to dispose of radioactive waste on their own land. Costs associated with land burial include packaging, shipping and storage expenses. These costs are in addition to the cost of the burial space itself and can often be reduced by compacting the waste. Land burial costs for radioactive waste disposal are rapidly escalating.
Programme Audits
Radiation safety programmes should be audited periodically for effectiveness, completeness and compliance with regulatory authority. The audit should be done at least once a year and be comprehensive. Self-audits are usually permissible but audits by independent outside agencies are desirable. Outside agency audits tend to be more objective and have a more global point of view than local audits. An auditing agency not associated with day-to-day operations of a radiation safety programme often can identify problems not seen by the local operators, who may have become accustomed to overlooking them.
Training
Employers must provide radiation safety training to all workers exposed or potentially exposed to ionizing radiation or radioactive materials. They must provide initial training before a worker begins work and annual refresher training. In addition, each female worker of child-bearing age must be provided special training and information about the effects of ionizing radiation on the unborn child and about appropriate precautions she should take. This special training must be given when she is first employed, at annual refresher training, and if she notifies her employer that she is pregnant.
All individuals working in or frequenting any portion of an area access to which is restricted for the purposes of radiation safety:
- must be kept informed of the storage, transfer or use of radioactive materials or of radiation in such portions of the restricted area
- must be instructed in the health protection problems associated with exposure to such radioactive materials or radiation, in precautions or procedures to minimize exposure, and in the purposes and functions of protective devices employed
- must be instructed in, and instructed to observe, to the extent within the worker’s control, the applicable provisions of national and employer regulations for the protection of personnel from exposures to radiation or radioactive materials occurring in such areas
- must be instructed of their responsibility to report promptly to the employer any condition which may lead to or cause a violation of national or employer regulations or unnecessary exposure to radiation or to radioactive material
- must be instructed in the appropriate response to warnings made in the event of any unusual occurrence or malfunction that may involve exposure to radiation or radioactive material
- must be advised as to the radiation exposure reports that workers may request.
The extent of radiation safety instructions must be commensurate with potential radiological health protection problems in the controlled area. Instructions must be extended as appropriate to ancillary personnel, such as nurses who attend radioactive patients in hospitals and fire-fighters and police officers who might respond to emergencies.
Worker Qualifications
Employers must ensure that workers using ionizing radiation are qualified to perform the work for which they are employed. The workers must have the background and experience to perform their jobs safely, particularly with reference to exposure to and use of ionizing radiation and radioactive materials.
Radiation safety personnel must have the appropriate knowledge and qualifications to implement and operate a good radiation safety programme. Their knowledge and qualifications must be at least commensurate with the potential radiological health protection problems that they and the workers are reasonably likely to encounter.
Emergency Planning
All but the smallest operations that use ionizing radiation or radioactive materials must have emergency plans in place. These plans must be kept current and exercised on a periodic basis.
Emergency plans should address all credible emergency situations. The plans for a large nuclear power plant will be much more extensive and involve a much larger area and number of people than the plans for a small radioisotope laboratory.
All hospitals, especially in large metropolitan areas, should have plans for receiving and caring for radioactively contaminated patients. Police and fire-fighting organizations should have plans for dealing with transportation accidents involving radioactive material.
Record Keeping
The radiation safety activities of an organization must be fully documented and appropriately retained. Such records are essential if the need arises for past radiation exposures or radioactivity releases and for demonstrating compliance with regulatory authority requirements. Consistent, accurate and comprehensive record keeping must receive high priority.
Organizational Considerations
The position of the person primarily responsible for radiation safety must be placed in the organization so that he or she has immediate access to all echelons of workers and management. He or she must have free access to areas to which access is restricted for purposes of radiation safety and the authority to halt unsafe or illegal practices immediately.
Workplace Design for Radiation Safety
Basic Design Features of Radiation Facilities
Hazards associated with the handling and use of radiation sources necessitate special features of design and construction that are not required for conventional laboratories or working areas. These special design features are incorporated so that the facility worker is not unduly hampered while ensuring that he or she is not exposed to undue external or internal radiation hazards.
Access to all areas where exposure to radiation sources or radioactive materials could occur must be controlled not only with respect to the facility workers who may be permitted to enter such work areas, but also with respect to the type of clothing or protective equipment that they should wear and the precautions that they should take in controlled areas. In the administration of such control measures, it helps to classify radiation work areas based on the presence of ionizing radiation, on the presence of radioactive contamination or both. The introduction of such work area classification concepts in early planning stages will result in the facility having all the features necessary to make operations with radiation sources less hazardous.
Classification of working areas and laboratory types
The basis for the classification of the work area is the grouping of radionuclides according to their relative radiotoxicities per unit activity. Group I should be classified as very high toxicity radionuclides, Group II as moderate-to-high toxicity radionuclides, Group III as moderate toxicity radionuclides, and Group IV as low toxicity radionuclides. Table 1 shows the toxicity group classification of many radionuclides.
Table 1. Radionuclides classified according to relative radiotoxicity per unit activity
|
Group I: Very high toxicity |
|||||||||
|
210Pb |
210Po |
223Ra |
226Ra |
228Ra |
227Ac |
227Th |
228Th |
230Th |
231Pa |
|
230U |
232U |
233U |
234U |
237Np |
238Pu |
239Pu |
240Pu |
241Pu |
242Pu |
|
241Am |
243Am |
242Cm |
243Cm |
244Cm |
245Cm |
246Cm |
249Cm |
250Cf |
252Cf |
|
Group II: High toxicity |
|||||||||
|
22Na |
36Cl |
45Ca |
46Sc |
54Mn |
56Co |
60Co |
89Sr |
90Sr |
91Y |
|
95Zr |
106Ru |
110Agm |
115Cdm |
114Inm |
124Sb |
125Sb |
127Tem |
129Tem |
124I |
|
126I |
131I |
133I |
134Cs |
137Cs |
140Ba |
144Ce |
152Eu (13 y) |
154Eu |
160Tb |
|
170Tm |
181Hf |
210Bi |
182Ta |
192Ir |
204Tl |
207Bi |
230Pa |
211At |
212Pb |
|
224Ra |
228Ac |
234Th |
236U |
249Bk |
|||||
|
Group III: Moderate toxicity |
|||||||||
|
7Be |
14C |
18F |
24Na |
38Cl |
31Si |
32P |
35S |
41A |
42K |
|
43K |
47Sc |
48Sc |
48V |
51Cr |
52Mn |
56Mn |
52Fe |
55Fe |
59Fe |
|
57Co |
53Ni |
65Ni |
64Cu |
65Zn |
69Znm |
72Ga |
73As |
74As |
76As |
|
77As |
82Br |
85Krm |
87Kr |
86Rb |
85Sr |
91Sr |
90Y |
92Y |
93Y |
|
97Zr |
95Nb |
99Mo |
96Tc |
97Tcm |
97Tc |
99Tc |
97Ru |
103Ru |
105Ru |
|
105Rh |
109Pd |
105Ag |
111Ag |
109Cd |
115Cd |
115Inm |
113Sn |
125Sn |
122Sb |
|
125Tem |
129Te |
131Tem |
132Te |
130I |
132I |
134I |
135I |
135Xe |
131Cs |
|
136Cs |
140La |
141Ce |
143Ce |
142Pr |
143Pr |
147Nd |
149Nd |
147Pm |
149Pm |
|
151Sm |
152Eu (9.2 h) |
155Eu |
153Gd |
159Gd |
165Dy |
166Dy |
166Ho |
169Er |
171Er |
|
171Tm |
177Lu |
181W |
185W |
187W |
183Re |
186Re |
188Re |
185Os |
191Os |
|
193Os |
190Ir |
195Ir |
191Pt |
193Pt |
197Pt |
196Au |
198Au |
199Au |
197Hg |
|
197Hgm |
203Hg |
200Tl |
201Tl |
202Tl |
203Pb |
206Bi |
212Bi |
220Rn |
222Rn |
|
231Th |
233Pa |
239Np |
|||||||
|
Group IV: Low toxicity |
|||||||||
|
3H |
15O |
37A |
58Com |
59Ni |
69Zn |
71Ge |
85Kr |
85Srm |
87Rb |
|
91Ym |
93Zr |
97Nb |
96Tcm |
99Tcm |
103Rhm |
133Inm |
129I |
131Xem |
133Xe |
|
134Csm |
135Cs |
147Sm |
187Re |
191Osm |
193Ptm |
197Ptm |
natTh |
232Th |
235U |
|
238U |
natU |
||||||||
(IAEA 1973)
Three broad types of laboratories can be envisaged on the basis of radiotoxicity considerations, the amounts or quantities of radioactive materials that will be handled in the work area and the type of operations involved.
Table 2 describes laboratories by type and provides examples for each type. Table 3 shows the types of laboratories along with the work area classification and access control (IAEA 1973).
Table 2. Classification of working areas
|
Type |
Definition |
Access control |
Typical operations |
|
1 |
Areas in which the external radiation absorbed dose levels or radioactive contamination levels could be high |
Access controlled to radiation workers only, under strictly controlled working conditions and with appropriate protective equipment |
Hot laboratories, highly contaminated areas |
|
2 |
Areas in which external radiation levels could exist and in which the possibility of contamination necessitates operating instructions |
Access limited to radiation workers with |
Luminizing factories and other equivalent |
|
3 |
Areas in which the average external radiation level is less than 1 mGy·wk-1 and in which the possibility of radioactive contamination necessitates special operating instructions |
Access limited to radiation workers, no |
Working areas in the immediate vicinity of |
|
4 |
Areas within the confines of a radiation facility where the external radiation levels are less than 0.1 mGy•wk-1 and where |
Access uncontrolled |
Administration and patient waiting areas |
(ICRP 1977, IAEA 1973)
Table 3. Classification of laboratories for handling radioactive materials
|
Group of |
Type of laboratory required for the activity specified below |
||
|
Type 1 |
Type 2 |
Type 3 |
|
|
I |
<370 kBq |
70 kBq to |
>37 MBq |
|
II |
<37 MBq |
37 MBq to |
>37 GBq |
|
III |
<37 GBq |
37 GBq to |
>370 GBq |
|
IV |
<370 GBq |
370 GBq to |
>37 Tbq |
|
Operational factors for laboratory use of radioactive material |
Multiplication factors for the activity levels |
|
Simple storage |
×100 |
|
Simple wet operations (for example, preparation of aliquots of stock solution) |
×10 |
|
Normal chemical operations (for example, simple chemical preparation and analysis) |
×1 |
|
Complex wet operations (for example, multiple operations or operations with complex glass ware) |
×0.1 |
|
Simple dry operations (for example, manipulations of powders of volatile radioactive compounds) |
×0.1 |
|
Dry and dusty operations (for example, grinding) |
×0.01 |
(ICRP 1977, IAEA 1973)
The hazards involved in working with radioactive material depend not only on the level of radiotoxicity or chemical toxicity and the activity of the radionuclides, but also on the radioactive material’s physical and chemical form and on the nature and complexity of the operation or procedure being performed.
Location of a radiation facility in a building
When a radiation facility is part of a large building, the following should be kept in mind when deciding on the location of such a facility:
- The radiation facility should be located in a relatively unfrequented part of the building, so that access to the area can be easily controlled.
- The potential for fires should be minimal in the area chosen.
- The location of the radiation facility and the heating and ventilation provided should be such that possibilities for the spread of both surface and airborne radioactive contamination are minimal.
- The location of the radiation facility should be chosen judiciously, so that with a minimum expenditure for shielding, radiation levels can be effectively maintained within established limits in the immediate vicinity.
Planning of radiation facilities
Where a gradation of levels of activity is envisioned, the laboratory should be located so that access to areas where high radiation or radioactive contamination levels exist is gradual; that is, one first enters a non-radiation area, then a low activity area, then a medium activity area and so on.
The need for elaborate control of ventilation in small laboratories can be avoided by the use of hoods or glove boxes for handling unsealed sources of radioactive material. However, the ventilation system should be designed to permit air flow in a direction such that any radioactive material that becomes airborne will flow away from the radiation worker. The air flow should always be from an uncontaminated area toward a contaminated or potentially contaminated area.
For the handling of unsealed sources of low to medium radioactivity, the average air speed through the opening in the hood must be about 0.5 ms–1. For highly radiotoxic or high-level radioactivity, the air velocity through the opening should be raised to an average of 0.6 to
1.0 ms–1. However, excessively high air speeds can draw out radioactive materials from open containers and contaminate the entire hood area.
The placement of the hood in the laboratory is important with respect to cross-drafts. In general, a hood should be located well away from doorways where supply or make-up air must enter. Dual-speed fans will permit operation at a higher air velocity while the hood is in use and a lower velocity when it is closed.
The aim of any ventilating system should be to:
- provide comfortable working conditions
- provide continuous air changes (three to five changes per hour) for the purposes of removing and diluting undesirable air contaminants
- minimize the contamination of other areas of the building and the environment.
In the design of radiation facilities, heavy shielding requirements can be minimized by the adoption of certain simple measures. For example, for radiation therapy, accelerators, neutron generators or panoramic radiation sources, a maze can reduce the need for a heavy lead-lined door. Tapering of the primary protective barrier in areas that are not directly in the useful beam or locating the facility partially or completely underground can significantly reduce the amount of required shielding.
Careful attention must be paid to the proper positioning of viewing windows, underground conduit cables and ventilation system baffles. The viewing window should intercept scattered radiation only. Even better is a closed circuit television, which can also improve efficiency.
Surface finishes within a work area
All raw surfaces, such as plaster, concrete, wood and so on, should be permanently sealed with a suitable material. The choice of material should be made with the following considerations in mind:
- the provision of a smooth, chemically inert surface
- the environmental conditions of temperature, humidity and mechanical wear and tear to which the surfaces may be exposed
- compatibility with radiation fields to which the surface is exposed
- the need for ease of repair in the event of damage.
Ordinary paints, varnishes and lacquers are not recommended for covering wear surfaces. The application of a surfacing material that can be easily removed may be helpful if contamination occurs and decontamination is required. However, the removal of such materials sometimes can be difficult and messy.
Plumbing
Sinks, wash basins and floor drains should be properly marked. Wash basins where contaminated hands may be washed should have knee- or foot-operated faucets. It may be economical to reduce maintenance by using piping which can be easily decontaminated or replaced if required. In some cases it may be advisable to install underground holding or storage tanks to control the disposal of liquid radioactive materials.
Radiation Shielding Design
Shielding is important for reducing radiation exposure of facility workers and members of the general public. Shielding requirements depend on a number of factors, including the time that radiation workers or members of the public are exposed to the radiation sources and the type and energy of the radiation sources and radiation fields.
In the design of radiation shields, the shielding material should be placed near the radiation source if possible. Separate shielding considerations must be made for each type of radiation concerned.
Shielding design can be a complex task. For example, the use of computers to model shielding for accelerators, reactors and other high-level radiation sources is beyond the scope of this article. Qualified experts always should be consulted for complex shielding design.
Gamma source shielding
The attenuation of gamma radiation is qualitatively different from that of either alpha or beta radiation. Both of those types of radiation have a definite range in matter and are completely absorbed. Gamma radiation, on the other hand, can be reduced in intensity by increasingly thicker absorbers but it cannot be completely absorbed. If the attenuation of monoenergetic gamma rays is measured under conditions of good geometry (that is, the radiation is well collimated in a narrow beam) the intensity data, when plotted on a semi-log graph versus absorber thickness, will lie on a straight line with the slope equal to the attenuation
coefficient, μ.
The intensity or absorbed dose rate transmitted through an absorber can be calculated as follows:
I(t) = I(0)e– μ t
where I(t) is the gamma-ray intensity or absorbed dose rate transmitted through an absorber of thickness t.
The units of μ and t are the reciprocal of each other. If the absorber thickness t is measured in cm, then μ is the linear attenuation coefficient and has units of cm–1. If t has units of areal density (g/cm2), then μ is the mass attenuation coefficient μm and has units of cm2/g.
As a first-order approximation using areal density, all materials have about the same photon attenuation properties for photons with energies between about 0.75 and 5.0 MeV (mega-electron volts). Within this energy range, gamma shielding properties are approximately proportional to the density of the shielding material. For lower or higher photon energies, absorbers of higher atomic number provide more effective shielding than those of lower atomic number, for a given areal density.
Under conditions of poor geometry (for example, for a broad beam or for a thick shield), the above equation will significantly underestimate the required shield thickness because it assumes that every photon that interacts with the shield will be removed from the beam and not be detected. A significant number of photons may be scattered by the shield into the detector, or photons that had been scattered out of the beam may be scattered back into it after a second interaction.
A shield thickness for conditions of poor geometry may be estimated through the use of the build-up factor B that may be estimated as follows:
I(t) = I(0)Be– μ t
The build-up factor is always greater than one, and may be defined as the ratio of the intensity of the photon radiation, including both the primary and scattered radiation, at any point in the beam, to the intensity of the primary beam only at that point. The build-up factor may apply either to radiation flux or to absorbed dose rate.
Build-up factors have been calculated for various photon energies and various absorbers. Many of the graphs or tables give the shield thickness in terms of relaxation lengths. A relaxation length is the thickness of a shield that will attenuate a narrow beam to 1/e (about 37%) of its original intensity. One relaxation length, therefore, is numerically equal to the reciprocal of the linear attenuation coefficient (that is, 1/μ).
The thickness of an absorber that, when introduced into the primary photon beam, reduces the absorbed dose rate by one-half is called the half-value layer (HVL) or half-value thickness (HVT). The HVL may be calculated as follows:
HVL = ln2 / μ
The required photon shield thickness can be estimated by assuming narrow-beam or good geometry while calculating the required shielding, and then increasing the value thus found by one HVL to account for build-up.
The thickness of an absorber that, when introduced into the primary photon beam, reduces the absorbed dose rate by one-tenth is the tenth-value layer (TVL). One TVL is equal to about 3.32 HVLs, since:
ln10 / ln2 ≈ 3.32
Values for both TVLs and HVLs have been tabulated for various photon energies and several common shielding materials (e.g., lead, steel and concrete) (Schaeffer 1973).
The intensity or absorbed dose rate for a point source obeys the inverse square law and may be calculated as follows:

where Ii is the photon intensity or absorbed dose rate at distance di from the source.
Medical and non-medical x-ray equipment shielding
Shielding for x-ray equipment is considered under the two categories, source shielding and structural shielding. Source shielding is usually provided by the manufacturer of the x-ray tube housing.
Safety regulations specify one type of protective tube housing for medical diagnostic x-ray facilities and another type for medical therapeutic x-ray facilities. For non-medical x-ray equipment, the tube housing and other parts of the x-ray apparatus, such as the transformer, are shielded to reduce the leakage x-ray radiation to acceptable levels.
All x-ray machines, both medical and non-medical, have protective tube housings designed to limit the amount of leakage radiation. Leakage radiation, as used in these specifications for tube housings, means all radiation coming from the tube housing except for the useful beam.
Structural shielding for an x-ray facility provides protection from the useful or primary x-ray beam, from leakage radiation and from scatter radiation. It encloses both the x-ray equipment and the object being irradiated.
The amount of scatter radiation depends on the x-ray field size, energy of the useful beam, the effective atomic number of the scattering media and the angle between the incoming useful beam and the direction of scatter.
A key design parameter is the facility workload (W):
![]()
where W is the weekly workload, usually given in mA-min per week; E is the tube current multiplied by the exposure time per view, usually given in mA s; Nv is the number of views per patient or object irradiated; Np is the number of patients or objects per week and k is a conversion factor (1 min divided by 60 s).
Another key design parameter is the use factor Un for a wall (or floor or ceiling) n. The wall may be protecting any occupied area such as a control room, office or waiting room. The use factor is given by:
![]()
where, Nv,n is the number of views for which the primary x ray beam is directed toward wall n.
The structural shielding requirements for a given x ray facility are determined by the following:
- the maximum tube potential, in kilovolts-peak (kVp), at which the x ray tube is operated
- the maximum beam current, in mA, at which the x ray system is operated
- the workload (W), which is a measure, in suitable units (usually mA-min per week), of the amount of use of the x ray system
- the use factor (U), which is the fraction of the workload during which the useful beam is pointed in the direction of interest
- the occupancy factor (T), which is the factor by which the workload should be multiplied to correct for the degree or type of occupancy of the area to be protected
- the maximum permissible dose equivalent rate (P) to a person for controlled and non-controlled areas (typical absorbed dose limits are 1 mGy for a controlled area in one week and 0.1 mGy for a non-controlled area in one week)
- type of shielding material (for example, lead or concrete)
- the distance (d) from the source to the location being protected.
With these considerations included, the value of the primary beam ratio or transmission factor K in mGy per mA-min at one metre is given by:
![]()
Shielding of the x-ray facility must be constructed so that protection is not impaired by joints; by openings for ducts, pipes and so on, that pass through the barriers; or by conduits, service boxes and so on, embedded in the barriers. The shielding should cover not only the back of the service boxes, but also the sides, or be extended sufficiently to offer equivalent protection. Conduits that pass through barriers should have sufficient bends to reduce the radiation to the required level. Observation windows must have shielding equivalent to that required for the partition (barrier) or door in which they are located.
Radiation therapy facilities may require door interlocks, warning lights, closed circuit television or means for audible (e.g., voice or buzzer) and visual communication between anyone who may be in the facility and the operator.
Protective barriers are of two types:
- primary protective barriers, which are sufficient to attenuate the primary (useful) beam to the required level
- secondary protective barriers, which are sufficient to attenuate leakage, scattered and stray radiation to the required level.
To design the secondary protective barrier, separately calculate the required thickness to protect against each component. If the required thicknesses are about the same, add an additional HVL to the greatest calculated thickness. If the greatest difference between the calculated thicknesses is one TVL or more, the thickest of the calculated values will suffice.
Scattered radiation intensity depends on scattering angle, energy of the useful beam, field size or scattering area, and subject composition.
When designing secondary protective barriers, the following simplifying conservative assumptions are made:
- When x rays are produced at 500 kV or less, the energy of the scattered radiation is equal to the energy of the useful beam.
- After being scattered, the x-ray energy spectrum for beams generated at voltages greater than 500 kV are degraded to that of a 500 kV beam, and the absorbed dose rate at 1 m and 90 degrees from the scatterer is 0.1% of that in the useful beam at the point of scattering.
The transmission relationship for scattered radiation is written in terms of the scattering transmission factor (Kμx) with units of mGy•m2 (mA-min)–1:
![]()
where P is the maximum weekly absorbed dose rate (in mGy), dscat is the distance from the x ray tube’s target and the object (patient), dsec is the distance from the scatterer (object) to the point of interest that the secondary barriers are meant to shield, a is the ratio of scattered radiation to incident radiation, f is the actual scattering field size (in cm2), and F is a factor accounting for the fact that x ray output increases with voltage. Smaller values of Kμx require thicker shields.
The leakage attenuation factor BLX for diagnostic x-ray systems is calculated as follows:
![]()
where d is the distance from the tube target to the point of interest and I is the tube current in mA.
The barrier attenuation relationship for therapeutic x-ray systems operating at 500 kV or less is given by:
![]()
For therapeutic x-ray tubes operating at potentials greater than 500 kV, the leakage is usually limited to 0.1% of the intensity of the useful beam at 1 m. The attenuation factor in this case is:
![]()
where Xn is the absorbed dose rate (in mGy/h) at 1 m from a therapeutic x-ray tube operated at a tube current of 1 mA.
The number n of HVLs required to obtain the desired attenuation BLX is obtained from the relationship:
![]()
or
![]()
Beta particle shielding
Two factors must be considered when designing a shield for a high-energy beta emitter. They are the beta particles themselves and the bremsstrahlung produced by beta particles absorbed in the source and in the shield. Bremsstrahlung consists of x-ray photons produced when high-speed charged particles undergo rapid deceleration.
Therefore, a beta shield often consists of a substance of low atomic number (to minimize bremsstrahlung production) that is thick enough to stop all the beta particles. This is followed by a material of high atomic number that is thick enough to attenuate bremsstrahlung to an acceptable level. (Reversing the order of the shields increases bremsstrahlung production in the first shield to a level so high that the second shield may provide inadequate protection.)
For purposes of estimating bremsstrahlung hazard, the following relationship may be used:
![]()
where f is the fraction of the incident beta energy converted into photons, Z is the atomic number of the absorber, and Eβ is the maximum energy of the beta particle spectrum in MeV. To assure adequate protection, it is normally assumed that all bremsstrahlung photons are of the maximum energy.
The bremsstrahlung flux F at a distance d from the beta source can be estimated as follows:
![]()
`Eβ is the average beta particle energy and can be estimated by:
![]()
The range Rβ of beta particles in units of areal density (mg/cm2) may be estimated as follows for beta particles with energies between 0.01 and 2.5 MeV:
![]()
where Rβ is in mg/cm2 and Eβ is in MeV.
For Eβ>2.5 MeV, the beta particle range Rβ may be estimated as follows:
![]()
where Rβ is in mg/cm2 and Eβ is in MeV.
Alpha particle shielding
Alpha particles are the least penetrating type of ionizing radiation. Because of the random nature of its interactions, the range of an individual alpha particle varies between nominal values as indicated in figure 1. Range in the case of alpha particles may be expressed in different ways: by minimum, mean, extrapolated, or maximum range. The mean range is the most accurately determinable, corresponds to the range of the “average” alpha particle, and is used most often.
Figure 1. Typical range distribution of alpha particles
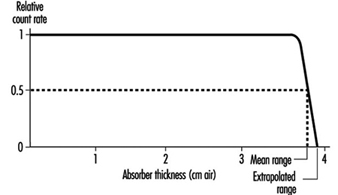
Air is the most commonly used absorbing medium for specifying the range-energy relationship of alpha particles. For alpha energy Eα less than about 4 MeV, Rα in air is approximately given by:
![]()
where Rα is in cm, Eα in MeV.
For Eα between 4 and 8 MeV, Rα in air is given approximately by:
![]()
where Rα is in cm, Eα in MeV.
The range of alpha particles in any other medium may be estimated from the following relationship:
Rα (in other medium; mg/cm2) » 0.56 A1/3 Rα (in air; cm) where A is the atomic number of the medium.
Neutron shielding
As a general rule of thumb for neutron shielding, neutron energy equilibrium is achieved and then remains constant after one or two relaxation lengths of shielding material. Therefore, for shields thicker than a few relaxation lengths, the dose equivalent outside concrete or iron shielding will be attenuated with relaxation lengths of 120 g/cm2 or 145 g/cm2, respectively.
Neutron energy loss by elastic scattering requires a hydrogenous shield to maximize the energy transfer as the neutrons are moderated or slowed down. For neutron energies above 10 MeV, inelastic processes are effective in attenuating neutrons.
As with nuclear power reactors, high-energy accelerators require heavy shielding to protect workers. Most of the dose equivalents to workers come from exposure to activated radioactive material during maintenance operations. Activation products are produced in the accelerator’s components and support systems.
Monitoring of the Workplace Environment
It is necessary to deal separately with the design of routine and of operational monitoring programs for the workplace environment. Special monitoring programs will be designed to achieve specific objectives. It is not desirable to design programs in general terms.
Routine monitoring for external radiation
An important part in the preparation of a program for routine monitoring for external radiation in the workplace is to conduct a comprehensive survey when a new radiation source or a new facility is put into service, or when any substantial changes have been made or may have been made in an existing installation.
The frequency of routine monitoring is determined by consideration of the expected changes in the radiation environment. If changes to the protective equipment or alterations of the processes conducted in the workplace are minimal or non-substantial, then routine radiation monitoring of the workplace is rarely required for review purposes. If the radiation fields are subject to increase rapidly and unpredictably to potentially hazardous levels, then an area radiation monitoring and warning system is required.
Operational monitoring for external radiation
The design of an operational monitoring program depends greatly on whether the operations to be conducted influence the radiation fields or whether the radiation fields will remain substantially constant throughout normal operations. The detailed design of such a survey depends critically on the form of the operation and on the conditions under which it takes place.
Routine monitoring for surface contamination
The conventional method of routine monitoring for surface contamination is to monitor a representative fraction of the surfaces in an area at a frequency dictated by experience. If operations are such that considerable surface contamination is likely and such that workers could carry significant amounts of radioactive material out of the work area in a single event, routine monitoring should be supplemented by the use of portal contamination monitors.
Operational monitoring for surface contamination
One form of operational monitoring is the surveying of items for contamination when they leave a radiologically controlled area. This monitoring must include workers’ hands and feet.
The principle objectives of a program of monitoring for surface contamination are:
- to assist in preventing the spread of radioactive contamination
- to detect failures of containment or departures from good operating procedures
- to limit surface contamination to levels at which general standards of good housekeeping are adequate to keep radiation exposures as low as reasonably achievable and to avoid excessive exposures caused by contamination of clothing and skin
- to provide information for the planning of optimized programs for individuals, for air monitoring and for defining operational procedures.
Monitoring for airborne contamination
The monitoring of airborne radioactive materials is important because inhalation is usually the most important route of intake of such material by radiation workers.
The monitoring of the workplace for airborne contamination will be needed on a routine basis in the following circumstances:
- when gaseous or volatile materials are handled in quantity
- when the handling of any radioactive material in such operations results in frequent and substantial contamination of the workplace
- during the processing of moderately to highly toxic radioactive materials
- during the handling of unsealed therapeutic radionuclides in hospitals
- during the use of hot cells, reactors and critical assemblies.
When an air monitoring program is required, it must:
- be able to assess the probable upper limit of the inhalation of radioactive material by radiation workers
- be able to draw attention to unexpected airborne contamination so that radiation workers can be protected and remedial measures instituted
- provide information for planning of programs of individual monitoring for internal contamination.
The most common form of monitoring for airborne contamination is the use of air samplers at a number of selected locations selected to be reasonably representative of the breathing zones of radiation workers. It may be necessary to make samples more accurately represent breathing zones by using personal air or lapel samplers.
Detection and measurement of radiation and radioactive contamination
The monitoring or surveying by wipes and instrument surveys of bench tops, floors, clothing, skin, and other surfaces are at best qualitative procedures. It is difficult to make them highly quantitative. The instruments used are usually detecting types rather than measuring devices. Since the amount of radioactivity involved is often small, the sensitivity of the instruments should be high.
The requirement for portability of contamination detectors depends on their intended uses. If the instrument is for general-purpose monitoring of laboratory surfaces, a portable type of instrument is desirable. If the instrument is for a specific use in which the item to be monitored can be brought to the instrument, then portability is not necessary. Clothing monitors and hand and shoe monitors generally are not portable.
Count-rate instruments and monitors usually incorporate meter readouts and aural outputs or earphone jacks. Table 4 identifies instruments that may be used for the detection of radioactive contamination.+
Table 4. Contamination detection instruments
|
Instrument |
Counting rate range and other characteristics1 |
Typical uses |
Remarks |
|
bg surface monitors2 |
|||
|
General |
|||
|
Portable count rate meter (thin-walled or thin window G-M3 counter) |
0-1,000 cpm |
Surfaces, hands, clothing |
Simple, reliable, battery-powered |
|
Thin end-window |
0-1,000 cpm |
Surfaces, hands, clothing |
Line-operated |
|
Personnel |
|||
|
Hand-and-shoe monitor, G-M or |
Between 1½ and 2 times natural |
Rapid monitoring for contamination |
Automatic operation |
|
Special |
|||
|
Laundry monitors, floor monitors, |
Between 1½ and 2 times natural |
Monitoring for contamination |
Convenient and rapid |
|
Alpha surface monitors |
|||
|
General |
|||
|
Portable air proportional counter with probe |
0-100,000 cpm over 100 cm2 |
Surfaces, hands, clothing |
Not for use in high humidity, battery- |
|
Portable gas-flow counter with probe |
0-100,000 cpm over 100 cm2 |
Surfaces, hands, clothing |
Battery-powered, fragile window |
|
Portable scintillation counter with probe |
0-100,000 cpm over 100 cm2 |
Surfaces, hands, clothing |
Battery-powered, fragile window |
|
Personal |
|||
|
Hand-and-shoe proportional counter-type, monitor |
0-2,000 cpm over about 300 cm2 |
Rapid monitoring of hands and shoes for contamination |
Automatic operation |
|
Hand-and-shoe scintillation counter-type, monitor |
0-4,000 cpm over about 300 cm2 |
Rapid monitoring of hands and shoes for contamination |
Rugged |
|
Wound monitors |
Low-energy photon detection |
Plutonium monitoring |
Special design |
|
Air monitors |
|||
|
Particle samplers |
|||
|
Filter paper, high-volume |
1.1 m3/min |
Quick grab samples |
Intermittent use, requires separate |
|
Filter paper, low volume |
0.2-20 m3/h |
Continuous room air monitoring |
Continuous use, requires separate |
|
Lapel |
0.03 m3/min |
Continuous breathing zone air monitoring |
Continuous use, requires separate |
|
Electrostatic precipitator |
0.09 m3/min |
Continuous monitoring |
Sample deposited on cylindrical shell, |
|
Impinger |
0.6-1.1 m3/min |
Alpha contamination |
Special uses, requires separate counter |
|
Tritium air monitors |
|||
|
Flow ionization chambers |
0-370 kBq/m3 min |
Continuous monitoring |
May be sensitive to other ionization |
|
Complete air monitoring systems |
Minimum detectable activity |
|
|
|
Fixed filter paper |
α » 0.04 Bq/m3; βγ » 0.04 Bq/m3 |
Background buildup can mask low-level activity, counter included |
|
|
Moving filter paper |
α » 0.04 Bq/m3; βγ » 0.04 Bq/m3 |
Continuous record of air activity, time of measurement can be adjusted from |
|
1 cpm = counts per minute.
2 Few surface monitors are suitable for detecting tritium (3H). Wipe tests counted by liquid scintillation devices are appropriate for detecting tritium contamination.
3 G-M = Geiger-Muller countrate meter.
Alpha contamination detectors
The sensitivity of an alpha detector is determined by its window area and window thickness. Generally window area is 50 cm2 or greater with a window areal density of 1 mg/cm2 or less. Alpha contamination monitors should be insensitive to beta and gamma radiation in order to minimize background interference. This is generally accomplished by pulse height discrimination in the counting circuit.
Portable alpha monitors can be either gas proportional counters or zinc sulphide scintillation counters.
Beta contamination detectors
Portable beta monitors of several types can be used for the detection of beta-particle contamination. Geiger-Mueller (G-M) count-rate meters generally require a thin window (areal density between 1 and 40 mg/cm2). Scintillation (anthracene or plastic) counters are very sensitive to beta particles and relatively insensitive to photons. Portable beta counters generally cannot be used to monitor for tritium (3H) contamination because tritium beta-particle energy is very low.
All instruments used for beta contamination monitoring also respond to background radiation. This must be taken into account when interpreting instrument readings.
When high background radiation levels exist, portable counters for contamination monitoring are of limited value, since they do not indicate small increases in initially high counting rates. Under these conditions smears or wipe tests are recommended.
Gamma contamination detectors
Since most gamma emitters also emit beta particles, most contamination monitors will detect both beta and gamma radiation. The usual practice is to use a detector that is sensitive to both types of radiation in order to have increased sensitivity, since the detection efficiency is usually greater for beta particles than for gamma rays. Plastic scintillators or sodium iodide (NaI) crystals are more sensitive to photons than are G-M counters, and are therefore recommended for detecting gamma rays.
Air samplers and monitors
Particulates may be sampled by the following methods: sedimentation, filtration, impaction and electrostatic or thermal precipitation. However, particulate contamination in the air is generally monitored by filtration (pumping air through filter media and measuring the radioactivity on the filter). Sampling flow rates generally are greater than 0.03 m3/min. However, most laboratories’ sampling flow rates are no more than 0.3 m3/min. Specific types of air samplers include “grab” samplers and continuous air monitors (CAM). The CAMs are available with either fixed or moving filter paper. A CAM should include an alarm since its principle function is to warn of changes in airborne contamination.
Because alpha particles have very short range, surface-loading filters (for example, membrane filters) must be used for the measurement of alpha-particle contamination. The sample collected must be thin. The time between collection and measurement must be considered to allow for the decay of radon (Rn) progeny.
Radioiodines such as 123I, 125I and 131I can be detected with filter paper (particularly if the paper is loaded with charcoal or silver nitrate) because some of the iodine will deposit on the filter paper. However, quantitative measurements require activated charcoal or silver zeolite traps or canisters to provide efficient absorption.
Tritiated water and tritium gas are the primary forms of tritium contamination. Although tritiated water has some affinity for most filter papers, filter paper techniques are not very effective for tritiated water sampling. The most sensitive and accurate measurement methods involve the absorption of tritiated water vapour condensate. Tritium in the air (for example, as hydrogen, hydrocarbons or water vapour) can be measured effectively with Kanne chambers (flow-through ionization chambers). Absorption of tritiated water vapour from an air sample can be accomplished by passing the sample through a trap containing a silica-gel molecular sieve or by bubbling the sample through distilled water.
Depending on the operation or process it may be necessary to monitor for radioactive gases. This can be accomplished with Kanne chambers. The most commonly used devices for sampling by absorption are fretted gas scrubbers and impingers. Many gases may also be collected by cooling the air below the freezing point of the gas and collecting the condensate. This method of collection is most often used for tritium oxide and noble gases.
There are a number of ways to obtain grab samples. The method selected should be appropriate for the gas to be sampled and the required method of analysis or measurement.
Monitoring of effluent
Effluent monitoring refers to the measurement of radioactivity at its point of release to the environment. It is relatively easy to accomplish because of the controlled nature of the sampling location, which is usually in a waste stream that is being discharged through a stack or liquid discharge line.
Continuous monitoring of airborne radioactivity may be necessary. In addition to the sample collection device, usually a filter, a typical sampling arrangement for particulates in air includes an air-moving device, a flowmeter and associated ducting. The air-moving device is located downstream from the sample collector; that is, the air is first passed through the sample collector, then through the remainder of the sampling system. Sampling lines, particularly those ahead of the sample collector system, should be kept as short as possible and free of sharp bends, areas of turbulence, or resistance to the air flow. Constant volume over a suitable range of pressure drops should be used for air sampling. Continuous sampling for radioactive xenon (Xe) or krypton (Kr) isotopes is accomplished by adsorption on activated charcoal or by cryogenic means. The Lucas cell is one of the oldest techniques and still the most popular method for the measurement of Rn concentrations.
Continuous monitoring of liquids and waste lines for radioactive materials is sometimes necessary. Waste lines from hot laboratories, nuclear medicine laboratories and reactor coolant lines are examples. Continuous monitoring can be performed, however, by routine laboratory analysis of a small sample proportional to the effluent flow rate. Samplers that take periodic aliquots or that continuously extract a small amount of liquid are available.
Grab sampling is the usual method used to determine the concentration of radioactive material in a hold-up tank. The sample must be taken after recirculation in order to compare the result of the measurement with allowable discharge rates.
Ideally, results of effluent monitoring and environmental monitoring will be in good agreement, with the latter calculable from the former with the aid of various pathway models. However, it must be recognized and emphasized that effluent monitoring, no matter how good or extensive, cannot substitute for actual measurement of radiological conditions in the environment.
Journalism
Journalism is one of the romantic professions, but it is also one of the most dangerous. Between 1990 and 1997 more than 500 journalists and media workers were killed, many the victims of gangsters, paramilitary groups and terrorists. Each year, hundreds of reporters and writers are injured, both physically and psychologically, by the horrors of war and social conflict. See figure 1.
Figure 1. Algiers, Algeria, 11 February 1996: The devastated offices of Le Soir, one of three newspapers hit by a terrorist car bomb.
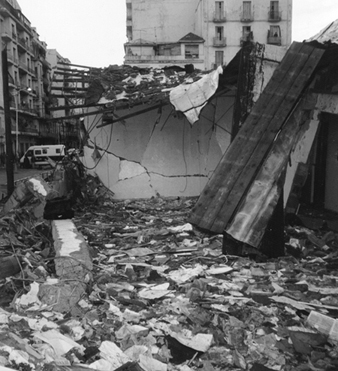
Le Soir
The tendency to try to manipulate or control information is becoming more evident as the speed and range of communication increases. Today information speeds around the world in seconds thanks to satellite technology. News and information can be beamed into people’s homes as it happens.
Consequently, journalists and their visible helpers—camera and technical staff, for instance—pose a threat to any group, official or otherwise, that wants to avoid public scrutiny. This leads to specific and targeted attacks on journalists and media organizations.
The problem of “censorship by violence” is exacerbated by the nature of commercial competition in the media industry and by unregulated patterns of employment. Media networks compete vigorously for market share, and this is leading to greater pressure on journalists to provide ever more dramatic and sensationalist images and reportage. Many media people are taking greater risks than before.
The situation is made worse because few media organizations provide training for their staff in how to deal with situations of violence and conflict. Such training is essential. Media staff need to be able to make coherent and sensible “risk assessment” judgements about fast-moving reporting situations. They need a basic knowledge of first aid and advice from media veterans on how to report from dangerous scenes.
The most vulnerable group of media workers—freelance journalists and casual staff—are the ones least likely to receive training even where it is available. More freelance staff are employed than ever before and many of them are hired from the regions where the reported action is taking place. Sometimes they are hired without any life or health insurance. If they get hurt, they are not entitled to compensation.
Because they often work in very unpredictable circumstances, some journalists will always be at risk. Often it will be impossible to avoid injury, even death. But much more can be done to minimize the levels of risk. For instance, in Algeria, where some 60 journalists were assassinated between June 1994 and March 1996, journalists’ unions, employers and the authorities have combined their efforts to minimize risks.
Much more needs to be done by media organizations and representatives of media workers and journalists to provide protections for media personnel. In particular there is a need for:
- Adequate preparation by journalists and media before going on assignment. Media organizations should provide technical assistance and establish training programmes specifically designed to improve levels of personal safety and to carry out risk assessment related to specific assignments.
- Health and life insurance for everyone reporting in the field, with established procedures to ensure that anyone who is likely to be at risk, including freelance staff or stringers, is covered.
In addition, media organizations must reverse recent trends that undermine the social and professional conditions in which journalists work. There should be increased investment in professional training and journalistic ethics to emphasize the importance of investigative journalism to the good health of democratic society.
Journalists themselves have a key role to play. All journalists must take responsibility to exercise the highest standards of personal safety and minimize risks to themselves and their colleagues. Journalists need to maintain the highest professional standards and conduct and should not compromise the ethics of journalism in any aspect of the gathering, production or dissemination of news and information.
But it is not only the professionals that need to take practical steps to address the issue. Governments, which have a responsibility to protect the lives and security of citizens, must ensure that journalists and media organizations are provided with the maximum security and protection from violence.
Government and public authorities must not regard journalists as part of the state security apparatus and must not demand information or materials from media organizations in order to assist inquiries which are the responsibility of official agencies.
One of the worrying features of journalism has always been that governments are prepared to use the cover of journalistic activity in order to carry out surveillance and espionage. It is a practice which exposes all travelling journalists to suspicion and intimidation.
The key is to reduce the risk. There are no absolute guarantees of safety, but governments, journalists and media organizations need to avoid creating the conditions which make it easier to commit violence against media. A starting point would be recognition that no single story, no matter how dramatic, is worth a life.
Sources of Ionizing Radiation
Ionizing Radiation Types
Alpha particles
An alpha particle is a tightly bound collection of two protons and two neutrons. It is identical to a helium-4 (4He) nucleus. Indeed, its ultimate fate after it loses most of its kinetic energy is to capture two electrons and become a helium atom.
Alpha-emitting radionuclides are generally relatively massive nuclei. Almost all alpha emitters have atomic numbers greater than or equal to that of lead (82Pb). When a nucleus decays by emitting an alpha particle, both its atomic number (number of protons) and its number of neutrons are reduced by two and its atomic mass number is reduced by four. For example, the alpha decay of uranium-238 (238U) to thorium-234 (234Th) is represented by:
![]()
![]()
The left superscript is the atomic mass number (number of protons plus neutrons), the left subscript is the atomic number (number of protons), and the right subscript is the number of neutrons.
Common alpha emitters emit alpha particles with kinetic energies between about 4 and 5.5 MeV. Such alpha particles have a range in air of no more than about 5 cm (see figure 1). Alpha particles with an energy of at least 7.5 MeV are required to penetrate the epidermis (the protective layer of skin, 0.07 mm thick). Alpha emitters generally do not pose an external radiation hazard. They are hazardous only if taken within the body. Because they deposit their energy in a short distance, alpha particles are high linear energy transfer (LET) radiation and have a large radiation weighting factor; typically, w R=20.
Figure 1. Range-energy radiation of slow alpha particles in air at 15 and 760 m
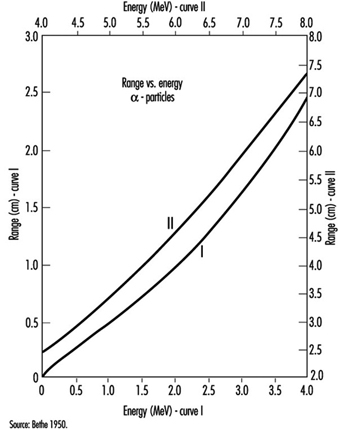
Beta particles
A beta particle is a highly energetic electron or positron. (A positron is the anti-particle of the electron. It has the same mass and most other properties of an electron except for its charge, which is exactly the same magnitude as that of an electron but is positive.) Beta-emitting radionuclides can be of high or low atomic weight.
Radionuclides that have an excess of protons in comparison with stable nuclides of about the same atomic mass number can decay when a proton in the nucleus converts to a neutron. When this occurs, the nucleus emits a positron and an extremely light, very non-interacting particle called a neutrino. (The neutrino and its anti-particle are of no interest in radiation protection.) When it has given up most of its kinetic energy, the positron ultimately collides with an electron and both are annihilated. The annihilation radiation produced is almost always two 0.511 keV (kiloelectron volt) photons travelling in directions 180 degrees apart. A typical positron decay is represented by:
![]()
where the positron is represented by β+ and the neutrino by n. Note that the resulting nuclide has the same atomic mass number as the parent nuclide and an atomic (proton) number larger by one and a neutron number lesser by one than those of the original nuclide.
Electron capture competes with positron decay. In electron capture decay, the nucleus absorbs an orbital electron and emits a neutrino. A typical electron capture decay is given by:
![]()
Electron capture is always possible when the resulting nucleus has a lower total energy than the initial nucleus. However, positron decay requires that the total energy of the initial atom is greater than that of the resulting atom by more than 1.02 MeV (twice the rest mass energy of the positron).
Similar to positron and electron capture decay, negatron (β–) decay occurs for nuclei that have an excess of neutrons compared to stable nuclei of about the same atomic mass number. In this case, the nucleus emits a negatron (energetic electron) and an anti-neutrino. A typical negatron decay is represented by:
![]()
where the negatron is represented by β– and the anti-neutrino by`n Here the resulting nucleus gains one neutron at the expense of one proton but again does not change its atomic mass number.
Alpha decay is a two-body reaction, so alpha particles are emitted with discrete kinetic energies. However, beta decay is a three-body reaction, so beta particles are emitted over a spectrum of energies. The maximum energy in the spectrum depends on the decaying radionuclide. The average beta energy in the spectrum is approximately one-third of the maximum energy (see figure 2).
Figure 2. Energy spectrum of negatrons emitted from 32P
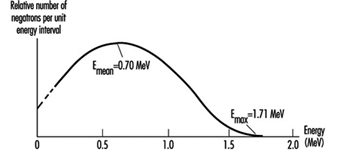
Typical maximum beta energies range from 18.6 keV for tritium (3H) to 1.71 MeV for phosphorus-32 (32P).
The range of beta particles in air is approximately 3.65 m per MeV of kinetic energy. Beta particles of at least 70 keV energy are required to penetrate the epidermis. Beta particles are low-LET radiation.
Gamma radiation
Gamma radiation is electromagnetic radiation emitted by a nucleus when it undergoes a transition from a higher to a lower energy state. The number of protons and neutrons in the nucleus does not change in such a transition. The nucleus may have been left in the higher energy state following an earlier alpha or beta decay. That is, gamma rays are often emitted immediately following alpha or beta decays. Gamma rays can also result from neutron capture and inelastic scattering of subatomic particles by nuclei. The most energetic gamma rays have been observed in cosmic rays.
Figure 3 is a picture of the decay scheme for cobalt-60 (60Co). It shows a cascade of two gamma rays emitted in nickel-60 (60Ni) with energies of 1.17 MeV and 1.33 MeV following the beta decay of 60Co.
Figure 3. Radioactive decay scheme for 60Co
Figure 4 is a picture of the decay scheme for molybdenum-99 (99Mo). Note that the resulting technetium-99 (99Tc) nucleus has an excited state that lasts for an exceptionally long time (t½ = 6 h). Such an excited nucleus is called an isomer. Most excited nuclear states have half-lives between a few picoseconds (ps) and 1 microsecond (μs).
Figure 4. Radioactive decay scheme for 99Mo
Figure 5 is a picture of the decay scheme for arsenic-74 (74As). It illustrates that some radionuclides decay in more than one way.
Figure 5. Radioactive decay scheme for 74As, illustrating competing processes of negatron emission, positron emission and electron capture (m0 is the rest mass of the electron)
While alpha and beta particles have definite ranges in matter, gamma rays are attenuated exponentially (ignoring build-up that results from scattering within a material) as they pass through matter. When build-up can be ignored the attenuation of gamma rays is given by:
![]()
where I(x) is the gamma ray intensity as a function of distance x into the material and μ is the mass attenuation coefficient. The mass attenuation coefficient depends on gamma-ray energy and on the material with which the gamma rays are interacting. Mass attenuation coefficient values are tabulated in many references. Figure 6 shows the absorption of gamma rays in matter in conditions of good geometry (build-up can be ignored).
Figure 6. Atenuation of 667 keV gamma rays in Al and Pb under conditions of good geometry (dashed line represents attenuation of a poly-energetic photon beam)
Build-up occurs when a broad gamma-ray beam interacts with matter. The measured intensity at points within the material is increased relative to the expected “good geometry” (narrow beam) value due to gamma rays scattered from the sides of the direct beam into the measuring device. The degree of build-up depends on the geometry of the beam, on the material and on the energy of the gamma rays.
Internal conversion competes with gamma emission when a nucleus transforms from a higher energy state to a lower one. In internal conversion, an inner orbital electron is ejected from the atom instead of the nucleus emitting a gamma ray. The ejected electron is directly ionizing. As outer orbital electrons drop to lower electronic energy levels to fill the vacancy left by the ejected electron, the atom emits x rays. Internal conversion probability relative to gamma emission probability increases with increasing atomic number.
X rays
X rays are electromagnetic radiation and, as such, are identical to gamma rays. The distinction between x rays and gamma rays is their origin. Whereas gamma rays originate in the atomic nucleus, x rays result from electron interactions. Although x rays often have lower energies than gamma rays, this is not a criterion for differentiating them. It is possible to produce x rays with energies much higher than gamma rays resulting from radioactive decay.
Internal conversion, discussed above, is one method of x ray production. In this case, the resulting x rays have discrete energies equal to the difference in the energy levels between which the orbital electrons transit.
Charged particles emit electromagnetic radiation whenever they are accelerated or decelerated. The amount of radiation emitted is inversely proportional to the fourth power of the particle’s mass. As a result, electrons emit much more x radiation than heavier particles such as protons, all other conditions being equal. X-ray systems produce x rays by accelerating electrons across a large electric potential difference of many kV or MV. The electrons are then quickly decelerated in a dense, heat-resistant material, such as tungsten (W).
The x rays emitted from such systems have energies spread over a spectrum ranging from about zero up to the maximum kinetic energy possessed by the electrons before deceleration. Often superimposed on this continuous spectrum are x rays of discrete energy. They are produced when the decelerating electrons ionize the target material. As other orbital electrons move to fill vacancies left after ionization, they emit x rays of discrete energies similar to the way x rays are emitted following internal conversion. They are called characteristic x rays because they are characteristic of the target (anode) material. See figure 7 for a typical x ray spectrum. Figure 8 depicts a typical x ray tube.
Figure 7. X-ray spectrum illustrating the contribution of characteristic x rays produced as electrons fill holes in the K shell of W (the wavelength of x rays is inversely proportional to their energy)
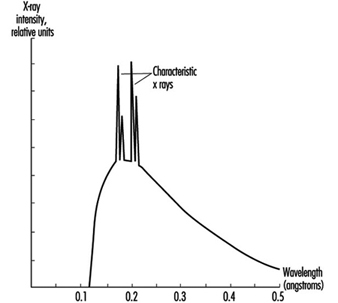
X rays interact with matter the same way gamma rays do, but a simple exponential attenuation equation does not adequately describe the attenuation of x rays with a continuous range of energies (see figure 6). However, as lower energy x rays are removed more rapidly from the beam than higher energy x rays as they pass through material, the description of attenuation approaches an exponential function.
Figure 8. A simplified x-ray tube with a stationary anode and a heated filament
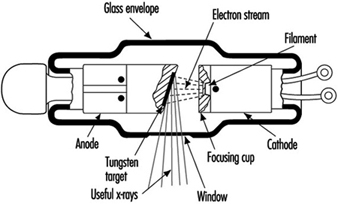
Neutrons
Generally, neutrons are not emitted as a direct result of natural radioactive decay. They are produced during nuclear reactions. Nuclear reactors produce neutrons in the greatest abundance but particle accelerators and special neutron sources, called (α, n) sources, also can yield neutrons.
Nuclear reactors produce neutrons when uranium (U) nuclei in nuclear fuel split, or fission. Indeed, the production of neutrons is essential in maintaining nuclear fission in a reactor.
Particle accelerators produce neutrons by accelerating charged particles, such as protons or electrons, to high energies to bombard stable nuclei in a target. Neutrons are only one of the particles that can result from such nuclear reactions. For example, the following reaction produces neutrons in a cyclotron that is accelerating deuterium ions to bombard a beryllium target:
![]()
Alpha emitters mixed with beryllium are portable sources of neutrons. These (α, n) sources produce neutrons via the reaction:
![]()
The source of the alpha particles can be such isotopes as polonium-210 (210Po),
plutonium-239 (239Pu) and americium-241 (241Am).
Neutrons are generally classified according to their energy as illustrated in table 1. This classification is somewhat arbitrary and may vary in different contexts.
Table 1. Classification of neutrons according to kinetic energy
|
Type |
Energy range |
|
Slow or thermal |
0-0.1 keV |
|
Intermediate |
0.1-20 keV |
|
Fast |
20 keV-10 MeV |
|
High-energy |
>10 MeV |
A number of possible modes of neutron interaction with matter exist, but the two main modes for the purposes of radiation safety are elastic scattering and neutron capture.
Elastic scattering is the means by which higher-energy neutrons are reduced to thermal energies. Higher-energy neutrons interact primarily by elastic scattering and generally do not cause fission or produce radioactive material by neutron capture. It is thermal neutrons that are primarily responsible for the latter types of interaction.
Elastic scattering occurs when a neutron interacts with a nucleus and bounces off with reduced energy. The interacting nucleus takes up the kinetic energy the neutron loses. After being excited in this manner, the nucleus soon gives up this energy as gamma radiation.
When the neutron eventually reaches thermal energies (so-called because the neutron is in thermal equilibrium with its environment), it is easily captured by most nuclei. Neutrons, having no charge, are not repelled by the positively charged nucleus as are protons. When a thermal neutron approaches a nucleus and comes within the range of the strong nuclear force, on the order of a few fm (fm = 10–15 metres), the nucleus captures the neutron. The result can then be a radioactive nucleus that emits a photon or other particle or, in the case of fissionable nuclei such as 235U and 239Pu, the capturing nucleus can fission into two smaller nuclei and more neutrons.
The laws of kinematics indicate that neutrons will reach thermal energies more rapidly if the elastic scattering medium includes a large number of light nuclei. A neutron rebounding off a light nucleus loses a much larger percentage of its kinetic energy than when it bounces off of a heavy nucleus. For this reason, water and hydrogenous materials are the best shielding material to slow down neutrons.
A monoenergetic beam of neutrons will attenuate exponentially in material, obeying an equation similar to that given above for photons. The probability of a neutron interacting with a given nucleus is described in terms of the quantity cross section. Cross section has units of area. The special unit for cross section is the barn (b), defined by:
![]()
It is extremely difficult to produce neutrons without accompanying gamma and x rays. It may be generally assumed that if neutrons are present, so are high energy photons.
Ionizing Radiation Sources
Primordial radionuclides
Primordial radionuclides occur in nature because their half-lives are comparable with the age of the earth. Table 2 lists the most important primordial radionuclides.
Table 2. Primordial radionuclides
|
Radioisotope |
Half-life (109 Y) |
Abundance (%) |
|
238U |
4.47 |
99.3 |
|
232Th |
14.0 |
100 |
|
235U |
0.704 |
0.720 |
|
40K |
1.25 |
0.0117 |
|
87Rb |
48.9 |
27.9 |
Uranium and thorium isotopes head a long chain of progeny radioisotopes that, as a result, are also naturally occurring. Figure 9, A-C, illustrates the decay chains for 232Th, 238U and 235U, respectively. Because alpha decay is common above atomic mass number 205 and an alpha particle’s atomic mass number is 4, there are four distinct decay chains for heavy nuclei. One of these chains (see figure 9, D), that for 237Np, does not occur in nature. This is because it does not contain a primordial radionuclide (that is, no radionuclide in this chain has a half-life comparable with the age of the earth).
Figure 9. Decay series (Z = atomic number; N = atomic mass number)
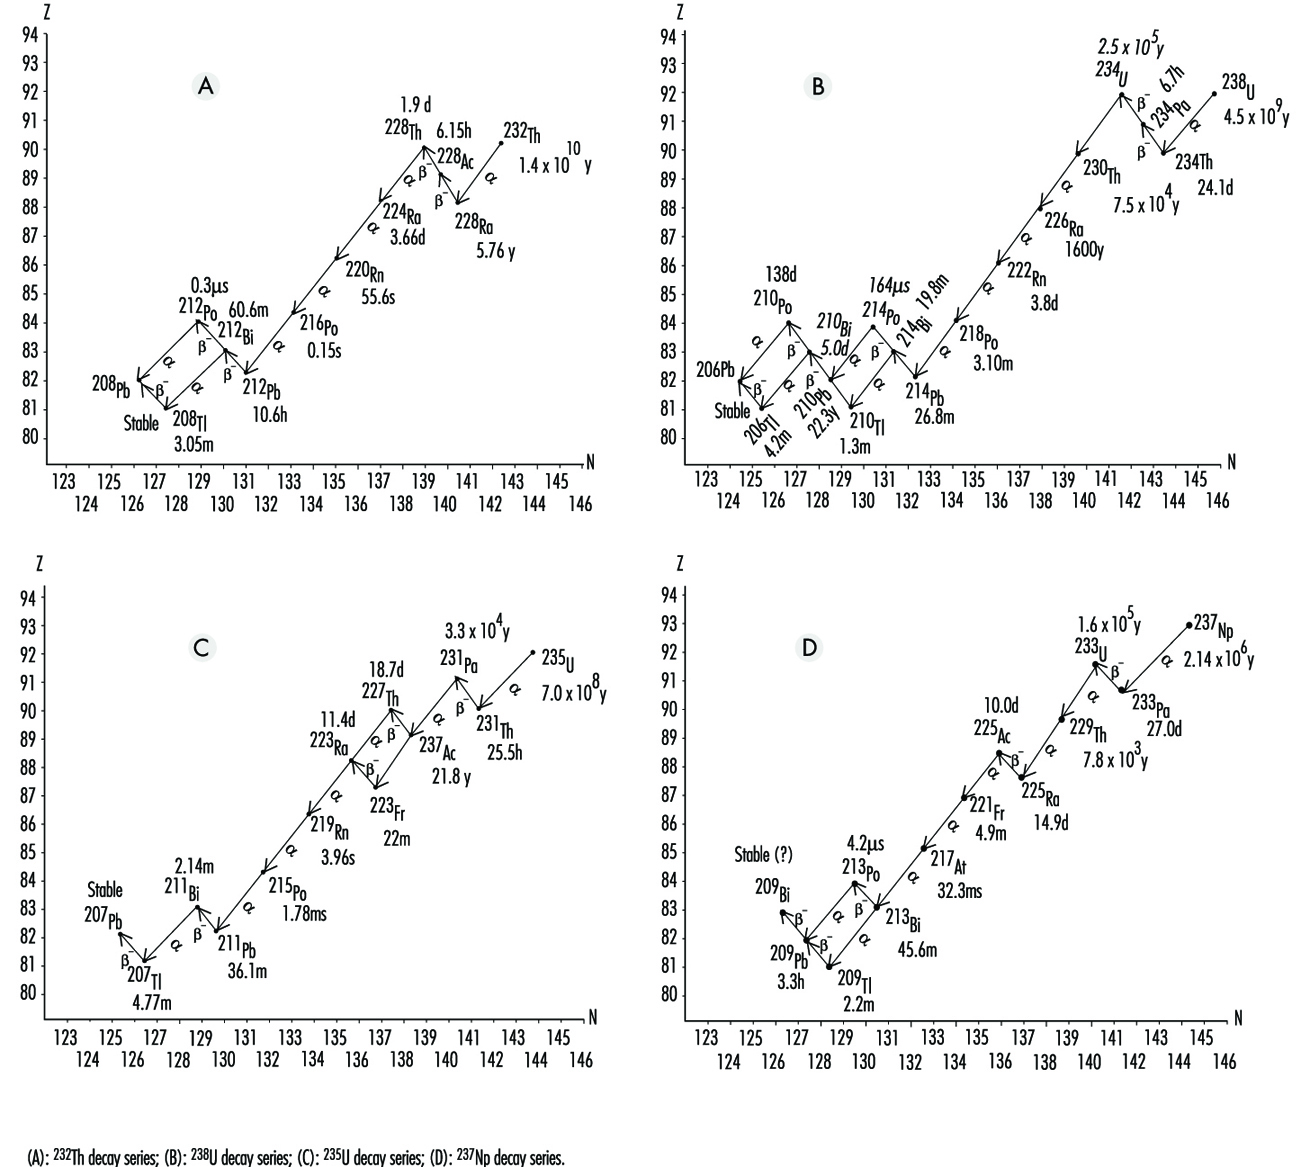 Note that radon (Rn) isotopes occur in each chain (219Rn, 220Rn and 222Rn). Since Rn is a gas, once Rn is produced, it has a chance of escape to the atmosphere from the matrix in which it was formed. However, the half-life of 219Rn is much too short to allow significant amounts of it to reach a breathing zone. The relatively short half-life of 220Rn usually makes it a lesser health hazard concern than 222Rn.
Not including Rn, primordial radionuclides external to the body deliver on the average about 0.3 mSv annual effective dose to the human population. The actual annual effective dose varies widely and is determined primarily by the concentration of uranium and thorium in the local soil. In some parts of the world where monazite sands are common, the annual effective dose to a member of the population is as high as about 20 mSv. In other places such as on coral atolls and near seashores, the value may be as low as 0.03 mSv (see figure 9).
Radon is usually considered separately from other naturally occurring terrestrial radionuclides. It seeps into the air from the soil. Once in the air, Rn further decays to radioactive isotopes of Po, bismuth (Bi) and Pb. These progeny radionuclides attach themselves to dust particles that may be breathed in and trapped in the lungs. Being alpha emitters, they deliver almost all of their radiation energy to the lungs. It is estimated that the average annual lung equivalent dose from such exposure is about 20 mSv. This lung equivalent dose is comparable to a whole body effective dose of about 2 mSv. Clearly, Rn and its progeny radionuclides are the most significant contributors to background radiation effective dose (see figure 9).
Cosmic rays
Cosmic radiation includes energetic particles of extraterrestrial origin that strike the atmosphere of the earth (primarily particles and mostly protons). It also includes secondary particles; mostly photons, neutrons and muons, generated by interactions of primary particles with gases in the atmosphere.
By virtue of these interactions, the atmosphere serves as a shield against cosmic radiation, and the thinner this shield, the greater the effective dose rate. Thus, the cosmic-ray effective dose rate increases with altitude. For example, the dose rate at an altitude of 1,800 metres is about double that at sea level.
Because primary cosmic radiation consists mostly of charged particles, it is influenced by the earth’s magnetic field. People living in higher latitudes receive greater effective doses of cosmic radiation than those closer to the earth’s equator. Variation due to this effect is of the order
of 10%.
Finally, the cosmic-ray effective dose rate varies according to modulation of the sun’s cosmic-ray output. On the average, cosmic rays contribute about 0.3 mSv to background radiation whole-body effective dose.
Cosmogenic radionuclides
Cosmic rays produce cosmogenic radionuclides in the atmosphere. The most prominent of these are tritium (3H), beryllium-7 (7Be), carbon-14 (14C) and sodium-22 (22Na). They are produced by cosmic rays interacting with atmospheric gases. Cosmogenic radionuclides deliver about 0.01 mSv annual effective dose. Most of this comes from 14C.
Nuclear fallout
From the 1940s through the 1960s, extensive testing of nuclear weapons above ground occurred. This testing produced large quantities of radioactive materials and distributed them to the environment throughout the world as fallout. Although much of this debris has since decayed to stable isotopes, small amounts that remain will be a source of exposure for many years to come. In addition, nations that continue to occasionally test nuclear weapons in the atmosphere add to the worldwide inventory.
The primary fallout contributors to effective dose currently are strontium-90 (90Sr) and caesium-137 (137Cs), both of which have half-lives around 30 years. The average annual effective dose from fallout is about 0.05 mSv.
Radioactive material in the body
The deposition of naturally occurring radionuclides in the human body results primarily from the inhalation and ingestion of these materials in air, food and water. Such nuclides include radioisotopes of Pb, Po, Bi, Ra, K (potassium), C, H, U and Th. Of these, 40K is the largest contributor. Naturally occurring radionuclides deposited in the body contribute about 0.3 mSv to the annual effective dose.
Machine-produced radiation
The use of x rays in the healing arts is the largest source of exposure to machine-produced radiation. Millions of medical x ray systems are in use around the world. The average exposure to these medical x ray systems is greatly dependent on a population’s access to care. In developed countries, the average annual effective dose from medically prescribed radiation from x rays and radioactive material for diagnosis and therapy is on the order of 1 mSv.
X rays are a by-product of most high-energy physics particle accelerators, especially those that accelerate electrons and positrons. However, appropriate shielding and safety precautions plus the limited population at risk make this source of radiation exposure less significant than the above sources.
Machine-produced radionuclides
Particle accelerators can produce a large variety of radionuclides in varying quantities by way of nuclear reactions. Accelerated particles include protons, deuterons (2H nuclei), alpha particles, charged mesons, heavy ions and so on. Target materials can be made of almost any isotope.
Particle accelerators are virtually the only source for positron-emitting radioisotopes. (Nuclear reactors tend to produce neutron-rich radioisotopes that decay by negatron emission.) They are also being increasingly used to produce short-lived isotopes for medical use, especially for positron-emission tomography (PET).
Technologically enhanced material and consumer products
X rays and radioactive materials appear, wanted and unwanted, in a great number of modern-day operations. Table 3 lists these radiation sources.
Table 3. Sources and estimates of associated population effective doses from technologically enhanced material and consumer products
|
Group I - Involves large numbers of people and the individual effective dose is very |
|
|
Tobacco products |
Combustible fuels |
|
Domestic water supplies |
Glass and ceramics |
|
Building materials |
Ophthalmic glass |
|
Mining and agricultural products |
|
|
Group II - Involves many people but the effective dose is relatively small or is limited |
|
|
Television receivers |
Highway and road construction materials |
|
Radioluminous products |
Aircraft transport of radioactive materials |
|
Airport inspection systems |
Spark gap irradiators and electron tubes |
|
Gas and aerosol (smoke) detectors |
Thorium products - fluorescent lamp starters |
|
Group III - Involves relatively few people and the collective effective dose is small |
|
|
Thorium products - tungsten welding rods |
|
Source: NCRP 1987.
" DISCLAIMER: The ILO does not take responsibility for content presented on this web portal that is presented in any language other than English, which is the language used for the initial production and peer-review of original content. Certain statistics have not been updated since the production of the 4th edition of the Encyclopaedia (1998)."